Lycopodium Limited provides engineering, project delivery, and asset management services to the resources, infrastructure, and industrial processes sectors globally.
Ticker code: LYL
Sector: Industrials | Industry: Engineering & Construction | Website: https://www.lycopodium.com
Market Information
| Market Capitalisation | Enterprise Value | Shares Outstanding | Free Float [%] | Free Float Value |
|---|---|---|---|---|
| $530,532,032 | $467,915,490 | 39740226 | 61.11 | $324,231,513 |
Balance Sheet & Quality
| Equity | Cash | Debt | Return On Equity (ROE) | EBITDA 25 Margin [%] | Net Debt / Equity [%] | Rule of 40 |
|---|---|---|---|---|---|---|
| $155,225,315 | $79,035,624 | $16,419,082 | 0.0 | None | -40.3 | None |
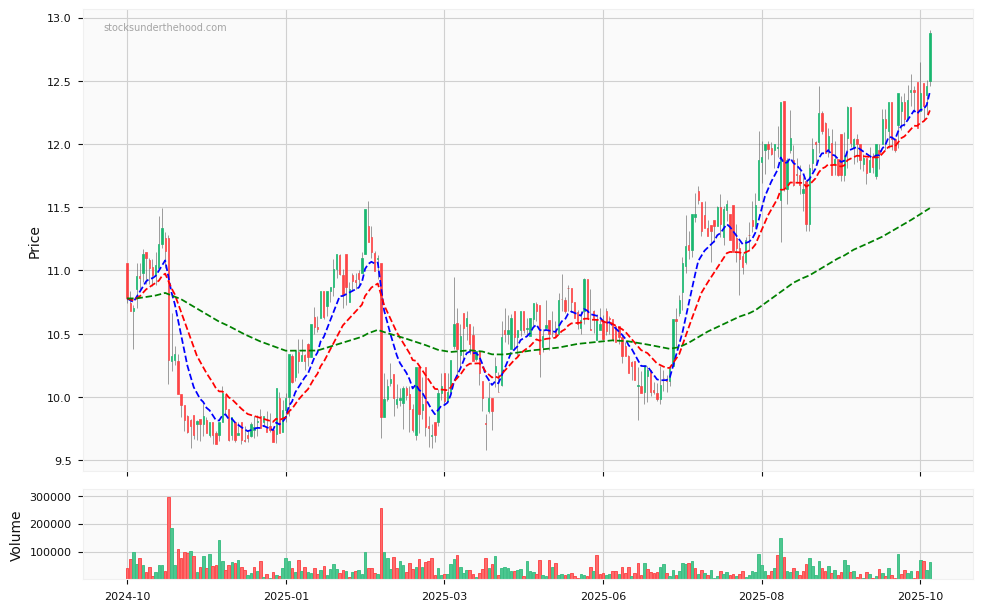
Technicals & Short Data
| 3EMA Status | Volatility [%] | Value Traded Today | Average Daily Liquidity | Short [%] | Days To Cover |
|---|---|---|---|---|---|
| Positive | 4.4 | $332,909 | $488,049 | 0.0 | 0.0 |
Dividends
| Previous Dividend | Last Dividend | Franking [%] | Ex-Div Date | Gross Yield [%] |
|---|---|---|---|---|
| $0.100 | $0.250 | 100.0 | 2025-09-18 | 2.7 |
Price Performance Snapshot
| Last Traded Price | Change [%] | 1 Week [%] | 1 Month [%] | 3 Months [%] | 6 Months [%] | 12 Months [%] |
|---|---|---|---|---|---|---|
| $13.350 | 0.5 | 2.1 | 4.8 | 9.0 | 28.0 | 35.7 |
LYL Price Chart with Volume and 3EMA
LYL Short Positions

Click HERE to understand why the above moving averages have been chosen.