Mader Group Limited provides specialized contract labor for maintenance and repair of heavy mobile equipment in the resources industry, operating across Australia and internationally.
Ticker code: MAD
Sector: Industrials | Industry: Specialty Business Services | Website: https://www.madergroup.com.au
Market Information
| Market Capitalisation | Enterprise Value | Shares Outstanding | Free Float [%] | Free Float Value |
|---|---|---|---|---|
| $1,536,136,085 | $1,551,205,085 | 203461728 | 29.68 | $455,981,839 |
Balance Sheet & Quality
| Equity | Cash | Debt | Return On Equity (ROE) | EBITDA 25 Margin [%] | Net Debt / Equity [%] | Rule of 40 |
|---|---|---|---|---|---|---|
| $214,041,746 | $24,263,000 | $39,332,000 | 26.3 | 12.5 | 7.0 | 24.9 |
Technicals & Short Data
| 3EMA Status | Volatility [%] | Value Traded Today | Average Daily Liquidity | Short [%] | Days To Cover |
|---|---|---|---|---|---|
| Negative | 8.5 | $2,260,130 | $1,233,428 | 0.39 | 4.9 |
Dividends
| Previous Dividend | Last Dividend | Franking [%] | Ex-Div Date | Gross Yield [%] |
|---|---|---|---|---|
| $0.040 | $0.048 | 100.0 | 2025-09-18 | 0.9 |
Price Performance Snapshot
| Last Traded Price | Change [%] | 1 Week [%] | 1 Month [%] | 3 Months [%] | 6 Months [%] | 12 Months [%] |
|---|---|---|---|---|---|---|
| $7.550 | -1.9 | -6.8 | -14.2 | -9.9 | 27.0 | 23.6 |
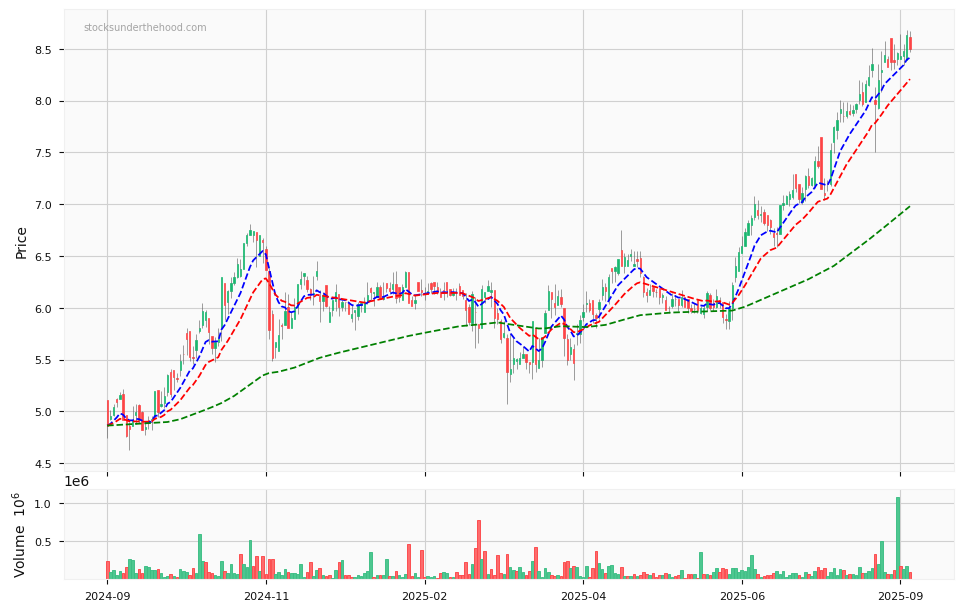
MAD Price Chart with Volume and 3EMA
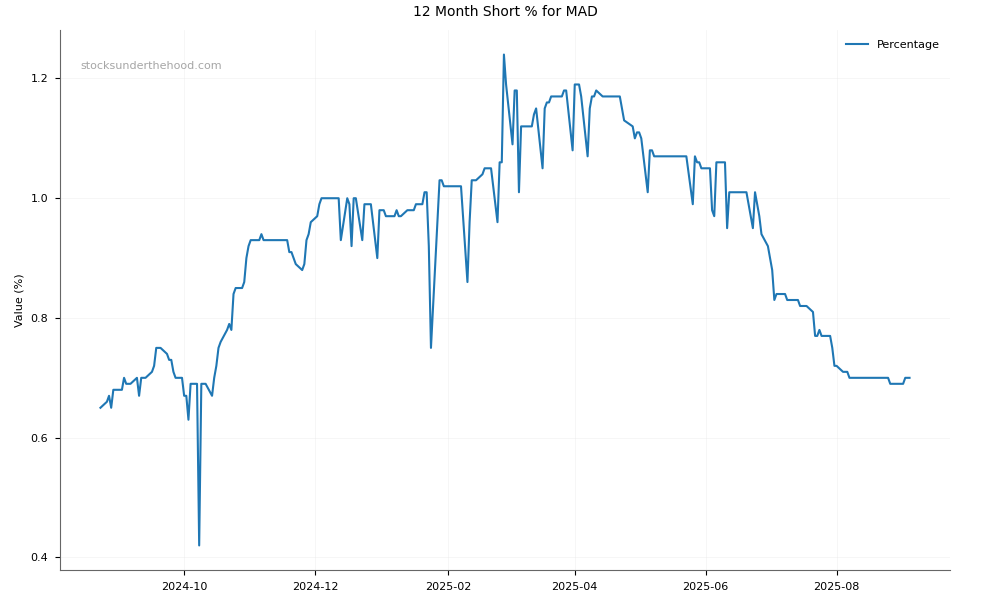
MAD Short Positions
Click HERE to understand why the above moving averages have been chosen.