Macquarie Telecom Group Limited provides telecommunications, cloud computing, cybersecurity, and data center services to business and government customers in Australia.
Ticker code: MAQ
Sector: Technology | Industry: Information Technology Services | Website: https://macquarietechnologygroup.com
Market Information
| Market Capitalisation | Enterprise Value | Shares Outstanding | Free Float [%] | Free Float Value |
|---|---|---|---|---|
| $1,678,385,499 | $1,744,905,499 | 25773732 | 50.43 | $846,359,466 |
Balance Sheet & Quality
| Equity | Cash | Debt | Return On Equity (ROE) | EBITDA 25 Margin [%] | Net Debt / Equity [%] | Rule of 40 |
|---|---|---|---|---|---|---|
| $486,994,672 | $62,362,000 | $128,882,000 | 6.3 | 30.7 | 13.7 | 31.8 |
Technicals & Short Data
| 3EMA Status | Volatility [%] | Value Traded Today | Average Daily Liquidity | Short [%] | Days To Cover |
|---|---|---|---|---|---|
| Partial | 2.9 | $1,337,369 | $4,347,672 | 2.25 | 8.7 |
Dividends
| Previous Dividend | Last Dividend | Franking [%] | Ex-Div Date | Gross Yield [%] |
|---|---|---|---|---|
| None | None | None | 2018-09-27 | 0.0 |
Price Performance Snapshot
| Last Traded Price | Change [%] | 1 Week [%] | 1 Month [%] | 3 Months [%] | 6 Months [%] | 12 Months [%] |
|---|---|---|---|---|---|---|
| $65.120 | -2.8 | -2.6 | 1.5 | -5.3 | 8.8 | -19.7 |
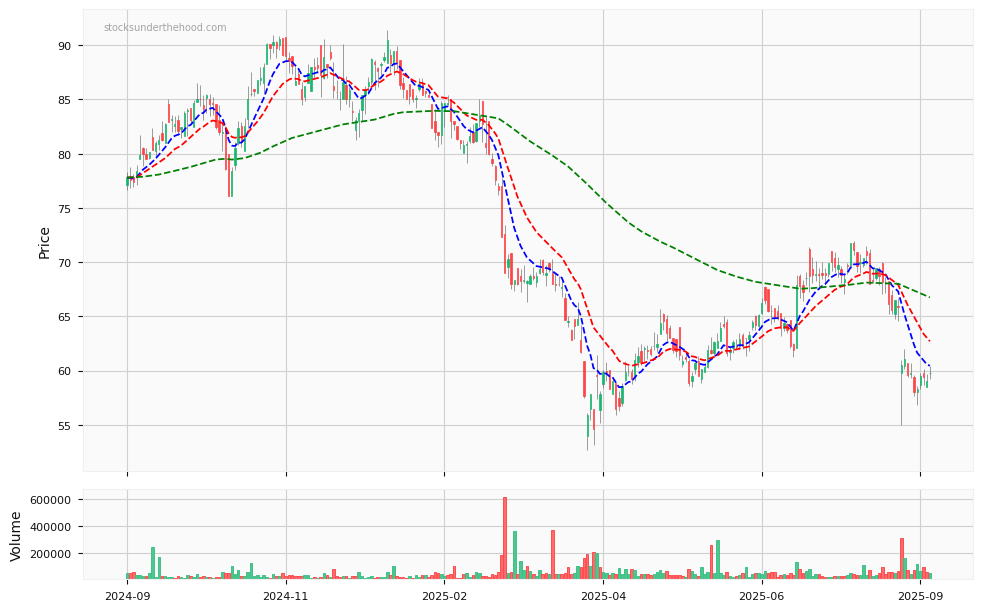
MAQ Price Chart with Volume and 3EMA
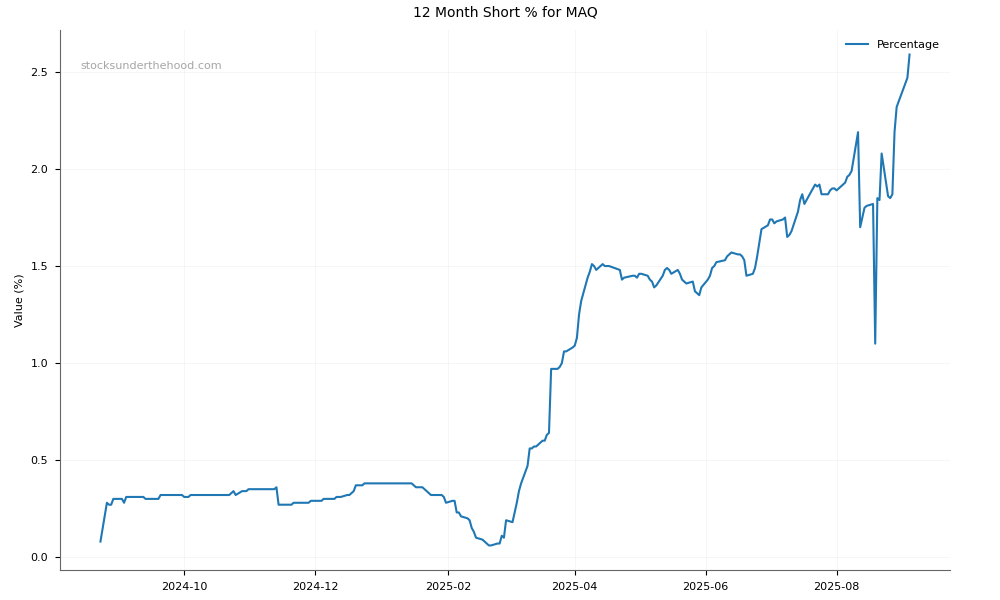
MAQ Short Positions
Click HERE to understand why the above moving averages have been chosen.