Maas Group Holdings Limited is a diversified industrial group providing construction materials, equipment, and services to the civil, infrastructure, and mining sectors in Australia.
Ticker code: MGH
Sector: Industrials | Industry: Engineering & Construction | Website: https://www.maasgroup.com.au
Market Information
| Market Capitalisation | Enterprise Value | Shares Outstanding | Free Float [%] | Free Float Value |
|---|---|---|---|---|
| $1,633,440,428 | $2,324,382,420 | 363795214 | 41.1 | $671,353,086 |
Balance Sheet & Quality
| Equity | Cash | Debt | Return On Equity (ROE) | EBITDA 25 Margin [%] | Net Debt / Equity [%] | Rule of 40 |
|---|---|---|---|---|---|---|
| $882,567,231 | $110,223,000 | $801,164,992 | 9.5 | 21.6 | 78.3 | 23.8 |
Technicals & Short Data
| 3EMA Status | Volatility [%] | Value Traded Today | Average Daily Liquidity | Short [%] | Days To Cover |
|---|---|---|---|---|---|
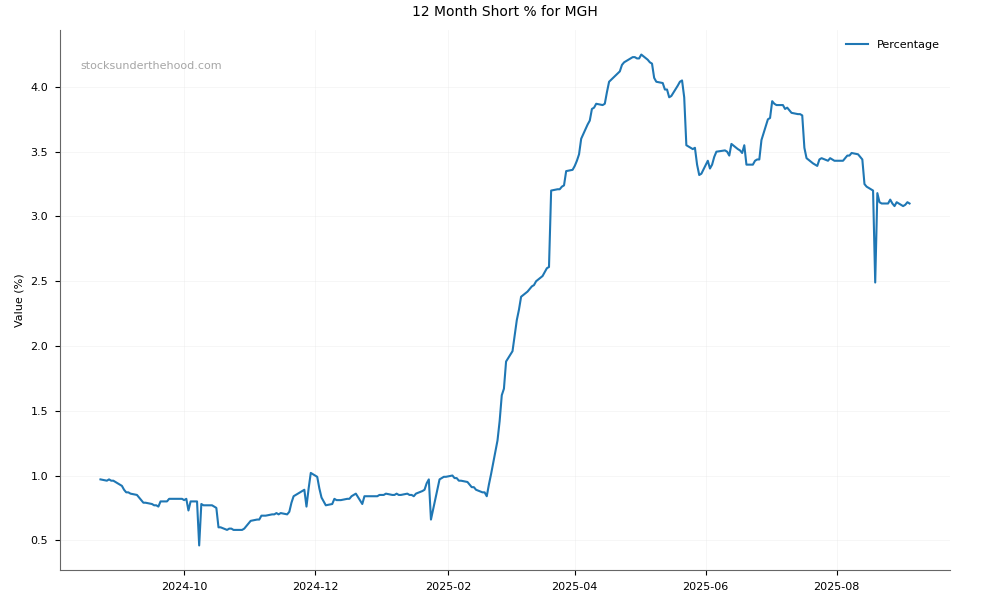
| Positive | 5.8 | $829,438 | $2,356,280 | 3.13 | 21.7 |
Dividends
| Previous Dividend | Last Dividend | Franking [%] | Ex-Div Date | Gross Yield [%] |
|---|---|---|---|---|
| $0.035 | $0.035 | 100.0 | 2025-09-17 | 1.1 |
Price Performance Snapshot
| Last Traded Price | Change [%] | 1 Week [%] | 1 Month [%] | 3 Months [%] | 6 Months [%] | 12 Months [%] |
|---|---|---|---|---|---|---|
| $4.490 | -0.2 | -0.7 | 2.3 | -0.5 | 6.0 | -5.1 |
MGH Price Chart with Volume and 3EMA

MGH Short Positions
Click HERE to understand why the above moving averages have been chosen.