Myer Holdings Limited operates a chain of department stores across Australia, offering a wide range of products, including clothing, accessories, cosmetics, homewares, and electrical goods.
Ticker code: MYR
Sector: Consumer Cyclical | Industry: Department Stores | Website: https://www.myer.com.au
Market Information
| Market Capitalisation | Enterprise Value | Shares Outstanding | Free Float [%] | Free Float Value |
|---|---|---|---|---|
| $735,567,155 | $828,534,155 | 1730746199 | 69.73 | $512,892,523 |
Balance Sheet & Quality
| Equity | Cash | Debt | Return On Equity (ROE) | EBITDA 25 Margin [%] | Net Debt / Equity [%] | Rule of 40 |
|---|---|---|---|---|---|---|
| $891,334,273 | $26,563,000 | $119,530,000 | 5.6 | 5.1 | 10.4 | 22.7 |
Technicals & Short Data
| 3EMA Status | Volatility [%] | Value Traded Today | Average Daily Liquidity | Short [%] | Days To Cover |
|---|---|---|---|---|---|
| Negative | 4.1 | $989,522 | $3,851,580 | 3.98 | 7.6 |
Dividends
| Previous Dividend | Last Dividend | Franking [%] | Ex-Div Date | Gross Yield [%] |
|---|---|---|---|---|
| None | None | 100.0 | 2024-10-03 | 0.0 |
Price Performance Snapshot
| Last Traded Price | Change [%] | 1 Week [%] | 1 Month [%] | 3 Months [%] | 6 Months [%] | 12 Months [%] |
|---|---|---|---|---|---|---|
| $0.425 | -2.3 | None | -8.6 | -30.9 | -39.3 | -53.0 |
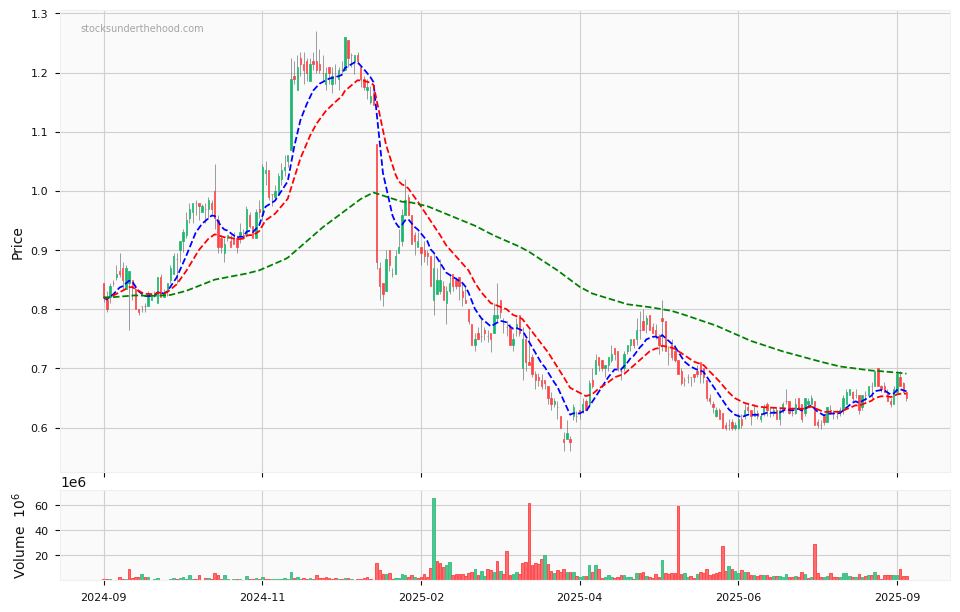
MYR Price Chart with Volume and 3EMA
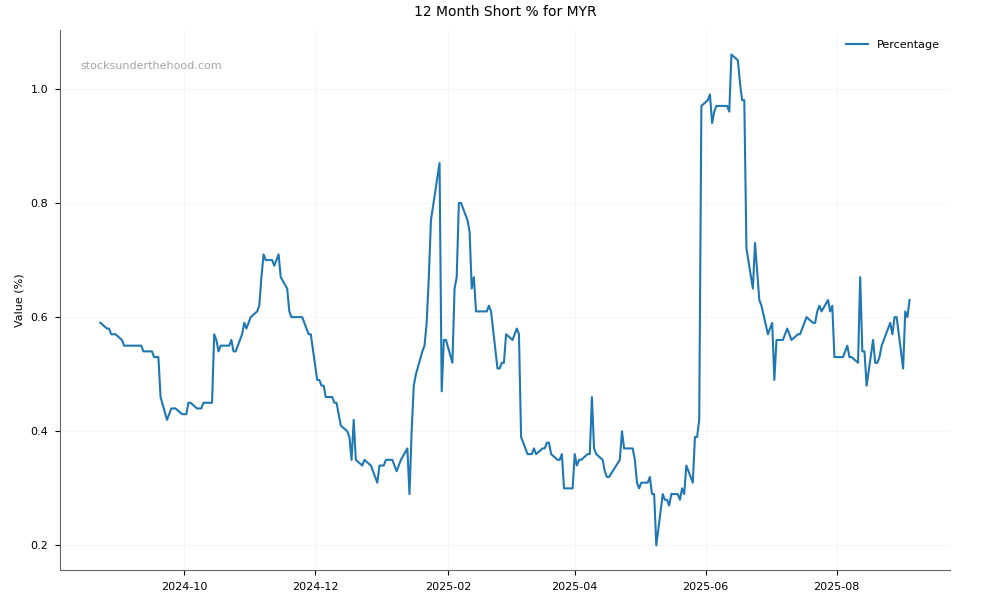
MYR Short Positions
Click HERE to understand why the above moving averages have been chosen.