OFX Group Limited, formerly known as OzForex Group, is a global provider of online international payment services for consumer and business clients, offering competitive exchange rates and low fees.
Ticker code: OFX
Sector: Financial Services | Industry: Capital Markets | Website: https://www.ofx.com
Market Information
| Market Capitalisation | Enterprise Value | Shares Outstanding | Free Float [%] | Free Float Value |
|---|---|---|---|---|
| $130,915,972 | $64,194,972 | 231709686 | 89.22 | $116,809,776 |
Balance Sheet & Quality
| Equity | Cash | Debt | Return On Equity (ROE) | EBITDA 25 Margin [%] | Net Debt / Equity [%] | Rule of 40 |
|---|---|---|---|---|---|---|
| $181,196,972 | $96,886,000 | $30,165,000 | 14.1 | 25.6 | -36.8 | 30.8 |
Technicals & Short Data
| 3EMA Status | Volatility [%] | Value Traded Today | Average Daily Liquidity | Short [%] | Days To Cover |
|---|---|---|---|---|---|
| Negative | 7.0 | $182,709 | $386,428 | 0.2 | 0.7 |
Dividends
| Previous Dividend | Last Dividend | Franking [%] | Ex-Div Date | Gross Yield [%] |
|---|---|---|---|---|
| None | None | None | 2020-11-25 | 0.0 |
Price Performance Snapshot
| Last Traded Price | Change [%] | 1 Week [%] | 1 Month [%] | 3 Months [%] | 6 Months [%] | 12 Months [%] |
|---|---|---|---|---|---|---|
| $0.565 | -0.9 | -7.4 | -3.4 | -33.5 | -18.1 | -59.8 |
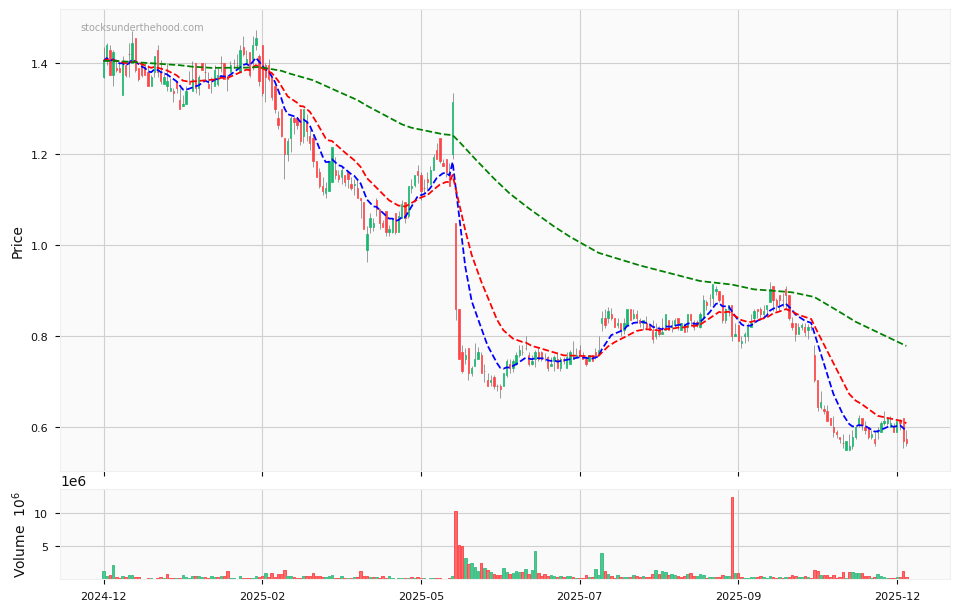
OFX Price Chart with Volume and 3EMA
OFX Short Positions

Click HERE to understand why the above moving averages have been chosen.