Oneview Healthcare PLC provides a digital health platform that integrates clinical and patient engagement systems, enhancing patient care and experience in healthcare facilities.
Ticker code: ONE
Sector: Healthcare | Industry: Health Information Services | Website: https://www.oneviewhealthcare.com
Market Information
| Market Capitalisation | Enterprise Value | Shares Outstanding | Free Float [%] | Free Float Value |
|---|---|---|---|---|
| $295,089,114 | $287,877,114 | 808463304 | 44.27 | $130,628,197 |
Balance Sheet & Quality
| Equity | Cash | Debt | Return On Equity (ROE) | EBITDA 25 Margin [%] | Net Debt / Equity [%] | Rule of 40 |
|---|---|---|---|---|---|---|
| $8,084,633 | $8,191,000 | $979,000 | -94.3 | -51.0 | -89.2 | None |
Technicals & Short Data
| 3EMA Status | Volatility [%] | Value Traded Today | Average Daily Liquidity | Short [%] | Days To Cover |
|---|---|---|---|---|---|
| Positive | 25.2 | $142,484 | $104,309 | 1.87 | 52.9 |
Dividends
| Previous Dividend | Last Dividend | Franking [%] | Ex-Div Date | Gross Yield [%] |
|---|---|---|---|---|
| None | None | None | None | 0.0 |
Price Performance Snapshot
| Last Traded Price | Change [%] | 1 Week [%] | 1 Month [%] | 3 Months [%] | 6 Months [%] | 12 Months [%] |
|---|---|---|---|---|---|---|
| $0.365 | 4.3 | 9.0 | 58.7 | 58.7 | 37.7 | 12.3 |
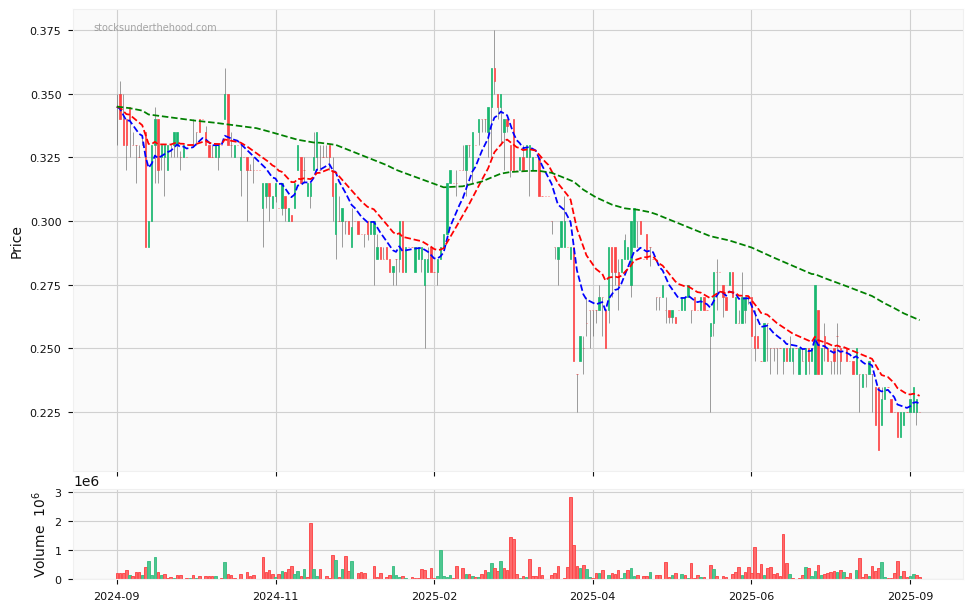
ONE Price Chart with Volume and 3EMA
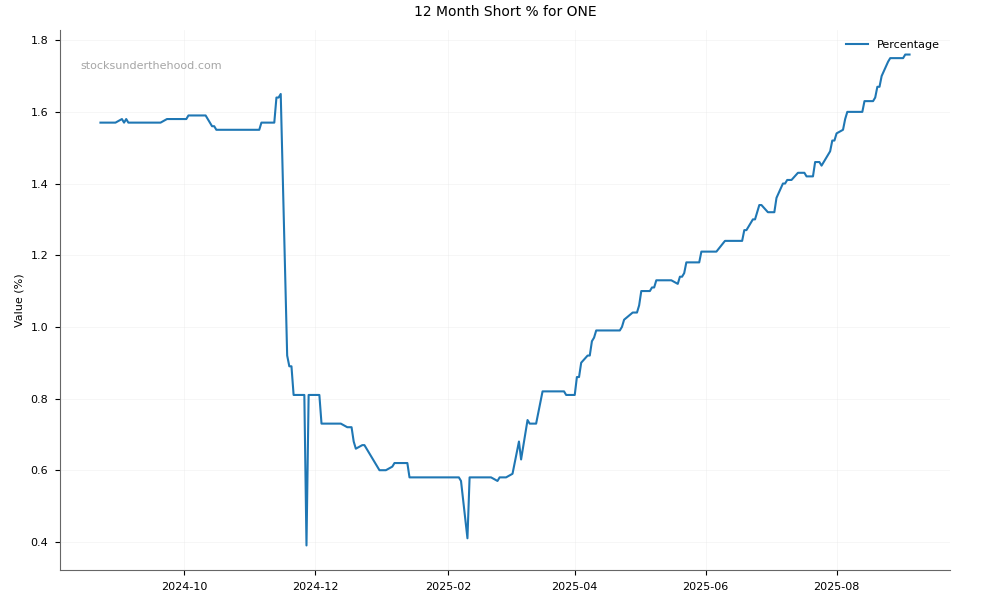
ONE Short Positions
Click HERE to understand why the above moving averages have been chosen.