Playside Studios Limited is an Australian video game developer, creating and publishing games across various platforms, including mobile, virtual reality, and PC, with a portfolio of original and licensed titles.
Ticker code: PLY
Sector: Communication Services | Industry: Electronic Gaming & Multimedia | Website: https://www.playsidestudios.com
Market Information
| Market Capitalisation | Enterprise Value | Shares Outstanding | Free Float [%] | Free Float Value |
|---|---|---|---|---|
| $95,085,494 | $82,780,494 | 452788082 | 41.84 | $39,788,221 |
Balance Sheet & Quality
| Equity | Cash | Debt | Return On Equity (ROE) | EBITDA 25 Margin [%] | Net Debt / Equity [%] | Rule of 40 |
|---|---|---|---|---|---|---|
| $43,467,655 | $13,477,000 | $1,172,000 | -9.4 | -11.5 | -28.3 | 21.0 |
Technicals & Short Data
| 3EMA Status | Volatility [%] | Value Traded Today | Average Daily Liquidity | Short [%] | Days To Cover |
|---|---|---|---|---|---|
| Negative | 9.7 | $28,889 | $66,165 | 0.07 | 1.0 |
Dividends
| Previous Dividend | Last Dividend | Franking [%] | Ex-Div Date | Gross Yield [%] |
|---|---|---|---|---|
| None | None | None | None | 0.0 |
Price Performance Snapshot
| Last Traded Price | Change [%] | 1 Week [%] | 1 Month [%] | 3 Months [%] | 6 Months [%] | 12 Months [%] |
|---|---|---|---|---|---|---|
| $0.210 | None | -2.3 | -4.5 | None | 55.6 | -48.8 |
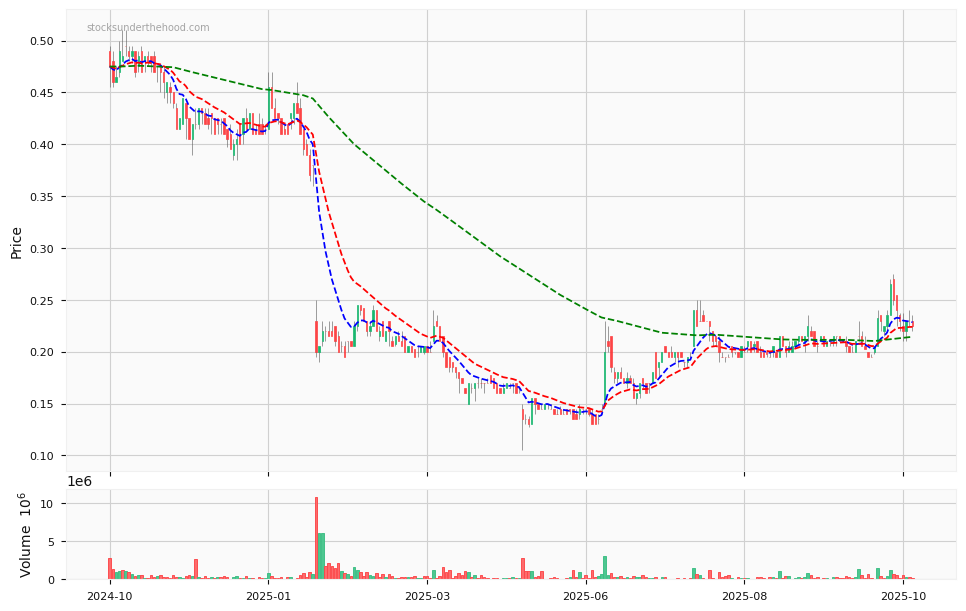
PLY Price Chart with Volume and 3EMA
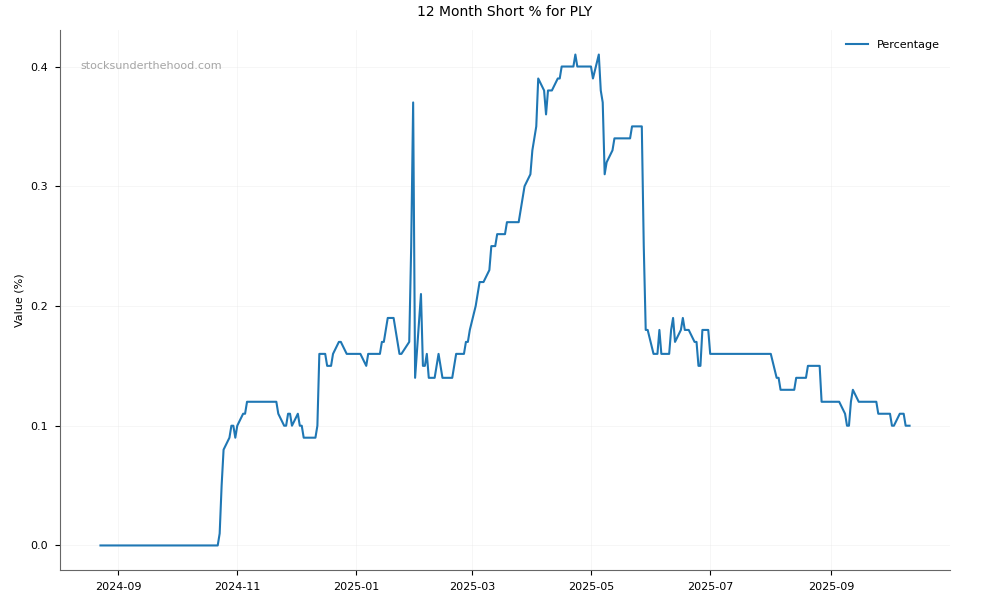
PLY Short Positions
Click HERE to understand why the above moving averages have been chosen.