Perpetual Limited is a diversified financial services company providing investment management, financial advice, trustee services, and philanthropic services to individuals, families, and institutions.
Ticker code: PPT
Sector: Financial Services | Industry: Asset Management | Website: https://www.perpetual.com.au
Market Information
| Market Capitalisation | Enterprise Value | Shares Outstanding | Free Float [%] | Free Float Value |
|---|---|---|---|---|
| $2,217,599,179 | $2,761,499,211 | 114782568 | 84.58 | $1,875,748,438 |
Balance Sheet & Quality
| Equity | Cash | Debt | Return On Equity (ROE) | EBITDA 25 Margin [%] | Net Debt / Equity [%] | Rule of 40 |
|---|---|---|---|---|---|---|
| $1,686,729,813 | $343,200,000 | $887,100,032 | 12.2 | 32.2 | 32.2 | 33.0 |
Technicals & Short Data
| 3EMA Status | Volatility [%] | Value Traded Today | Average Daily Liquidity | Short [%] | Days To Cover |
|---|---|---|---|---|---|
| Positive | 3.4 | $6,494,882 | $5,052,392 | 1.99 | 8.7 |
Dividends
| Previous Dividend | Last Dividend | Franking [%] | Ex-Div Date | Gross Yield [%] |
|---|---|---|---|---|
| $0.610 | $0.540 | 100.0 | 2025-09-11 | 4.0 |
Price Performance Snapshot
| Last Traded Price | Change [%] | 1 Week [%] | 1 Month [%] | 3 Months [%] | 6 Months [%] | 12 Months [%] |
|---|---|---|---|---|---|---|
| $19.320 | 0.1 | -9.2 | 3.9 | -3.0 | 25.4 | 1.0 |
PPT Price Chart with Volume and 3EMA
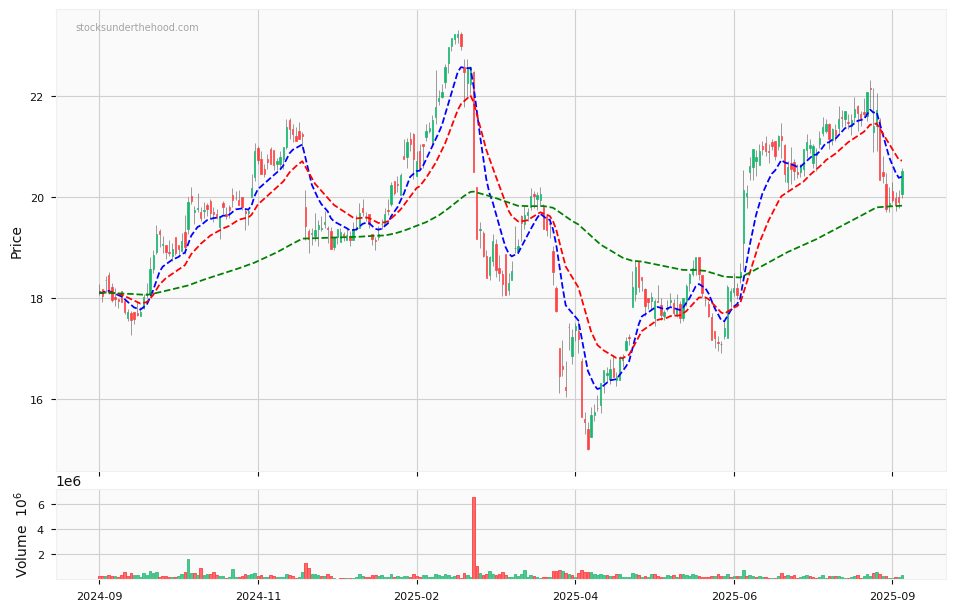
PPT Short Positions

Click HERE to understand why the above moving averages have been chosen.