PayPal is a digital payments platform that facilitates online transactions, peer-to-peer payments, and merchant services globally. It owns Venmo and offers solutions for businesses and individuals to securely send and receive money online.
Ticker code: PYPL
Sector: Financial Services | Industry: Credit Services | Website: https://www.paypal.com
Market Information
| Market Capitalisation | Enterprise Value | Shares Outstanding | Free Float [%] | Free Float Value |
|---|---|---|---|---|
| $57,720,367,696 | $59,132,367,440 | 935651953 | 99.67 | $57,529,890,510 |
Balance Sheet & Quality
| Equity | Cash | Debt | Return On Equity (ROE) | EBITDA 25 Margin [%] | Net Debt / Equity [%] | Rule of 40 |
|---|---|---|---|---|---|---|
| $20,082,833,050 | $10,755,000,320 | $12,167,000,064 | 24.3 | 20.8 | 7.0 | 36.7 |
Technicals & Short Data
| 3EMA Status | Volatility [%] | Value Traded Today | Average Daily Liquidity | Short [%] | Days To Cover |
|---|---|---|---|---|---|
| Negative | 6.1 | $827,284,411 | $1,024,901,659 | None | 0.0 |
Dividends
| Previous Dividend | Last Dividend | Franking [%] | Ex-Div Date | Gross Yield [%] |
|---|---|---|---|---|
| None | $0.140 | None | 2025-11-19 | 0.0 |
Price Performance Snapshot
| Last Traded Price | Change [%] | 1 Week [%] | 1 Month [%] | 3 Months [%] | 6 Months [%] | 12 Months [%] |
|---|---|---|---|---|---|---|
| $61.690 | 0.9 | -0.9 | -8.0 | -19.0 | 5.7 | -31.9 |
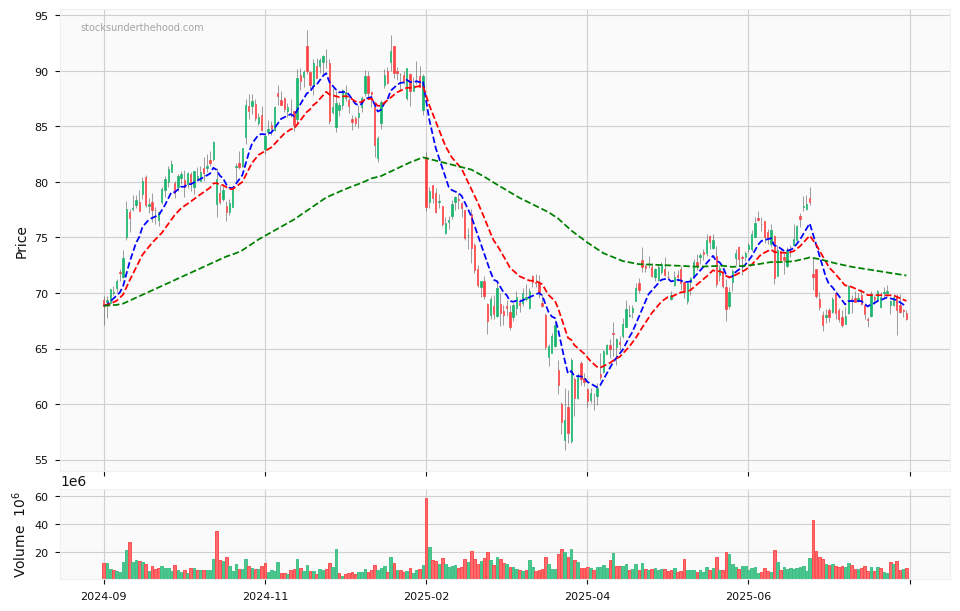
PYPL Price Chart with Volume and 3EMA
PYPL Short Positions
No chart available for this company.
Click HERE to understand why the above moving averages have been chosen.