REA Group Ltd is a multinational digital advertising company specializing in property, operating real estate websites and mobile applications in Australia and internationally, including realestate.com.au.
Ticker code: REA
Sector: Communication Services | Industry: Internet Content & Information | Website: https://www.rea-group.com
Market Information
| Market Capitalisation | Enterprise Value | Shares Outstanding | Free Float [%] | Free Float Value |
|---|---|---|---|---|
| $24,849,926,862 | $24,478,626,862 | 132117217 | 37.61 | $9,345,434,480 |
Balance Sheet & Quality
| Equity | Cash | Debt | Return On Equity (ROE) | EBITDA 25 Margin [%] | Net Debt / Equity [%] | Rule of 40 |
|---|---|---|---|---|---|---|
| $1,913,717,860 | $442,000,000 | $70,700,000 | 29.5 | 56.4 | -19.4 | 70.1 |
Technicals & Short Data
| 3EMA Status | Volatility [%] | Value Traded Today | Average Daily Liquidity | Short [%] | Days To Cover |
|---|---|---|---|---|---|
| Negative | 6.4 | $25,908,645 | $37,419,941 | 3.06 | 20.3 |
Dividends
| Previous Dividend | Last Dividend | Franking [%] | Ex-Div Date | Gross Yield [%] |
|---|---|---|---|---|
| $1.100 | $1.380 | 100.0 | 2025-08-28 | 1.0 |
Price Performance Snapshot
| Last Traded Price | Change [%] | 1 Week [%] | 1 Month [%] | 3 Months [%] | 6 Months [%] | 12 Months [%] |
|---|---|---|---|---|---|---|
| $188.090 | None | -1.1 | -7.9 | -22.2 | -18.7 | -21.4 |
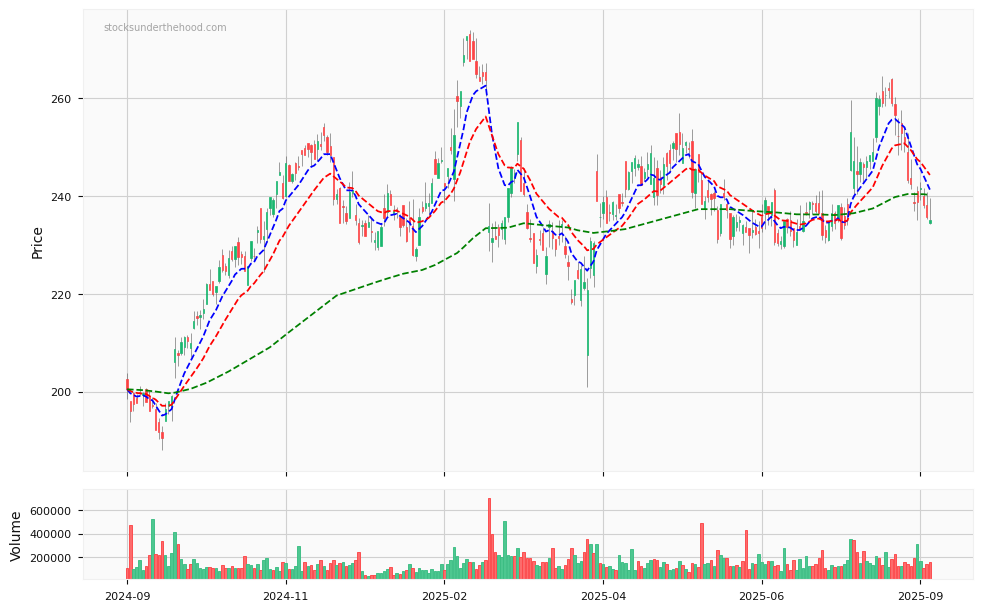
REA Price Chart with Volume and 3EMA
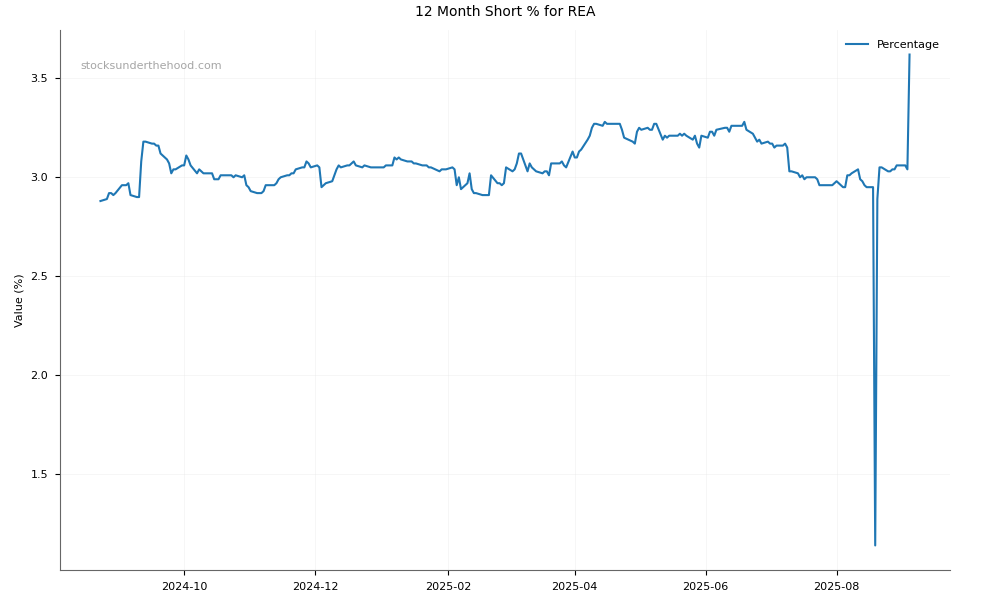
REA Short Positions
Click HERE to understand why the above moving averages have been chosen.