Raiz Invest Limited is a fintech company offering micro-investing services through its mobile platform, allowing users to invest small amounts into diversified portfolios.
Ticker code: RZI
Sector: Technology | Industry: Software – Infrastructure | Website: https://raizinvest.com.au
Market Information
| Market Capitalisation | Enterprise Value | Shares Outstanding | Free Float [%] | Free Float Value |
|---|---|---|---|---|
| $88,000,655 | $75,714,655 | 105390009 | 79.03 | $69,545,838 |
Balance Sheet & Quality
| Equity | Cash | Debt | Return On Equity (ROE) | EBITDA 25 Margin [%] | Net Debt / Equity [%] | Rule of 40 |
|---|---|---|---|---|---|---|
| $40,153,593 | $13,619,000 | $1,333,000 | 7.8 | 16.6 | -30.6 | 9.6 |
Technicals & Short Data
| 3EMA Status | Volatility [%] | Value Traded Today | Average Daily Liquidity | Short [%] | Days To Cover |
|---|---|---|---|---|---|
| Positive | 3.5 | $61,599 | $99,865 | None | 0.0 |
Dividends
| Previous Dividend | Last Dividend | Franking [%] | Ex-Div Date | Gross Yield [%] |
|---|---|---|---|---|
| None | None | None | None | 0.0 |
Price Performance Snapshot
| Last Traded Price | Change [%] | 1 Week [%] | 1 Month [%] | 3 Months [%] | 6 Months [%] | 12 Months [%] |
|---|---|---|---|---|---|---|
| $0.835 | 2.5 | 0.6 | 22.8 | 10.6 | 33.6 | 92.0 |
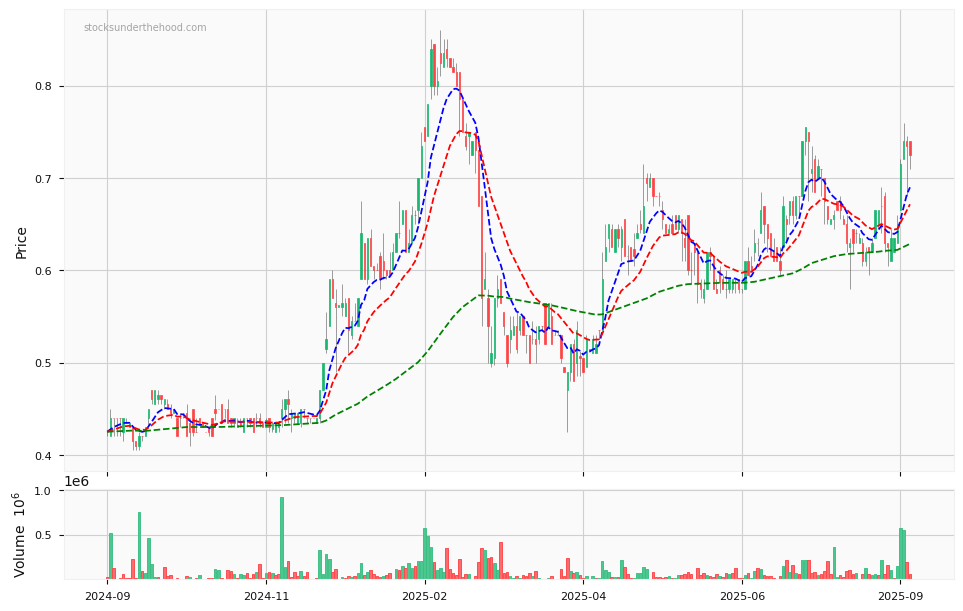
RZI Price Chart with Volume and 3EMA
RZI Short Positions
Click HERE to understand why the above moving averages have been chosen.