SkyCity Entertainment Group Limited operates casinos, hotels, and entertainment facilities in New Zealand and Australia, offering gaming, hospitality, and tourism services.
Ticker code: SKC
Sector: Consumer Cyclical | Industry: Resorts & Casinos | Website: https://skycityentertainmentgroup.com
Market Information
| Market Capitalisation | Enterprise Value | Shares Outstanding | Free Float [%] | Free Float Value |
|---|---|---|---|---|
| $810,745,475 | $1,568,253,451 | 1103055047 | 68.2 | $552,925,567 |
Balance Sheet & Quality
| Equity | Cash | Debt | Return On Equity (ROE) | EBITDA 25 Margin [%] | Net Debt / Equity [%] | Rule of 40 |
|---|---|---|---|---|---|---|
| $1,932,552,424 | $51,499,000 | $809,006,976 | 4.7 | None | 39.2 | None |
Technicals & Short Data
| 3EMA Status | Volatility [%] | Value Traded Today | Average Daily Liquidity | Short [%] | Days To Cover |
|---|---|---|---|---|---|
| Partial | 9.4 | $54,267 | $674,720 | 0.56 | 6.7 |
Dividends
| Previous Dividend | Last Dividend | Franking [%] | Ex-Div Date | Gross Yield [%] |
|---|---|---|---|---|
| None | None | None | 2024-03-06 | 0.0 |
Price Performance Snapshot
| Last Traded Price | Change [%] | 1 Week [%] | 1 Month [%] | 3 Months [%] | 6 Months [%] | 12 Months [%] |
|---|---|---|---|---|---|---|
| $0.735 | None | 1.4 | 14.0 | 17.6 | -14.5 | -41.9 |
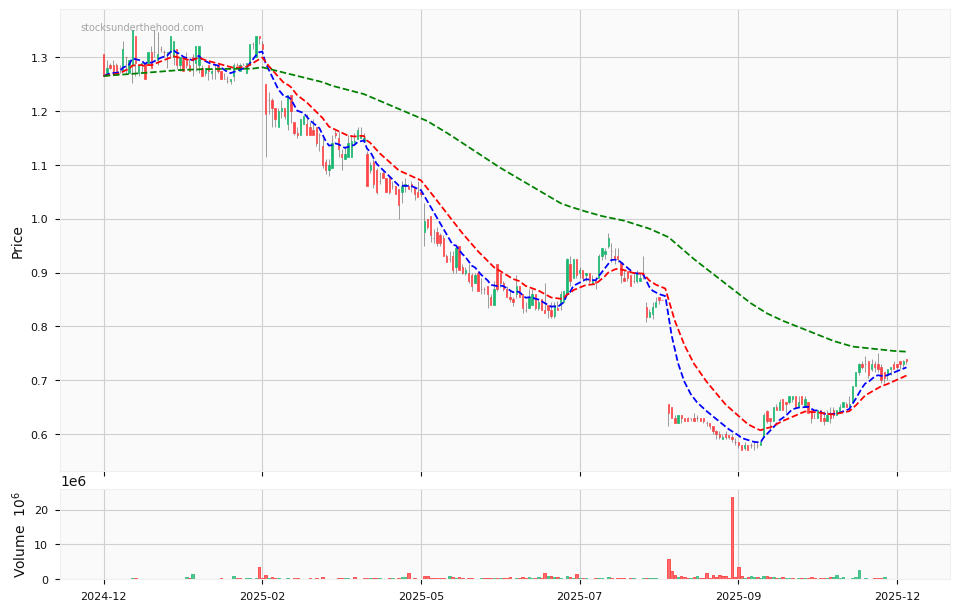
SKC Price Chart with Volume and 3EMA
SKC Short Positions

Click HERE to understand why the above moving averages have been chosen.