Talga Group Ltd is a battery anode and advanced materials company, engaged in the exploration, development, and commercialization of low-carbon battery and graphitic products, with operations in Australia and Europe.
Ticker code: TLG
Sector: Basic Materials | Industry: Other Industrial Metals & Mining | Website: https://www.talgagroup.com
Market Information
| Market Capitalisation | Enterprise Value | Shares Outstanding | Free Float [%] | Free Float Value |
|---|---|---|---|---|
| $223,572,869 | $211,472,853 | 456271152 | 89.68 | $200,508,941 |
Balance Sheet & Quality
| Equity | Cash | Debt | Return On Equity (ROE) | EBITDA 25 Margin [%] | Net Debt / Equity [%] | Rule of 40 |
|---|---|---|---|---|---|---|
| $44,714,574 | $13,184,029 | $1,084,013 | -61.2 | None | -27.1 | None |
Technicals & Short Data
| 3EMA Status | Volatility [%] | Value Traded Today | Average Daily Liquidity | Short [%] | Days To Cover |
|---|---|---|---|---|---|
| Positive | 7.4 | $208,647 | $455,803 | 0.08 | 0.4 |
Dividends
| Previous Dividend | Last Dividend | Franking [%] | Ex-Div Date | Gross Yield [%] |
|---|---|---|---|---|
| None | None | None | None | 0.0 |
Price Performance Snapshot
| Last Traded Price | Change [%] | 1 Week [%] | 1 Month [%] | 3 Months [%] | 6 Months [%] | 12 Months [%] |
|---|---|---|---|---|---|---|
| $0.490 | None | -3.9 | 12.6 | 4.3 | 10.1 | 21.0 |
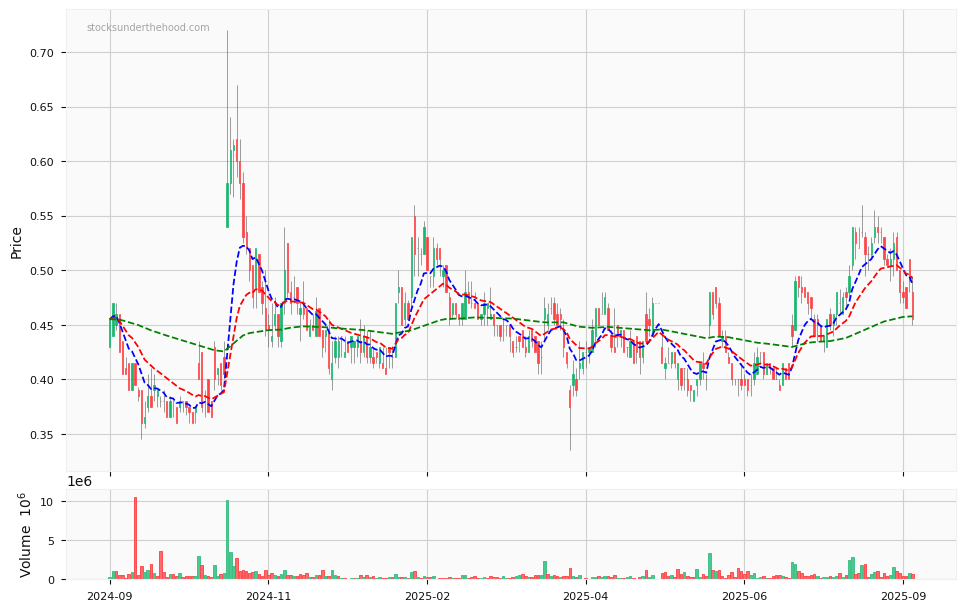
TLG Price Chart with Volume and 3EMA
TLG Short Positions

Click HERE to understand why the above moving averages have been chosen.