Telix Pharmaceuticals Limited is a biopharmaceutical company specializing in the development and commercialization of diagnostic and therapeutic radiopharmaceuticals for oncology and rare diseases.
Ticker code: TLX
Sector: Healthcare | Industry: Biotechnology | Website: https://telixpharma.com
Market Information
| Market Capitalisation | Enterprise Value | Shares Outstanding | Free Float [%] | Free Float Value |
|---|---|---|---|---|
| $4,599,114,347 | $4,810,211,339 | 334724485 | 82.27 | $3,783,753,921 |
Balance Sheet & Quality
| Equity | Cash | Debt | Return On Equity (ROE) | EBITDA 25 Margin [%] | Net Debt / Equity [%] | Rule of 40 |
|---|---|---|---|---|---|---|
| $625,461,065 | $207,156,000 | $418,252,992 | 1.1 | 6.2 | 33.8 | 72.0 |
Technicals & Short Data
| 3EMA Status | Volatility [%] | Value Traded Today | Average Daily Liquidity | Short [%] | Days To Cover |
|---|---|---|---|---|---|
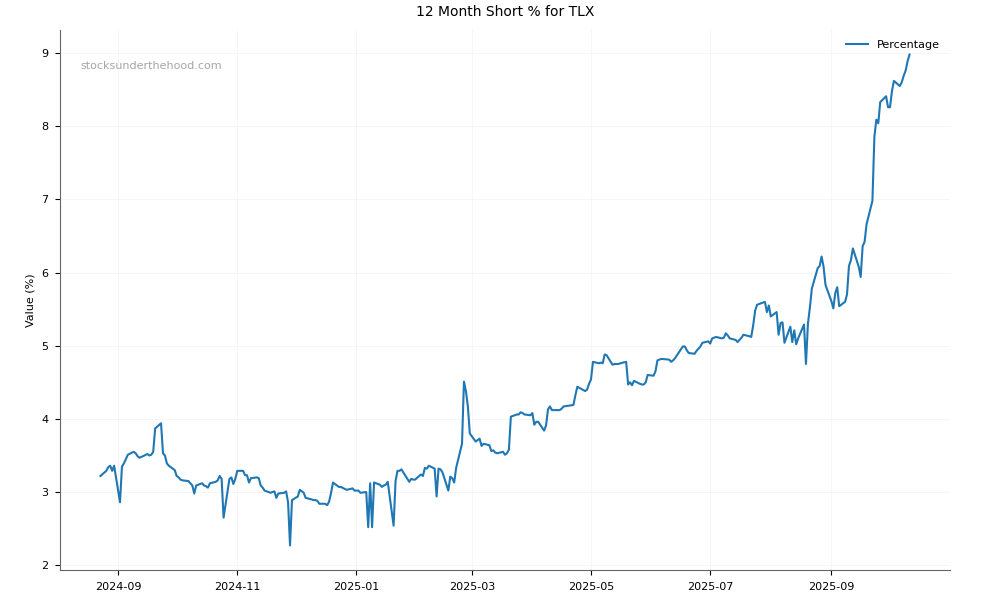
| Negative | 5.3 | $21,141,916 | $26,221,924 | 10.85 | 19.0 |
Dividends
| Previous Dividend | Last Dividend | Franking [%] | Ex-Div Date | Gross Yield [%] |
|---|---|---|---|---|
| None | None | None | None | 0.0 |
Price Performance Snapshot
| Last Traded Price | Change [%] | 1 Week [%] | 1 Month [%] | 3 Months [%] | 6 Months [%] | 12 Months [%] |
|---|---|---|---|---|---|---|
| $13.740 | 0.3 | -7.2 | -8.0 | -0.4 | -46.2 | -43.8 |
TLX Price Chart with Volume and 3EMA

TLX Short Positions
Click HERE to understand why the above moving averages have been chosen.