Viva Energy Group Limited is an energy company engaged in the refining, distribution, and marketing of petroleum products, supplying fuel and lubricants across Australia.
Ticker code: ASX:VEA
Sector: Energy | Industry: Oil & Gas Refining & Marketing | Website: https://www.vivaenergy.com.au
Market Information
| Market Capitalisation | Enterprise Value | Shares Outstanding | Free Float [%] | Free Float Value |
|---|---|---|---|---|
| $3,173,003,328 | $8,795,666,432 | 1614759936.0 | 66.84 | $2,120,858,088 |
Balance Sheet & Quality
| Equity | Cash | Debt | Return On Equity (ROE) | EBITDA 24 Margin [%] | Net Debt / Equity [%] | Rule of 40 |
|---|---|---|---|---|---|---|
| $1,672,891,363 | $236,300,000 | $5,791,499,776 | 12.8 | 2.5 | 332.1 | 1.9 |
Technicals & Short Data
| 3EMA Status | Volatility [%] | Value Traded Today | Average Daily Liquidity | Short [%] | Days To Cover |
|---|---|---|---|---|---|
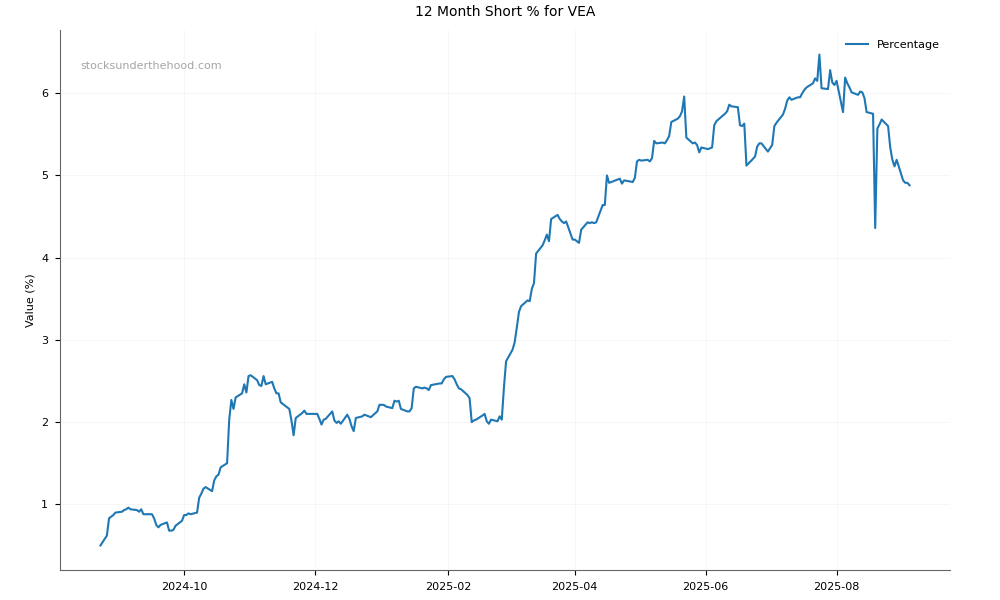
| Negative | 3.3 | $6,844,985 | $9,976,989 | 4.91 | 15.6 |
Dividends
| Previous Dividend | Last Dividend | Franking [%] | Ex-Div Date | Gross Yield [%] |
|---|---|---|---|---|
| $0.039 | $0.028 | 100.0 | 2025-09-05 | 4.9 |
Price Performance Snapshot
| Last Traded Price | Change [%] | 1 Week [%] | 1 Month [%] | 3 Months [%] | 6 Months [%] | 12 Months [%] |
|---|---|---|---|---|---|---|
| $1.965 | -2.2 | -5.2 | -2.8 | 0.6 | 15.5 | -28.0 |
ASX:VEA Price Chart with Volume and 3EMA

ASX:VEA Short Positions
Click HERE to understand why the above moving averages have been chosen.