X2M Connect Limited is a technology company delivering smart metering and IoT solutions to utilities and governments in the Asia-Pacific region, enhancing the efficiency of water and energy management.
Ticker code: X2M
Sector: Technology | Industry: Scientific & Technical Instruments | Website: https://x2mconnect.com
Market Information
| Market Capitalisation | Enterprise Value | Shares Outstanding | Free Float [%] | Free Float Value |
|---|---|---|---|---|
| $13,170,792 | $18,917,644 | 1013137793.0 | 24.27 | $3,196,397 |
Balance Sheet & Quality
| Equity | Cash | Debt | Return On Equity (ROE) | EBITDA 25 Margin [%] | Net Debt / Equity [%] | Rule of 40 |
|---|---|---|---|---|---|---|
| -$20,262,755 | $1,691,365 | $7,438,217 | 0.0 | None | -28.4 | None |
Technicals & Short Data
| 3EMA Status | Volatility [%] | Value Traded Today | Average Daily Liquidity | Short [%] | Days To Cover |
|---|---|---|---|---|---|
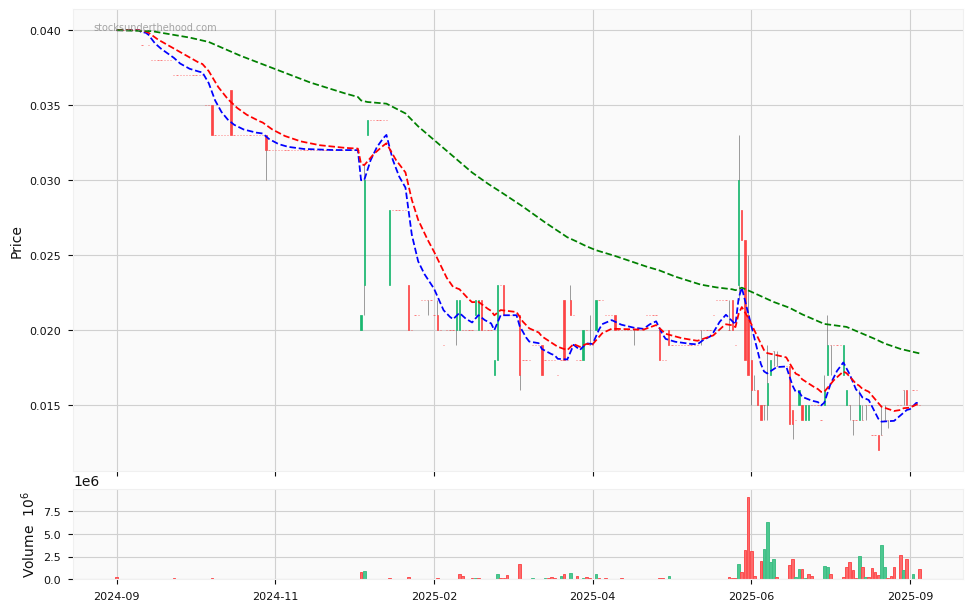
| Negative | 73.1 | $2,325 | $10,491 | 0.0 | 0.0 |
Dividends
| Previous Dividend | Last Dividend | Franking [%] | Ex-Div Date | Gross Yield [%] |
|---|---|---|---|---|
| None | None | None | None | 0.0 |
Price Performance Snapshot
| Last Traded Price | Change [%] | 1 Week [%] | 1 Month [%] | 3 Months [%] | 6 Months [%] | 12 Months [%] |
|---|---|---|---|---|---|---|
| $0.013 | None | None | -13.3 | -13.3 | -35.0 | -60.6 |
X2M Price Chart with Volume and 3EMA
X2M Short Positions
Click HERE to understand why the above moving averages have been chosen.