Australian Finance Group Ltd is one of Australia’s largest mortgage broking groups, providing a range of financial products and services, including home loans, commercial loans, and insurance. The company operates a network of brokers and offers its own suite of mortgage products under the AFG Home Loans brand.
Ticker code: AFG
Sector: Financial Services | Industry: Mortgage Finance | Website: https://www.afgonline.com.au
Market Information
| Market Capitalisation | Enterprise Value | Shares Outstanding | Free Float [%] | Free Float Value |
|---|---|---|---|---|
| $611,460,142 | $6,164,859,918 | 271760063 | 74.3 | $454,303,073 |
Balance Sheet & Quality
| Equity | Cash | Debt | Return On Equity (ROE) | EBITDA 25 Margin [%] | Net Debt / Equity [%] | Rule of 40 |
|---|---|---|---|---|---|---|
| $222,843,255 | $63,700,000 | $5,617,099,776 | 15.7 | 4.3 | 2492.1 | 21.5 |
Technicals & Short Data
| 3EMA Status | Volatility [%] | Value Traded Today | Average Daily Liquidity | Short [%] | Days To Cover |
|---|---|---|---|---|---|
| Negative | 4.4 | $839,421 | $1,504,744 | 0.02 | 0.1 |
Dividends
| Previous Dividend | Last Dividend | Franking [%] | Ex-Div Date | Gross Yield [%] |
|---|---|---|---|---|
| $0.038 | $0.053 | 100.0 | 2025-09-08 | 3.4 |
Price Performance Snapshot
| Last Traded Price | Change [%] | 1 Week [%] | 1 Month [%] | 3 Months [%] | 6 Months [%] | 12 Months [%] |
|---|---|---|---|---|---|---|
| $2.250 | 0.9 | None | -6.6 | -13.0 | 4.4 | 51.7 |
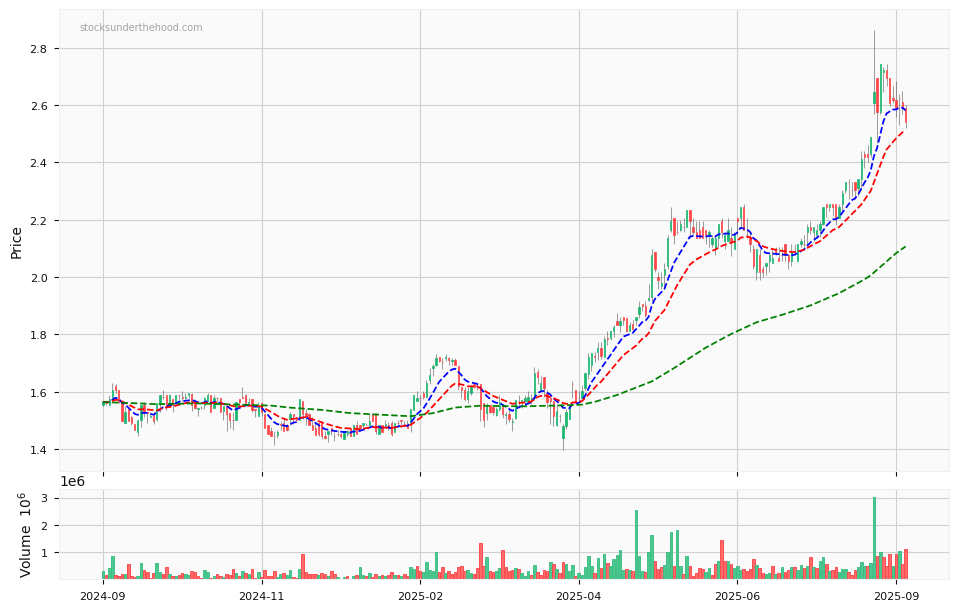
AFG Price Chart with Volume and 3EMA
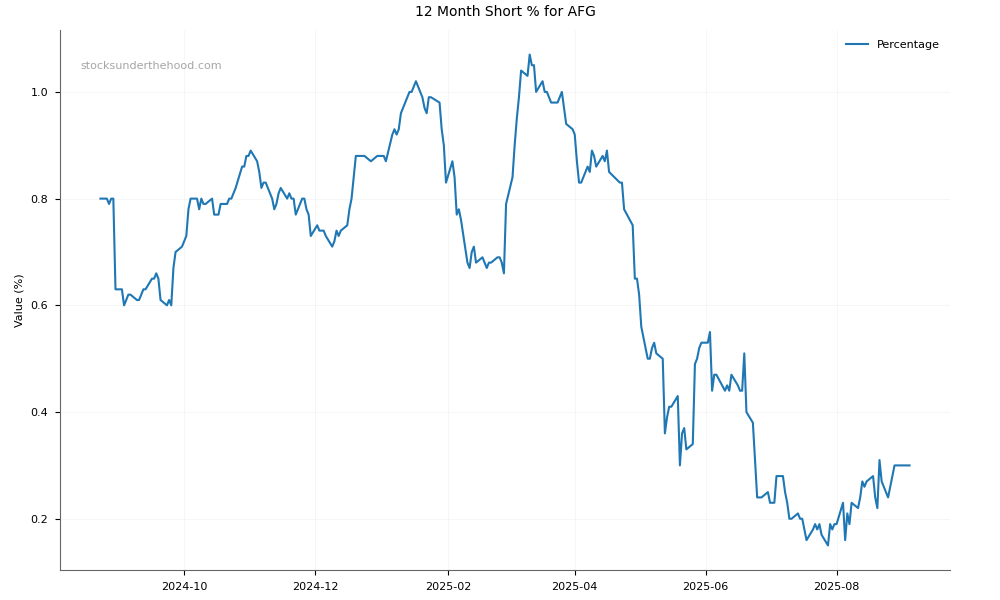
AFG Short Positions
Click HERE to understand why the above moving averages have been chosen.