Bendigo and Adelaide Bank Limited is a leading Australian regional bank, providing a range of banking and financial services to retail customers and communities.
Ticker code: BEN
Sector: Financial Services | Industry: Banks – Regional | Website: https://www.bendigoadelaide.com.au
Market Information
| Market Capitalisation | Enterprise Value | Shares Outstanding | Free Float [%] | Free Float Value |
|---|---|---|---|---|
| $5,852,938,030 | $12,901,538,094 | 563866856 | 99.45 | $5,820,454,224 |
Balance Sheet & Quality
| Equity | Cash | Debt | Return On Equity (ROE) | EBITDA 25 Margin [%] | Net Debt / Equity [%] | Rule of 40 |
|---|---|---|---|---|---|---|
| $6,670,544,996 | $4,620,899,840 | $11,669,499,904 | 7.2 | 38.1 | 105.7 | 41.8 |
Technicals & Short Data
| 3EMA Status | Volatility [%] | Value Traded Today | Average Daily Liquidity | Short [%] | Days To Cover |
|---|---|---|---|---|---|
| Negative | 12.7 | $25,326,785 | $13,921,075 | 2.05 | 8.6 |
Dividends
| Previous Dividend | Last Dividend | Franking [%] | Ex-Div Date | Gross Yield [%] |
|---|---|---|---|---|
| $0.300 | $0.330 | 100.0 | 2025-09-02 | 4.5 |
Price Performance Snapshot
| Last Traded Price | Change [%] | 1 Week [%] | 1 Month [%] | 3 Months [%] | 6 Months [%] | 12 Months [%] |
|---|---|---|---|---|---|---|
| $10.380 | 2.5 | 1.4 | -19.0 | -19.5 | -13.6 | -19.3 |
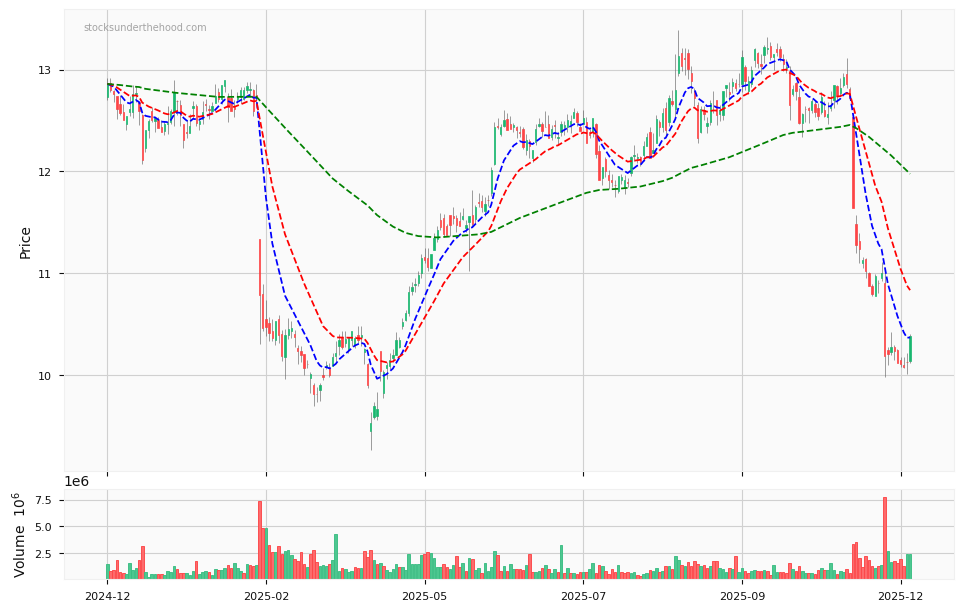
BEN Price Chart with Volume and 3EMA
BEN Short Positions

Click HERE to understand why the above moving averages have been chosen.