Charter Hall Retail REIT invests in and manages a portfolio of shopping centers across Australia, focusing on convenience-based retail properties.
Ticker code: CQR
Sector: Real Estate | Industry: REIT – Retail | Website: https://www.charterhall.com.au
Market Information
| Market Capitalisation | Enterprise Value | Shares Outstanding | Free Float [%] | Free Float Value |
|---|---|---|---|---|
| $2,452,788,828 | $3,848,688,892 | 581229609 | 76.62 | $1,879,424,913 |
Balance Sheet & Quality
| Equity | Cash | Debt | Return On Equity (ROE) | EBITDA 25 Margin [%] | Net Debt / Equity [%] | Rule of 40 |
|---|---|---|---|---|---|---|
| $2,693,999,435 | $56,700,000 | $1,452,600,064 | 5.4 | 88.3 | 51.8 | 84.1 |
Technicals & Short Data
| 3EMA Status | Volatility [%] | Value Traded Today | Average Daily Liquidity | Short [%] | Days To Cover |
|---|---|---|---|---|---|
| Positive | 1.6 | $4,704,848 | $4,871,049 | 0.45 | 2.3 |
Dividends
| Previous Dividend | Last Dividend | Franking [%] | Ex-Div Date | Gross Yield [%] |
|---|---|---|---|---|
| $0.124 | $0.064 | None | 2025-09-29 | 4.4 |
Price Performance Snapshot
| Last Traded Price | Change [%] | 1 Week [%] | 1 Month [%] | 3 Months [%] | 6 Months [%] | 12 Months [%] |
|---|---|---|---|---|---|---|
| $4.220 | 0.2 | None | 1.8 | 13.3 | 18.6 | 35.2 |
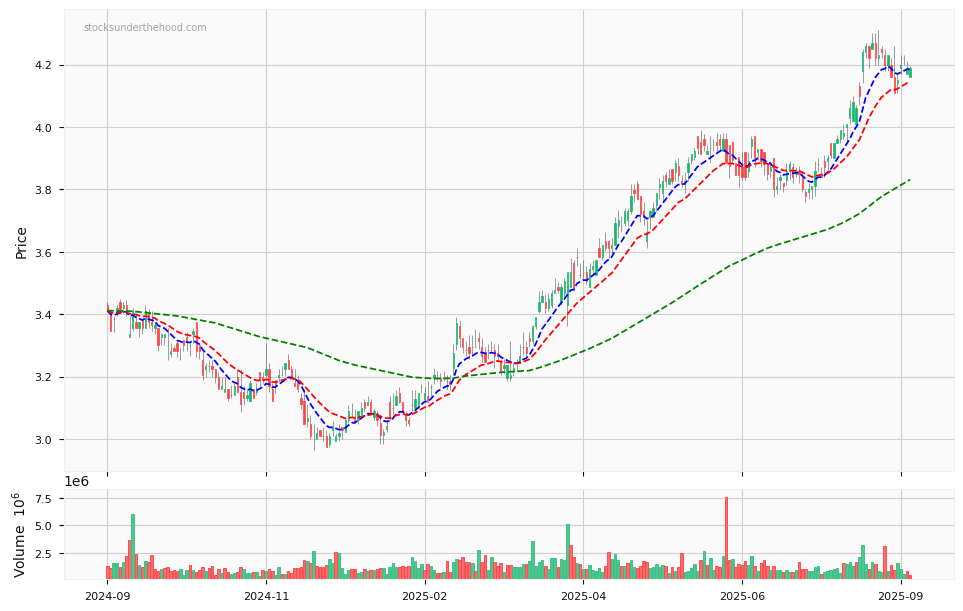
CQR Price Chart with Volume and 3EMA
CQR Short Positions

Click HERE to understand why the above moving averages have been chosen.