Euroz Hartleys Group Limited provides stockbroking, corporate finance, and funds management services, catering to institutional and retail clients in Australia.
Ticker code: EZL
Sector: Financial Services | Industry: Asset Management | Website: https://eurozhartleys.com
Market Information
| Market Capitalisation | Enterprise Value | Shares Outstanding | Free Float [%] | Free Float Value |
|---|---|---|---|---|
| $163,119,429 | $46,702,429 | 153886262 | 61.55 | $100,406,534 |
Balance Sheet & Quality
| Equity | Cash | Debt | Return On Equity (ROE) | EBITDA 25 Margin [%] | Net Debt / Equity [%] | Rule of 40 |
|---|---|---|---|---|---|---|
| $114,183,611 | $129,443,000 | $13,026,000 | 0.0 | None | -102.0 | None |
Technicals & Short Data
| 3EMA Status | Volatility [%] | Value Traded Today | Average Daily Liquidity | Short [%] | Days To Cover |
|---|---|---|---|---|---|
| Positive | 3.5 | $71,828 | $61,674 | 0.0 | 0.0 |
Dividends
| Previous Dividend | Last Dividend | Franking [%] | Ex-Div Date | Gross Yield [%] |
|---|---|---|---|---|
| $0.140 | $0.035 | 100.0 | 2025-09-15 | 23.6 |
Price Performance Snapshot
| Last Traded Price | Change [%] | 1 Week [%] | 1 Month [%] | 3 Months [%] | 6 Months [%] | 12 Months [%] |
|---|---|---|---|---|---|---|
| $1.060 | 0.5 | None | 5.5 | 7.7 | 45.9 | 50.6 |
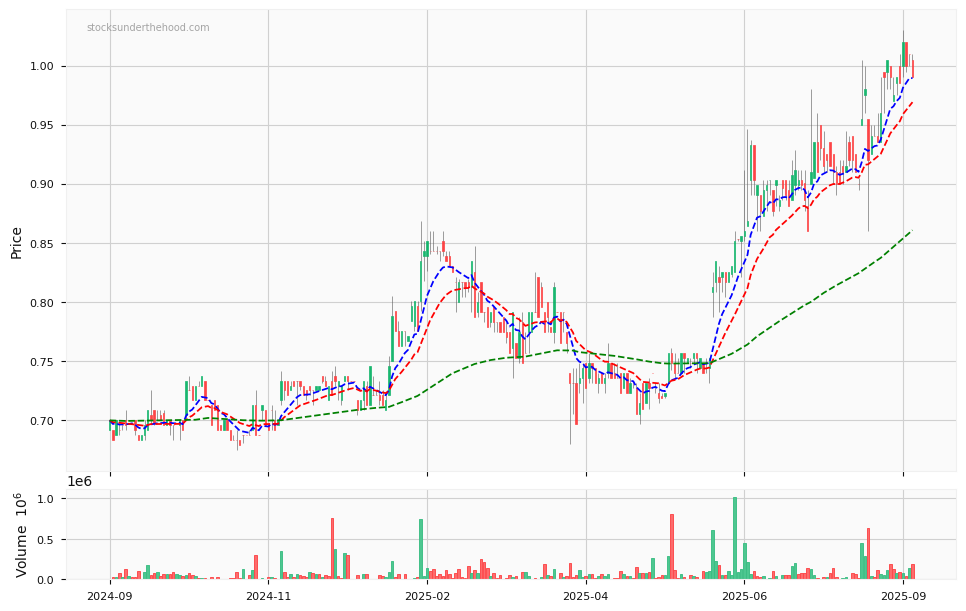
EZL Price Chart with Volume and 3EMA
EZL Short Positions
Click HERE to understand why the above moving averages have been chosen.