Region Group includes two internally managed real estate investment trusts owning a portfolio of convenience-based retail properties located across Australia.
Ticker code: RGN
Sector: Real Estate | Industry: REIT – Retail | Website: https://regiongroup.au/
Market Information
| Market Capitalisation | Enterprise Value | Shares Outstanding | Free Float [%] | Free Float Value |
|---|---|---|---|---|
| $2,798,568,704 | $4,347,046,400 | 1161231738 | 97.16 | $2,719,027,817 |
Balance Sheet & Quality
| Equity | Cash | Debt | Return On Equity (ROE) | EBITDA 25 Margin [%] | Net Debt / Equity [%] | Rule of 40 |
|---|---|---|---|---|---|---|
| $2,865,919,825 | $9,200,000 | $1,593,799,936 | None | None | 55.3 | None |
Technicals & Short Data
| 3EMA Status | Volatility [%] | Value Traded Today | Average Daily Liquidity | Short [%] | Days To Cover |
|---|---|---|---|---|---|
| Partial | 1.8 | $8,131,420 | $6,143,406 | None | 0.0 |
Dividends
| Previous Dividend | Last Dividend | Franking [%] | Ex-Div Date | Gross Yield [%] |
|---|---|---|---|---|
| $0.067 | $0.070 | None | 2025-06-27 | None |
Price Performance Snapshot
| Last Traded Price | Change [%] | 1 Week [%] | 1 Month [%] | 3 Months [%] | 6 Months [%] | 12 Months [%] |
|---|---|---|---|---|---|---|
| $2.410 | 0.8 | None | -1.2 | -0.4 | 4.0 | 21.6 |
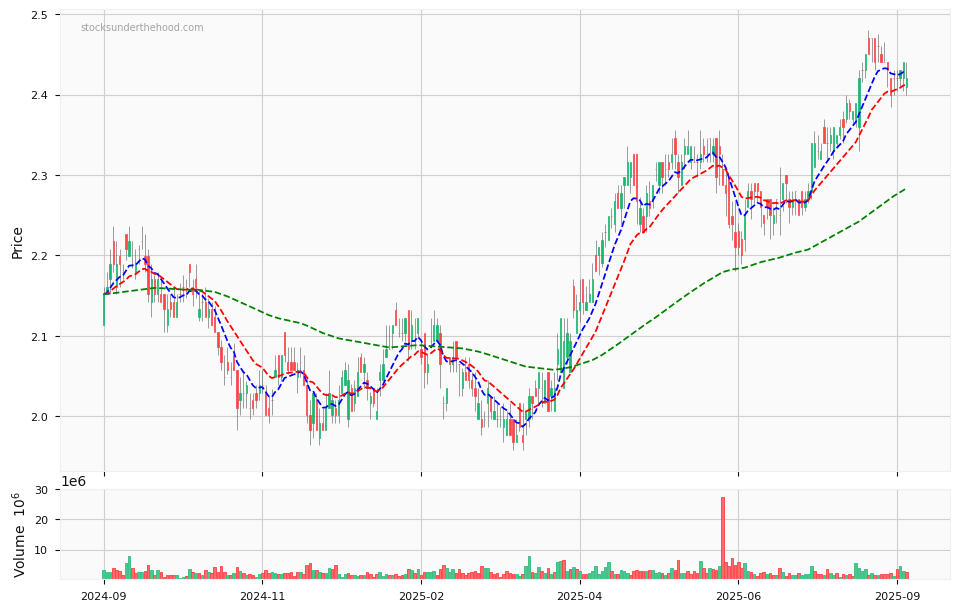
RGN Price Chart with Volume and 3EMA
RGN Short Positions

Click HERE to understand why the above moving averages have been chosen.