Scentre Group owns and operates a leading portfolio of Westfield shopping centers in Australia and New Zealand, providing retail, dining, and entertainment experiences.
Ticker code: SCG
Sector: Real Estate | Industry: REIT – Retail | Website: https://www.scentregroup.com
Market Information
| Market Capitalisation | Enterprise Value | Shares Outstanding | Free Float [%] | Free Float Value |
|---|---|---|---|---|
| $21,961,117,504 | $38,002,217,280 | 5216417412 | 99.49 | $21,848,710,128 |
Balance Sheet & Quality
| Equity | Cash | Debt | Return On Equity (ROE) | EBITDA 25 Margin [%] | Net Debt / Equity [%] | Rule of 40 |
|---|---|---|---|---|---|---|
| $18,455,685,250 | $318,400,000 | $16,359,499,776 | 6.2 | None | 86.9 | None |
Technicals & Short Data
| 3EMA Status | Volatility [%] | Value Traded Today | Average Daily Liquidity | Short [%] | Days To Cover |
|---|---|---|---|---|---|
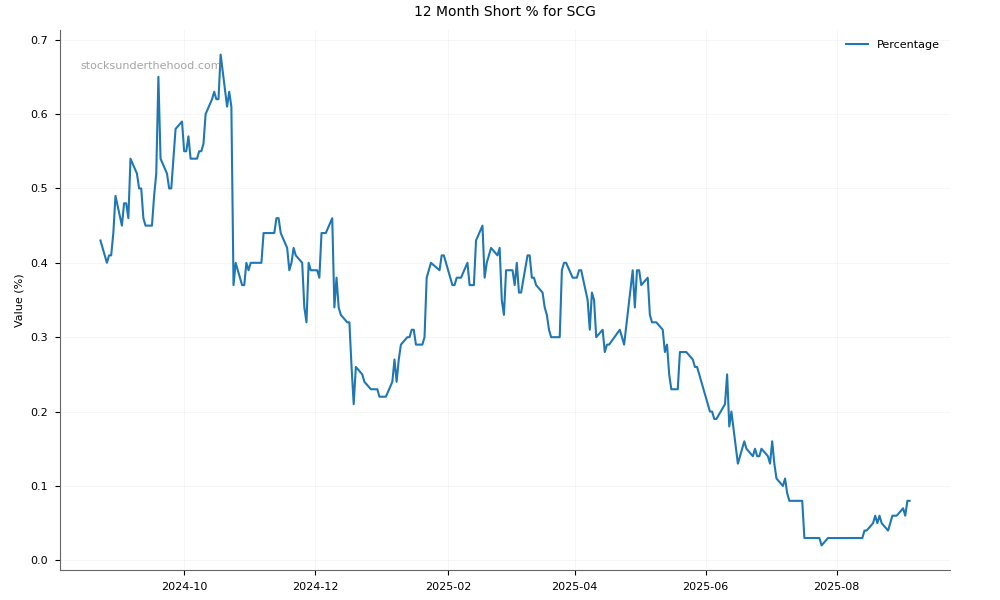
| Positive | 1.4 | $23,091,829 | $36,444,004 | 0.12 | 0.7 |
Dividends
| Previous Dividend | Last Dividend | Franking [%] | Ex-Div Date | Gross Yield [%] |
|---|---|---|---|---|
| $0.086 | $0.088 | None | 2025-08-14 | 2.1 |
Price Performance Snapshot
| Last Traded Price | Change [%] | 1 Week [%] | 1 Month [%] | 3 Months [%] | 6 Months [%] | 12 Months [%] |
|---|---|---|---|---|---|---|
| $4.210 | 0.2 | 1.0 | 2.9 | 16.5 | 22.1 | 26.0 |
SCG Price Chart with Volume and 3EMA

SCG Short Positions
Click HERE to understand why the above moving averages have been chosen.