Westpac Banking Corporation is one of Australia’s leading banks, providing a broad range of banking and financial services, including retail, business, and institutional banking, wealth management, and insurance.
Ticker code: WBC
Sector: Financial Services | Industry: Banks – Diversified | Website: https://www.westpac.com.au
Market Information
| Market Capitalisation | Enterprise Value | Shares Outstanding | Free Float [%] | Free Float Value |
|---|---|---|---|---|
| $132,485,080,323 | $267,298,080,003 | 3414563993.0 | 99.89 | $132,339,346,750 |
Balance Sheet & Quality
| Equity | Cash | Debt | Return On Equity (ROE) | EBITDA 25 Margin [%] | Net Debt / Equity [%] | Rule of 40 |
|---|---|---|---|---|---|---|
| $72,764,358,697 | $111,855,001,600 | $246,668,001,280 | 9.4 | None | 185.3 | None |
Technicals & Short Data
| 3EMA Status | Volatility [%] | Value Traded Today | Average Daily Liquidity | Short [%] | Days To Cover |
|---|---|---|---|---|---|
| Positive | 4.2 | $140,138,691 | $178,651,958 | 0.67 | 5.0 |
Dividends
| Previous Dividend | Last Dividend | Franking [%] | Ex-Div Date | Gross Yield [%] |
|---|---|---|---|---|
| $0.760 | $0.770 | 100.0 | 2025-11-06 | 2.8 |
Price Performance Snapshot
| Last Traded Price | Change [%] | 1 Week [%] | 1 Month [%] | 3 Months [%] | 6 Months [%] | 12 Months [%] |
|---|---|---|---|---|---|---|
| $38.800 | 1.4 | 1.9 | -2.7 | 3.6 | 19.2 | 25.7 |
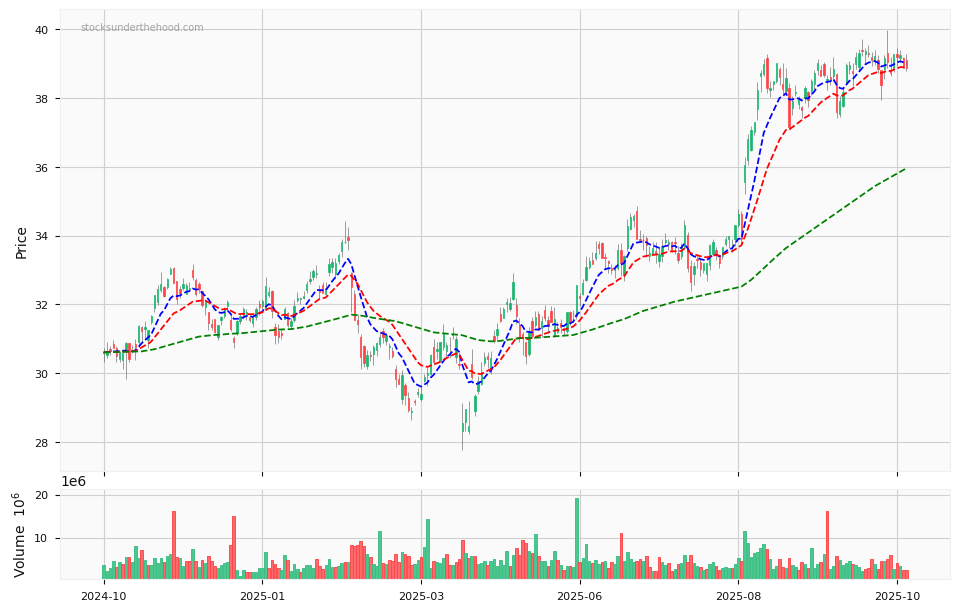
WBC Price Chart with Volume and 3EMA
WBC Short Positions

Click HERE to understand why the above moving averages have been chosen.