Amplitude Energy Ltd (ASX:AEL) produces natural gas for southeast Australia and low-cost oil in the Cooper Basin. Its assets include the Sole gas field, Casino Henry operations, and reserves in the Otway and Gippsland basins.
Ticker code: AEL
Sector: Energy | Industry: Oil & Gas E&P | Website: https://www.amplitudeenergy.com.au
Market Information
| Market Capitalisation | Enterprise Value | Shares Outstanding | Free Float [%] | Free Float Value |
|---|---|---|---|---|
| $770,163,052 | $1,008,095,052 | 3277289593 | 78.52 | $604,705,995 |
Balance Sheet & Quality
| Equity | Cash | Debt | Return On Equity (ROE) | EBITDA 25 Margin [%] | Net Debt / Equity [%] | Rule of 40 |
|---|---|---|---|---|---|---|
| $465,375,143 | $62,188,000 | $300,120,000 | 11.3 | 64.6 | 51.1 | 78.7 |
Technicals & Short Data
| 3EMA Status | Volatility [%] | Value Traded Today | Average Daily Liquidity | Short [%] | Days To Cover |
|---|---|---|---|---|---|
| Partial | 4.9 | $1,022,885 | $1,543,729 | 1.21 | 6.0 |
Dividends
| Previous Dividend | Last Dividend | Franking [%] | Ex-Div Date | Gross Yield [%] |
|---|---|---|---|---|
| None | None | None | None | 0.0 |
Price Performance Snapshot
| Last Traded Price | Change [%] | 1 Week [%] | 1 Month [%] | 3 Months [%] | 6 Months [%] | 12 Months [%] |
|---|---|---|---|---|---|---|
| $0.235 | None | 4.4 | None | -4.1 | 27.0 | 17.5 |
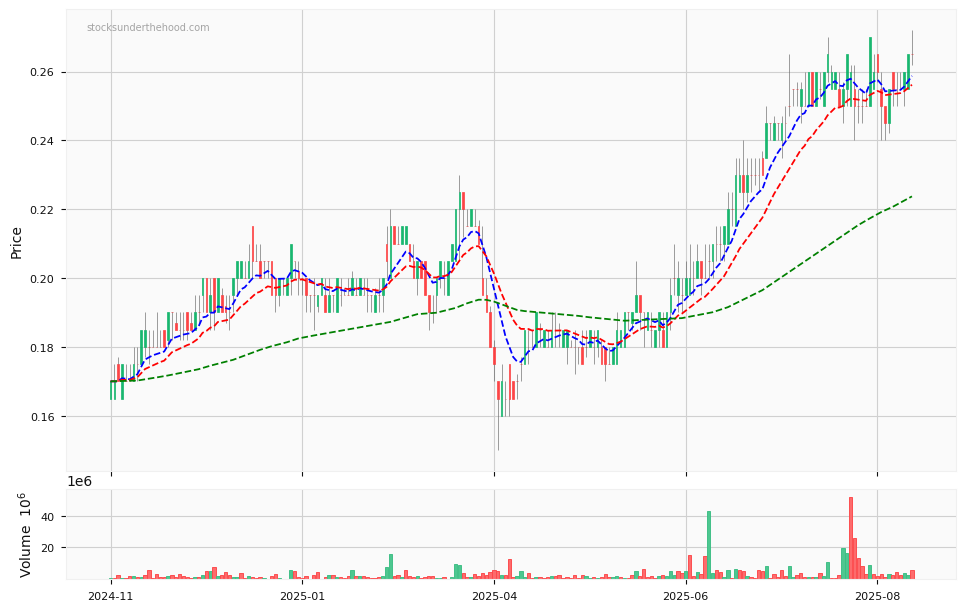
AEL Price Chart with Volume and 3EMA
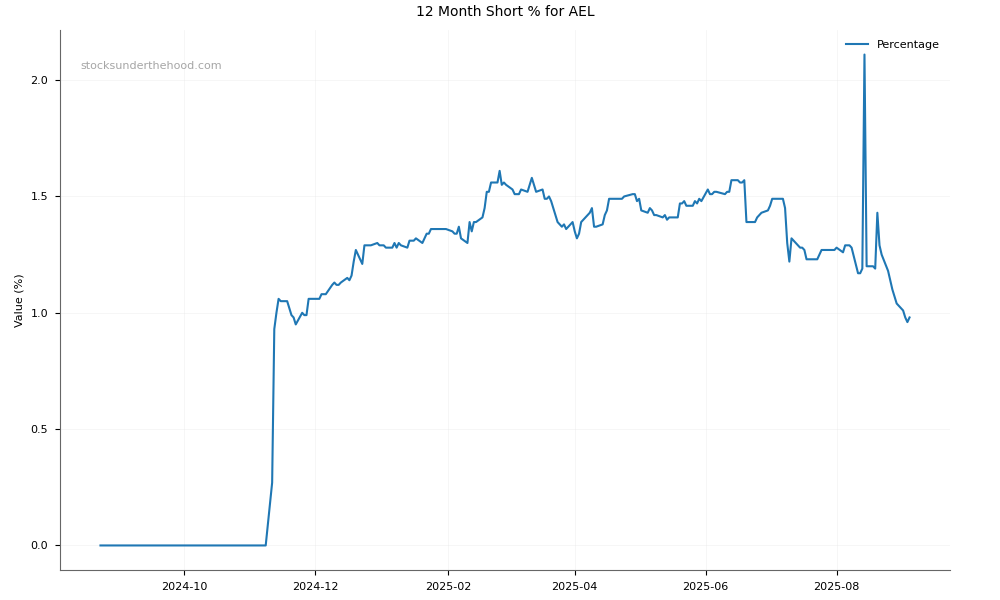
AEL Short Positions
Click HERE to understand why the above moving averages have been chosen.