ACF Technical Analysis
View This Company’s Fact Sheet: Open | Last updated: December 09, 2025 at 12:06 AM
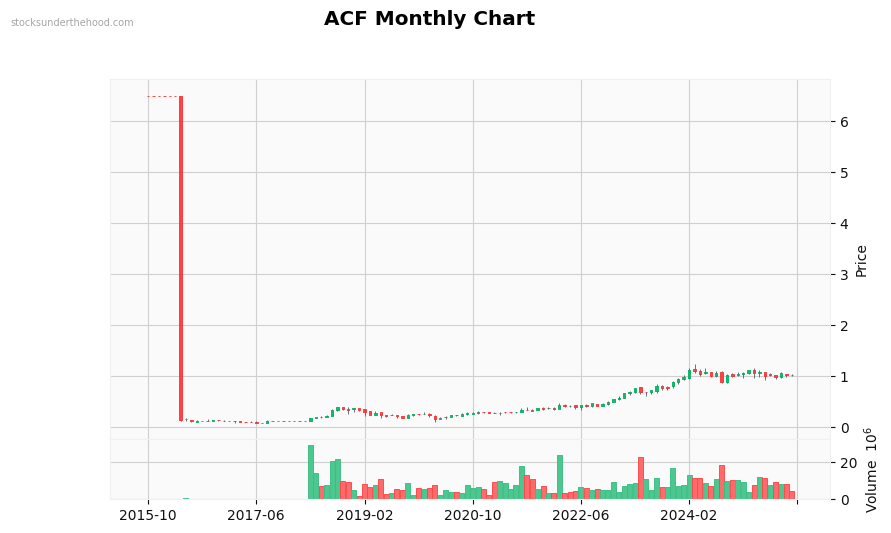
Monthly Observations: Performance: -83.6% (10Y). Volume is significantly above average. suggesting potential breakout preparation. Currently in a downtrend. Sideways long-term movement (+11.9% over 2 years). High volatility stock. Up 1132% from lows. Price is near recent highs.
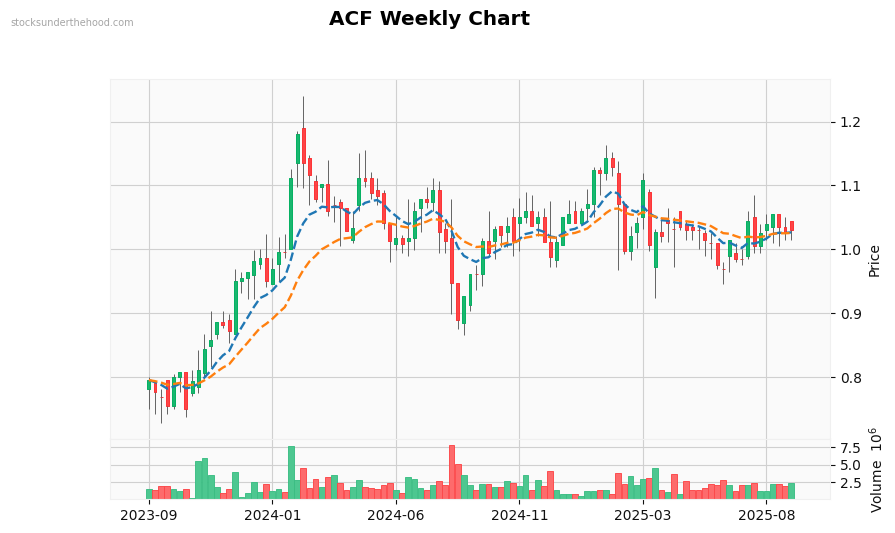
Weekly Observations: Performance: +21.2% (2Y). Volume is below average. Currently in a strong downtrend. Trading below EMA10. Trading below EMA21. Price is below most EMAs (negative). EMAs are stacked bullishly. Price is in the middle of recent range.
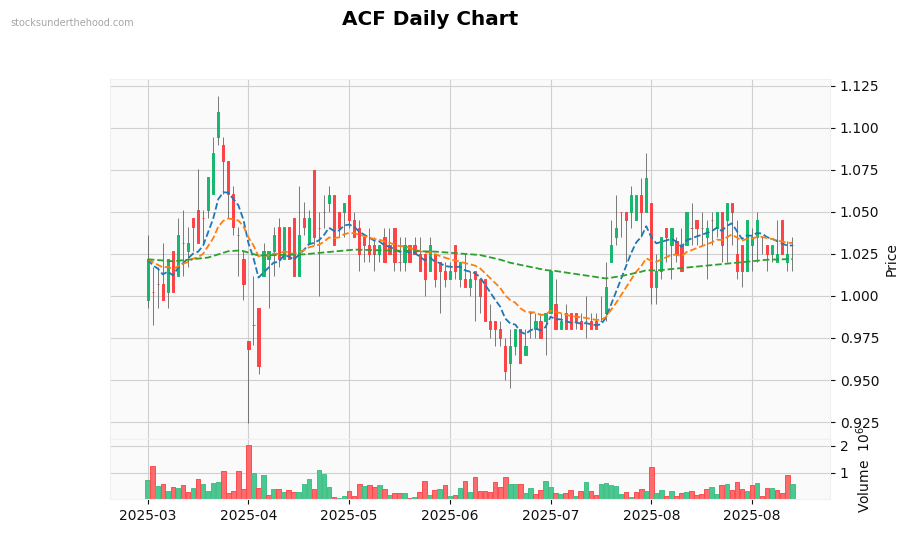
Daily Observations: Performance: +0.7% (1Y). Volume is below average. Currently moving sideways with mixed signals. Trading below EMA10. Trading below EMA21. Trading below EMA125. Price is below most EMAs (negative). EMAs show mixed signals. Price is in the middle of recent range.