GMD Technical Analysis
View This Company’s Fact Sheet: Open | Last updated: December 09, 2025 at 12:22 AM
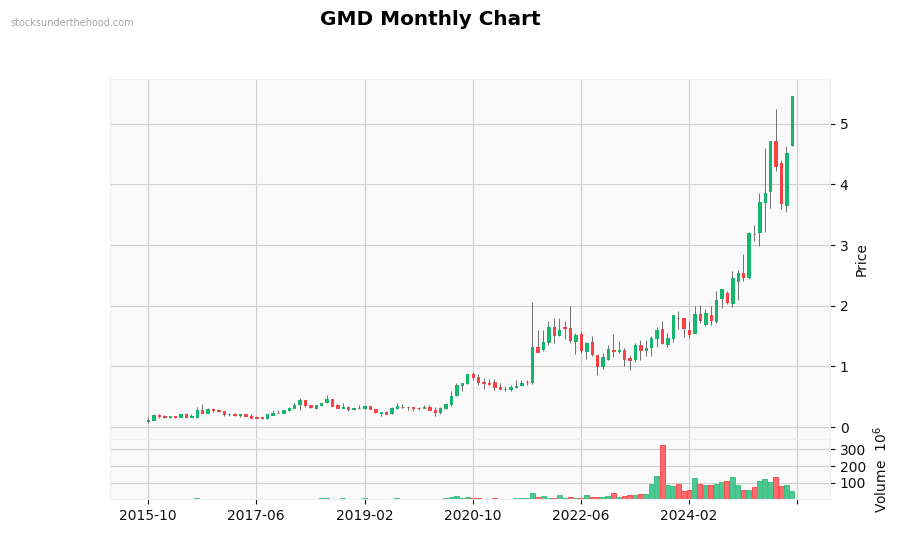
Monthly Observations: Performance: +3795.9% (10Y). Volume is significantly above average. with strong buying interest. Recent volume spike detected. Currently in a strong uptrend. Strong long-term uptrend (+244.7% over 2 years). High volatility stock. Down 13.9% from highs. Up 4631% from lows. Strong 6-month momentum. Price is near recent highs.
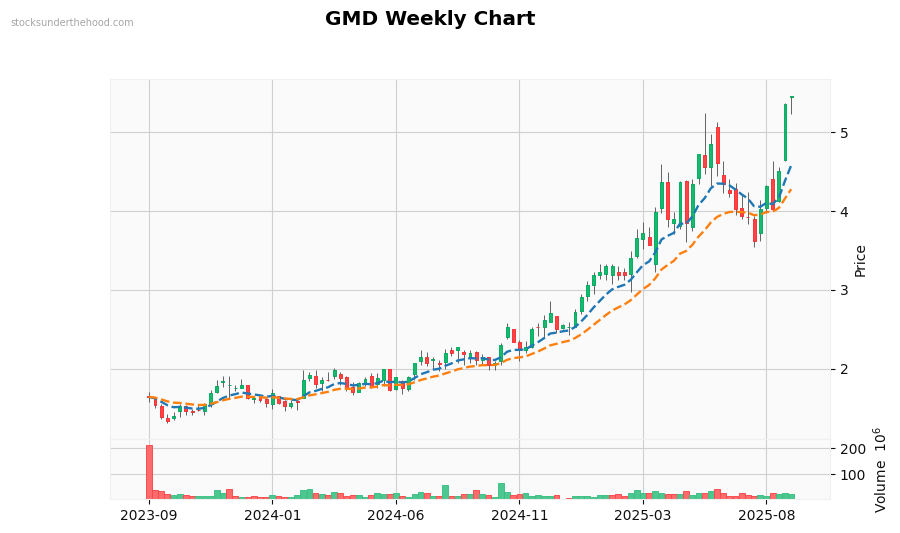
Weekly Observations: Performance: +235.3% (2Y). Volume is near average. Currently in an uptrend. Trading above EMA10. Trading above EMA21. Price is above all EMAs (bullish signal). EMAs are stacked bullishly. Price is near recent highs.
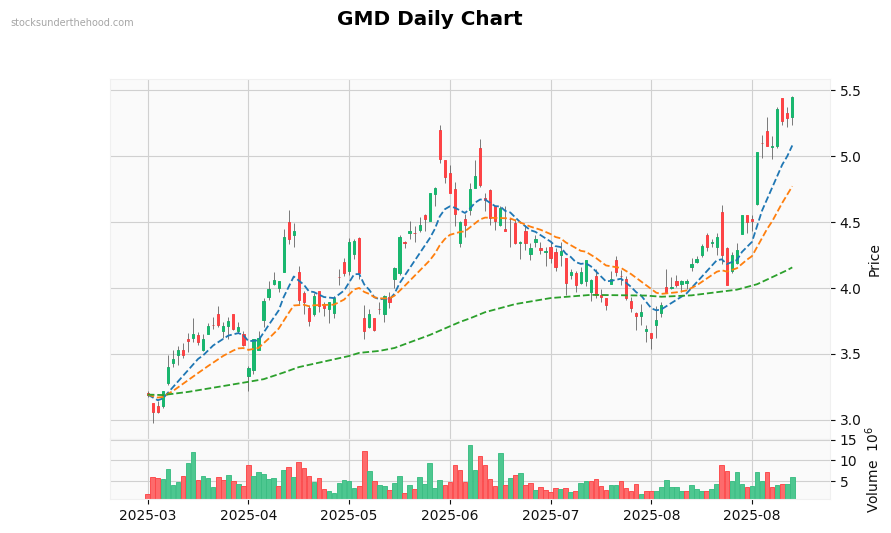
Daily Observations: Performance: +131.1% (1Y). Volume is near average. Currently in a strong downtrend. Trading below EMA10. Trading below EMA21. Trading above EMA125. Price is below most EMAs (negative). EMAs are stacked bullishly. Price is in the middle of recent range.