APZ Technical Analysis
View This Company’s Fact Sheet: Open | Last updated: December 05, 2025 at 11:33 PM
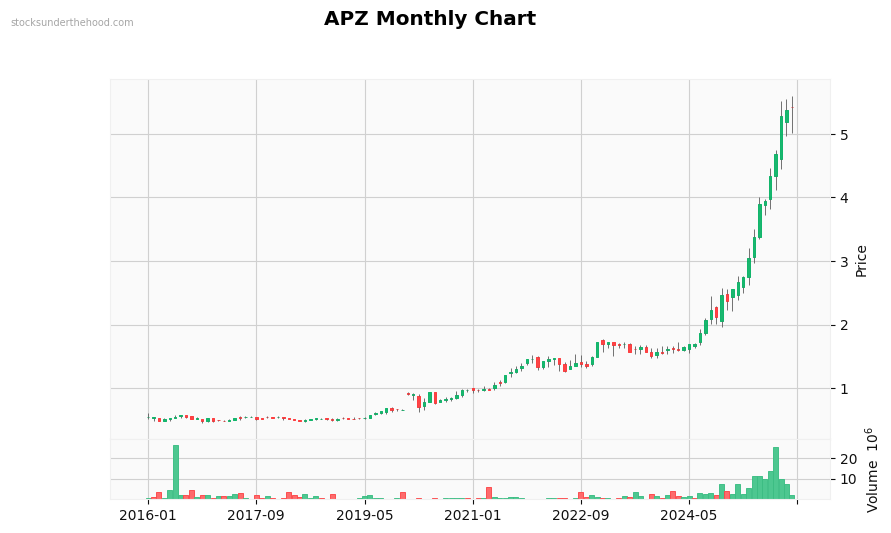
Monthly Observations: Performance: +879.1% (10Y). Volume is significantly above average. with strong buying interest. Recent volume spike detected. Currently in a strong uptrend. Candlestick patterns: Doji (indecision). Strong long-term uptrend (+248.4% over 2 years). Low volatility, stable movement. Trading near all-time highs. Up 1090% from lows. Strong 6-month momentum. Price is at recent highs.
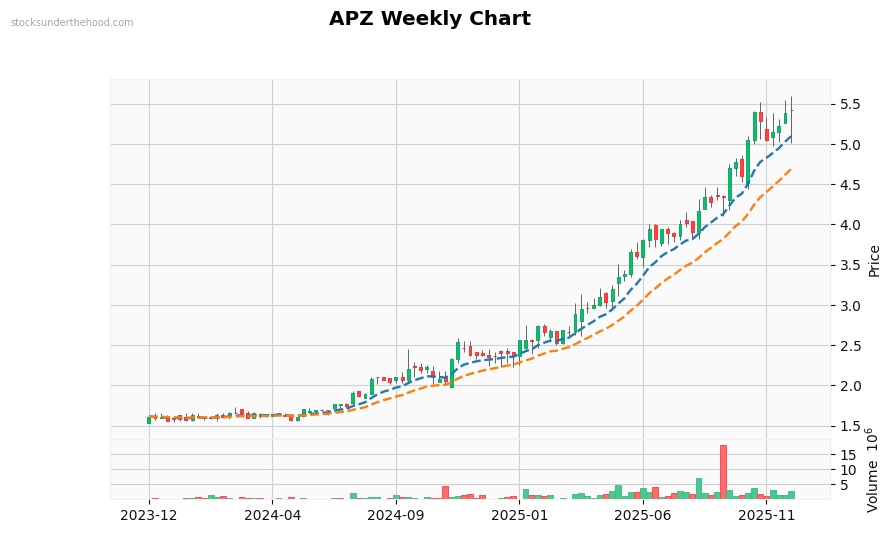
Weekly Observations: Performance: +236.5% (2Y). Volume is significantly above average. with strong buying interest. Recent volume spike detected. Currently in a strong uptrend. Trading above EMA10. Trading above EMA21. Price is above all EMAs (bullish signal). EMAs are stacked bullishly. Price is at recent highs.
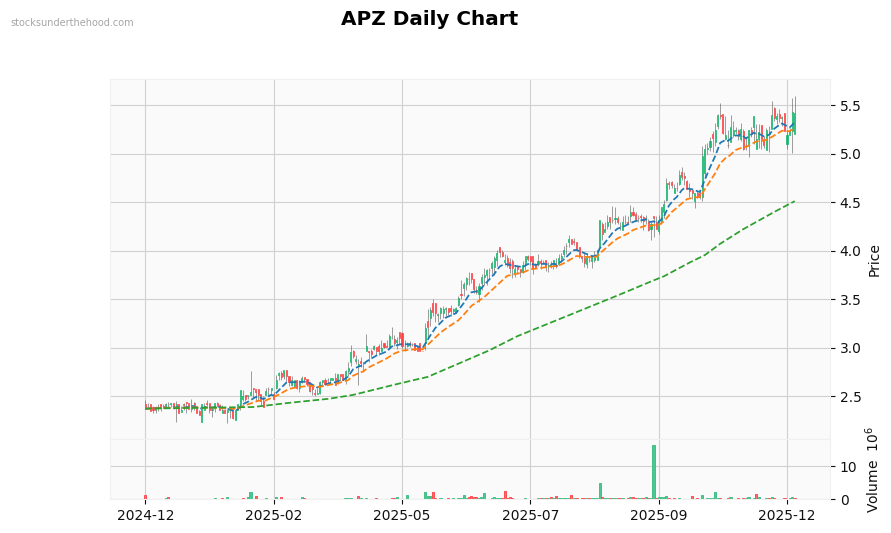
Daily Observations: Performance: +128.7% (1Y). Volume is near average. Currently in an uptrend. Trading above EMA10. Trading above EMA21. Trading above EMA125. Price is above all EMAs (bullish signal). EMAs are stacked bullishly. Price is at recent highs.