AUB Technical Analysis
View This Company’s Fact Sheet: Open | Last updated: December 05, 2025 at 11:33 PM
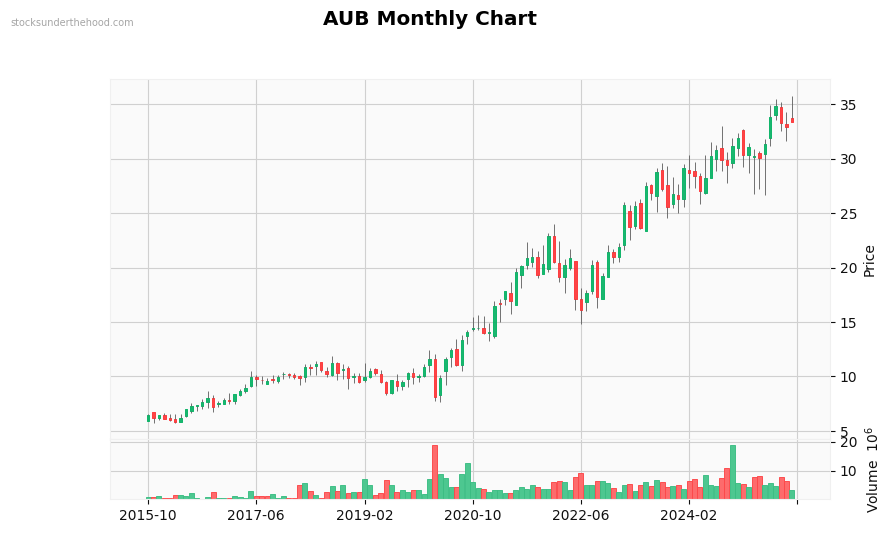
Monthly Observations: Performance: +417.4% (10Y). Volume is significantly above average. with strong buying interest. Currently moving sideways with mixed signals. Solid long-term gains (+20.5% over 2 years). Moderate volatility. Price is in the middle of recent range.
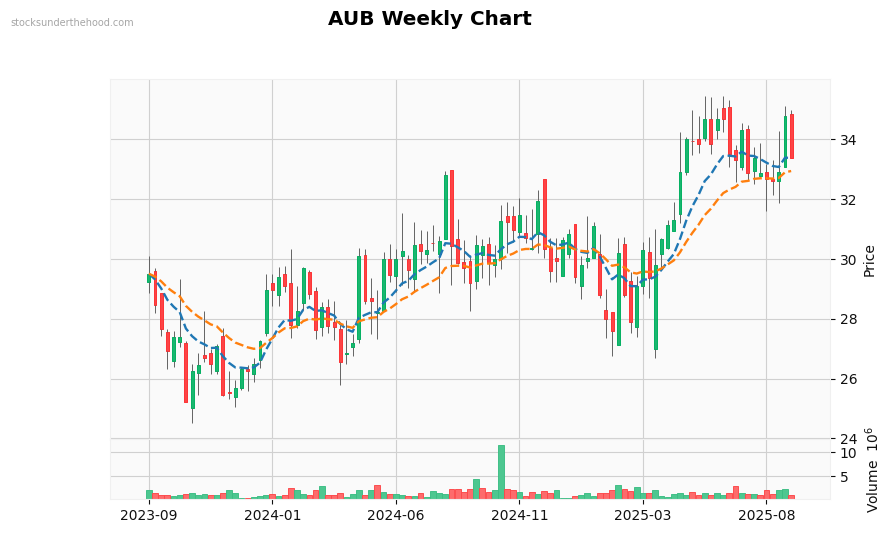
Weekly Observations: Performance: +24.7% (2Y). Volume is significantly above average. with heavy selling pressure. Recent volume spike detected. Currently moving sideways with mixed signals. Trading below EMA10. Trading below EMA21. Price is below most EMAs (negative). EMAs are stacked bullishly. Price is in the middle of recent range.
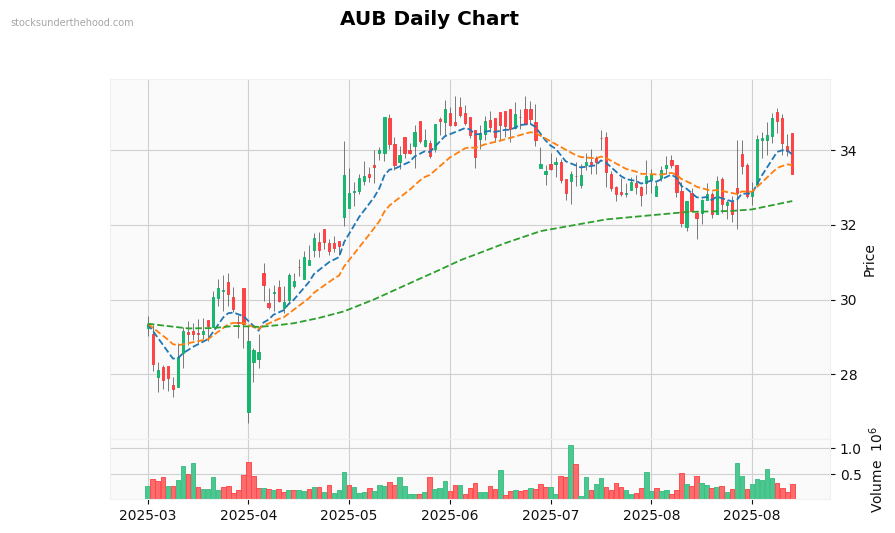
Daily Observations: Performance: +4.9% (1Y). Volume is significantly above average. with heavy selling pressure. Recent volume spike detected. Currently moving sideways with mixed signals. Trading below EMA10. Trading below EMA21. Trading below EMA125. Price is below most EMAs (negative). EMAs show mixed signals. Price is near recent lows.