Author: Nathan

AI Report: ASX:SRV 2025 AGM

Based on the CEO’s Address to the 2025 Annual General Meeting, Servcorp Limited is performing exceptionally well, delivering “record” results across almost every key financial metric.

Similar to Tasmea, Servcorp appears to be performing ahead of expectations, with current trading exceeding prior-year levels and management signaling they are tracking toward the upper end of their guidance range.

Here is the detailed analysis:

1. Financial Performance: Record-Breaking

Servcorp describes FY25 as a “fruitful year,” and the data supports this description strongly. The company achieved record highs in profit, earnings per share, and free cash flow.

  • Revenue Growth: Underlying operating revenue grew by 17% to $332.9m.

  • Profitability Surge: The company has more than doubled its Underlying Net Profit Before Tax (NPBIT) in just 4 years. For FY25 specifically, Underlying NPBIT rose 23% to $69.1m , and Earnings Per Share (EPS) jumped 25% to 65.3 cps.

  • Cash Flow Strength: Underlying free cash flow was very strong at $84.9m (up 17%), providing a solid foundation for reinvestment and dividends.

  • Efficiency: A standout metric is the Return on Funds Employed (ROFE). It has climbed steadily from 17% in FY19 to 74% in FY25, with a staggering estimate of 93% for the first half of FY26. This indicates highly efficient use of capital.

2. Performance vs. Expectations: Ahead

The outlook provided in the presentation suggests the company is outperforming its own historical benchmarks and is confident in beating conservative estimates.

  • Strong Start to FY26: The CEO explicitly states that “1Q26 results have exceeded the prior-year levels”.

  • Guidance Upgrade: Management noted that underlying NPBIT is “tracking to the higher end” of their FY26 guidance range ($72.0m – $76.0m).

  • Dividend Growth: Confidence is high enough that they have provided forward guidance that the FY26 dividend is “not expected to be below 30.0 cps,” an increase from the 28.0 cps paid in FY25.

3. Strategic Execution

Servcorp is balancing aggressive global expansion with financial discipline (a “healthy cash reserve”).

  • Global Expansion: They are actively growing their footprint. Two new operations opened in Q1 FY26 (Australia and Thailand) , and 9 additional locations are currently under construction to open within the next 12 months.

  • Technology Investment: They continue to invest “millions of dollars” in IT infrastructure and cybersecurity, viewing technology as a key enabler for their clients’ global operations.

  • Asset Heavy/Light Mix: Unlike some competitors who might be purely asset-light, Servcorp emphasizes a “complete ecosystem” and “premium service” supported by heavy investment in teams (10 team members per 100 offices).

4. Areas to Watch

  • Cautious Optimism: Despite the strong numbers, management describes their outlook as “cautiously optimistic”. This is standard corporate prudence but implies they are keeping an eye on potential global macroeconomic headwinds.

  • Capital Efficiency: The projected jump in ROFE to 93% in 1H26 is extraordinary. Investors should watch to see if this level of efficiency is sustainable long-term or if it reflects a temporary peak.

Conclusion

Servcorp is in excellent financial health. They are growing revenue double-digits, expanding margins, sitting on record cash, and aggressively opening new locations. The fact that they are already tracking toward the high end of their FY26 guidance and projecting dividend increases suggests they are currently outpacing market expectations.


Disclaimer: This information is provided purely for educational purposes. It takes no account of an individual’s personal financial circumstances and hence can in no way constitute financial advice. The above data may be subject to errors or inconsistencies for which the author takes no liability. It is imperative that all investors do their own research or if they need advice, seek it from a qualified financial adviser.

AI Report: ASX:SRV 2025 AGM

AI Report: ASX:TEA 2025 AGM

Based on the 2025 Annual General Meeting presentation, Tasmea Limited appears to be performing exceptionally well and is likely performing ahead of expectations.

The company reports significant growth across all key financial metrics, a rapidly rising share price, and a confident outlook for the next financial year.

Here is a detailed analysis of their performance:

1. Financial Performance: Very Strong

Tasmea has delivered substantial double-digit growth in both revenue and profitability, indicating strong operational health.

  • Revenue Growth: Statutory revenue increased by 37% to $548m. On a pro-forma basis (assuming acquisitions were held for the full year), revenue was $620.8m.

  • Profitability Surge: The company is becoming more profitable as it grows. Statutory EBIT (Earnings Before Interest and Tax) rose by 60% to $74.4m. Statutory Net Profit After Tax (NPAT) jumped by 74% to $53.1m.

  • Margin Expansion: Crucially, Tasmea is not just increasing sales but improving efficiency. Their pro-forma EBIT margin expanded to 15.0% in FY25 , driven by their ability to self-perform services rather than subcontracting.

  • Dividends: Shareholders were rewarded with a total fully franked dividend of 23.0 cents per share for FY25.

2. Performance vs. Expectations: Ahead

While the document does not explicitly list the “market consensus” expectations prior to the report, several indicators suggest the company is exceeding both internal and external targets:

  • Share Price Rally: Since its IPO in April 2024, the share price has grown by >200%. A price chart included in the presentation shows a steep upward trajectory from under $2.00 to over $5.00, suggesting the market is re-rating the company significantly higher than initial expectations.

  • Beating Growth Targets: The company has an internal target for organic growth (growth without buying new companies) of 15%. In their outlook, they state they are performing “Well above internal organic growth target of +15% per annum”.

  • Guidance Confidence: They have re-confirmed their FY26 guidance, projecting a further 32% growth in EBIT to $110m. Companies struggling to meet expectations usually lower or withdraw guidance; confirming such aggressive growth targets is a sign of confidence.

3. Strategic Execution

Tasmea is successfully executing a “twin-pillar strategy” comprising organic growth and programmatic acquisitions.

  • Acquisitions: The company has completed 14 acquisitions in the last 5 years. Recent acquisitions like Future Engineering Group and Flanco Group contributed to the FY25 pro-forma uplift.

  • Capital Management: They recently completed a $43m institutional placement to fund further growth and have maintained a healthy balance sheet with net leverage under 1.0x.

  • Operational Safety: A standout operational metric is their safety record, citing >4,500 days without a Lost Time Injury (LTI). In the industrial services sector, this is a critical indicator of disciplined management.

4. Areas to Watch (Risks)

While the report is overwhelmingly positive, an investor should keep the following in mind:

  • Reliance on Acquisitions: A significant portion of their growth strategy relies on buying other companies (“Programmatic Acquisitions”). While they have a proven track record, this strategy carries integration risks if they grow too fast.

  • Economic Sensitivity: They service “blue-chip essential asset owners” in mining, defense, and power. While these are essential sectors, a significant downturn in the resources or mining sector could impact their customers’ maintenance budgets.

Conclusion

Tasmea Limited is doing very well. They are capitalizing on high demand in the mining, power, and infrastructure sectors, expanding their margins, and successfully integrating acquisitions. The >200% share price growth since their recent IPO suggests they are rapidly outpacing market expectations.


Disclaimer: This information is provided purely for educational purposes. It takes no account of an individual’s personal financial circumstances and hence can in no way constitute financial advice. The above data may be subject to errors or inconsistencies for which the author takes no liability. It is imperative that all investors do their own research or if they need advice, seek it from a qualified financial adviser.

AI Report: ASX:TEA AGM

Inside Plato Global Alpha (ASX:PGA1)

A Busy Engine Behind a Calm Ride

When you look at the performance tables, the Plato Global Alpha Fund (ASX:PGA1) jumps off the page.

Since its strategy began in 2021, it has delivered returns in the mid-20s per annum (after fees), against low-teens for the MSCI World Net Returns Index – roughly 12 percentage points of excess return per year over a strong global bull market. That kind of result gets attention, and it should. But it also raises obvious questions:

  • What on earth is it doing to get there?
  • How repeatable is it?
  • And what risks sit under the hood?

PGA1 only listed on the ASX as a “complex ETF” in late 2024, providing a convenient vehicle for local investors to access the underlying Plato Global Alpha strategy. In this article I’ll focus less on the wrapper and more on the engine: what the portfolio actually looks like, how much it trades, and what that tells us about the way Plato is trying to generate “all-weather” alpha.

What is PGA1, in simple terms?

At its core, PGA1 is a global equity long/short fund:

  • It owns (“goes long”) a large basket of shares it expects to outperform.
  • It also shorts a large basket of shares it expects to underperform – that is, it sells borrowed shares and profits if they fall.
  • It uses the cash from shorting to buy more longs, so the fund ends up with more than 100% of its capital invested on the long side, partly funded by those shorts.

In the latest update, the typical positioning looked roughly like this:

  • Around 140–145% long
  • Around 45–50% short
  • Net exposure still close to 100% “in the market” – you’re not buying a market-neutral hedge fund, you’re buying a geared global equity exposure with an internal alpha overlay.

The process is systematic. Plato describes it as:

  • A bottom-up, factor-driven stock selection model that scores companies on value, growth, quality and sentiment, and
  • A large “red flag” library (100+ checks) designed to spot accounting issues, balance sheet risk, earnings deterioration and other potential “landmines” – both to avoid on the long side and to target on the short side.

The result is not a concentrated “best 30 stocks” portfolio. It’s a very broad book:

  • Over 1,000 long positions
  • Several hundred short positions
  • Each individual position is typically small – often measured in a few tenths of a percent of the portfolio, rather than big 5–10% bets.

That breadth and diversification are key to understanding what comes next.

Are they constantly churning the portfolio?

One of the simplest ways to test how a fund behaves is to compare what it owned at two different points in time.

For PGA1, I looked at two full portfolio disclosures:

  • End of December 2024
  • End of June 2025

These are the only two complete holdings snapshots we have so far, but they already tell us quite a bit.

1. Name turnover vs capital turnover

On a name count basis, the portfolio looks very busy:

  • The December snapshot held about 1,260 individual securities.
  • By June, this had increased to roughly 1,350 securities.
  • Around 70% of the December names were still in the book by June.
  • The remaining 30% or so had disappeared, and there were hundreds of new names in their place.

If you stopped there, you’d conclude the fund is churning through positions at a furious rate.

But when you look at capital, the picture is almost the opposite:

  • Roughly 95% of the December portfolio by weight was still invested in the same names six months later.
  • Only about 5% of the capital had been recycled into completely new positions that weren’t in the December list at all.
  • Coming the other way, roughly 90%+ of the June portfolio by weight was already present in December; only high single-digits by weight were genuinely new.

In other words:

There’s lots of activity in the tails – many small positions coming and going – but the core capital is remarkably stable.

From a trading-behaviour point of view, PGA1 looks less like a trader jumping in and out of big bets, and more like a large, systematic engine continually re-sizing a huge number of small positions as its models update.

2. Long to short flips (and vice versa) are rare but meaningful

With a long/short fund, a good stress-test is to ask:

How often do they flip a stock from long to short, or from short to long?

Between December and June, only a handful of names did a full U-turn:

  • A small group moved from being net long (owning more than they shorted) to net short.
  • A slightly larger group did the opposite.

Given the fund runs well over 1,500 aggregate positions, the fact that only a dozen or so names flipped direction over that six-month window tells you something:

  • Most shorts are not “we hated it last quarter, now we love it” trades.
  • They tend to be more structural expressions of the model – a stock sits in the doghouse for a while before earning its way out, and the position size moves gradually rather than whipping around.

When a name does flip from long to short or short to long, the change is usually meaningful in size. You’re seeing the model say, “This stock now scores very differently,” and the portfolio reflecting that.

What sort of companies does the fund actually own?

The October 2025 investment update gives a nice snapshot of the aggregate characteristics of the long book versus the index.

On average, the companies held long in PGA1 show:

  • Higher profitability: return on equity around 22% vs ~18% for the benchmark.
  • Faster growth: cash-flow growth roughly double that of the index.
  • Cheaper valuations: price/earnings and price/cash-flow ratios notably lower than MSCI World.

Inside Plato Global Alpha (ASX:PGA1) - portfolio characteristics

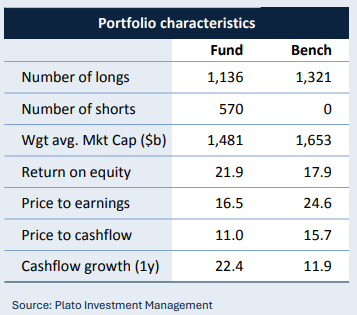
So the long side of the portfolio, in broad terms, looks like “cheap quality growth”:

Companies earning strong returns on capital, growing faster than the average, but not trading at the most extreme growth-stock multiples.

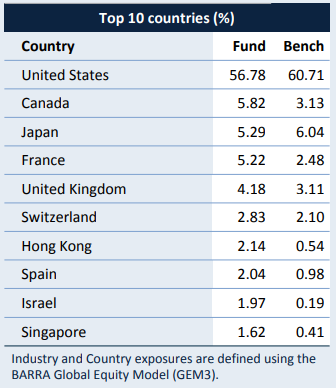
On the sector and country mix, the portfolio:

  • Holds a big chunk in US mega-cap tech and AI winners (NVIDIA, Apple, Microsoft, Alphabet, Amazon, Meta, Broadcom and friends).

ASX:PGA1 top 10 holdings

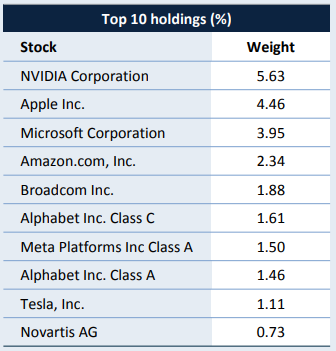
  • Shows clear overweights to financials (banks, capital markets, insurers) and some real-economy cyclicals like building products and defence.
  • Is underweight more defensive areas such as consumer staples and large-cap pharmaceuticals.

ASX:PGA1 top 10 industries

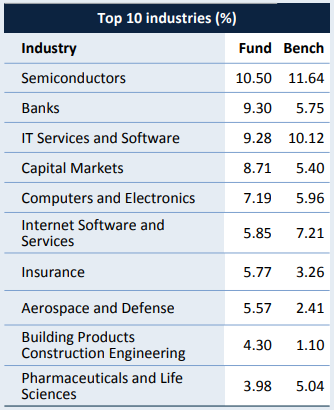
  • Is biased to the US but with active tilts towards selected non-US markets (Canada, parts of Europe and Asia).

ASX:PGA1 top 10 countries

Meanwhile, several of the worst detractors over the prior year came from the short book – for example, short positions in some mining and energy names that rallied hard. That’s a useful reminder that:

The short side is very real in this strategy – when a theme the fund is shorting goes on a tear, it can hurt.

High active share, modest tracking error – why that matters

Two statistics in the update are worth dwelling on:

  • Active share ~90%+
  • Tracking error ~3–3.5%

Active share measures how different the fund’s holdings are to the index. At 90-plus percent, PGA1 is about as far from a closet indexer as you’ll find in a listed ETF.

Tracking error measures how much the fund’s returns typically wiggle around the benchmark over time. A figure around 3% is not especially high; many “high conviction” long-only global funds run tracking errors in the mid-single digits.

Putting those two together:

  • At the stock level, PGA1 is very different to the index – it owns and shorts a huge number of names that aren’t in MSCI World at all, and is constantly re-sizing them.
  • At the portfolio level, the combination of long and short baskets is engineered to keep overall risk close to the market in terms of volatility and beta.

For investors, the practical translation is:

You’re getting something that behaves a lot like a global equity fund in terms of overall risk, but looks nothing like the index inside the engine bay.

That’s both the appeal and the danger: if the process continues to extract alpha from its stock-picking and risk controls, tracking error stays “cheap”; if the process hits a rough patch, you feel it quickly.

Fees, incentives and what you’re really paying for

A strategy like this doesn’t come at index-ETF prices.

For the quoted ETF class (PGA1 on the ASX), the key elements are:

  • A management fee of 0.85% p.a. of the fund’s net asset value. Ordinary operating expenses are bundled into this.

  • A performance fee of 15% of any outperformance (after management fees and costs) relative to the MSCI World Net Returns Index (unhedged, in AUD). This accrues daily and is typically paid semi-annually when the fund has a positive performance-fee balance.

  • Indirect costs (for things like underlying vehicles and OTC derivatives) have historically been very small – estimated around 0.03% p.a. in recent disclosure.

For regulatory reasons, the PDS also has to quote an estimate of total “management fees and costs” that includes an assumption for performance fees based on the strategy’s actual history. Using performance up to 30 June 2024, that all-in figure comes out around 1.18% p.a. – effectively saying: “If future performance fees looked like they did over the last few years, the average ongoing cost would have been roughly this level.”

A few practical points:

  • You only pay a performance fee if the fund beats its benchmark after costs. If it underperforms for a while, the negative accrual has to be earned back before the manager gets paid again.

  • When the alpha engine is firing, performance fees can be material – which you can see indirectly in the fact that the long-term returns quoted are after both management and performance fees.

  • Compared with plain-vanilla global index ETFs (often in the 0.10–0.20% range), you’re paying a clear “complexity and skill” premium here. The real question isn’t whether the fee is high or low in isolation; it’s whether the net, after-fee outcome justifies owning a strategy like this at all.

In other words:

PGA1 is priced more like a hedge fund than a cheap index tracker – but so far, the net numbers have been strong enough that investors haven’t had to squint to see what they’ve received for that fee drag.

The risk, of course, is that if the alpha fades and the fee meter keeps ticking, the gap between fund and benchmark can close quickly – or turn the other way.

Performance so far: excellent, but don’t anchor on it

The scoreboard to 31 October 2025 looks outstanding:

  • Since inception (Sept 2021): fund ~25–26% p.a. vs benchmark ~13% p.a.
  • 1-year to October 2025: fund over 40%, benchmark around 22%.
  • Upside capture: the fund has historically captured roughly 128% of rising markets.
  • Downside capture: it has historically captured around 65% of falling markets.

In plain English:

So far, PGA1 has gone up more than the market in good times and fallen less in bad times, while running similar overall volatility.

That is exactly the shape of return profile investors dream about – hence the attention.

But a couple of sobering points are worth emphasising:

  • The track record, while not microscopic, is still one market cycle dominated by an enormous bull market in US growth and AI-related names.

  • A lot of the headline alpha has come from being on the right side of that regime – large positions in mega-cap growth winners, plus strong selection within the mid-cap and smaller-cap parts of the universe.

  • Quant strategies are not immune to prolonged drawdowns when their particular blend of factors falls out of favour.

Past performance – especially exceptional performance – is not a forecast. It’s evidence that the process has worked so far, in a particular environment.

Inside Plato Global Alpha (ASX:PGA1) - daily price chart since inception with volume and 3EMA

What could go wrong?

No strategy is bullet-proof. Some of the key risks I’d flag, particularly for a fund like this, include:

Factor regime risk
The fund leans into a particular combination of value, growth, quality and sentiment signals. There have been long periods in history where some or all of those signals have gone cold. If the environment rotates in a way the model doesn’t handle well (for example, a sudden, sustained rotation out of quality growth and into deep cyclical value), underperformance can be sharp.

Short-book and leverage risk
Running ~140–150% long and ~45–50% short means the fund has gross exposure well above 100%. That’s fine as long as the alpha engine is working. If longs and shorts both move against the fund at the same time, losses can compound faster than in a traditional, unlevered fund.

Crowding and capacity
The underlying strategy now runs a material pool of capital. If many quant funds end up chasing similar signals in the same parts of the market, some of the edge can erode, and liquidity can dry up just when it’s least convenient.

Model risk and “unknown unknowns”
A big part of the appeal here is the red-flag library and the depth of the data the team uses. The flip side is that the behaviour of a large, complex model is always partly a black box to outside investors. You’re outsourcing a lot of decision-making to a process you can’t fully see.

None of these are arguments against the fund. They’re simply the other side of the coin when you venture away from traditional, long-only benchmarks into high-breadth, leveraged, long/short quant territory.

How I’d frame PGA1 in a portfolio conversation

Without making a recommendation, I’d summarise Plato Global Alpha (ASX:PGA1) like this:

  • It’s not a simple “set and forget” global index tracker.
  • It is a sophisticated, high-activity engine that:
    • Runs hundreds of small long and short positions.
    • Keeps the core holdings surprisingly stable over time, while constantly tuning position sizes at the margin.
    • Seeks to own a portfolio of profitable, growing companies at reasonable valuations, and short those that fail a set of forensic-style red-flag tests.
    • Has so far delivered very strong excess returns with index-like overall risk.

The key questions for any investor thinking about it are:

  • Can the team maintain this level of alpha as assets grow?
  • How does the strategy behave if we get a long period without a dominant US-tech/AI tailwind?
  • Is the 4% p.a. targeted outperformance over MSCI World (after fees) a realistic long-term guide, or was the early period unusually favourable?

This is a complex, active global equity strategy inside an ETF wrapper. It may be a powerful diversifier, but it’s not a plain-vanilla index fund, and it deserves the same level of due diligence you’d apply to any specialist manager. Anyone considering it should read the Product Disclosure Statement, understand the risks, and think carefully about how a fund like this would sit alongside their other holdings and risk tolerance.


Disclaimer: This information is provided purely for educational purposes. It takes no account of an individual’s personal financial circumstances and hence can in no way constitute financial advice. The above data may be subject to errors or inconsistencies for which the author takes no liability. It is imperative that all investors do their own research or if they need advice, seek it from a qualified financial adviser.

Inside Plato Global Alpha (ASX:PGA1)

Most Shorted ASX Stocks 5/11/25

The top 20 ASX companies with the highest short-sold positions

Most Shorted ASX Stocks 5/11/25 - top 20 list

General observations comparing today to 9 months ago

  • 8 stocks remain in the top 20 today that were in the top 20 back then.
  • Themes remain similar
    • In Feb there were 3 Uranium stocks in the top 20. Today there are still 3.
    • In Feb there were 3 Lithium stocks. Today there are still 3.
    • In Feb there was a silver stock, a gold stock, a rare earths stock, a graphite stock and an oil stock. Resources have been recovering over the last 3 or so months As a result, Iluka (mineral sands) is the only other resource stock in the top 20 today.
    • There are more fallen angle style industrial stocks in the top 20.
    • A new theme has emerged: Healthcare stocks of which there are now 4 in the top 20 today. Nevertheless, I would still put these in the “fallen angels” category.

A look at the 8 stocks that remain in the list

  1. Boss Energy

Most Shorted ASX Stocks 5/11/25 - BOE price and short position charts

BOE Red flag analysis

2. Palladin Energy

Most Shorted ASX Stocks 5/11/25 - PDN price and short position charts

PDN Red flag analysis

3. Dominos Pizza

Most Shorted ASX Stocks 5/11/25 - DMP price and short position charts

DMP Red flag analysis

4. Pilbara Minerals

Most Shorted ASX Stocks 5/11/25 - PLS price and short position charts

PLS Red flag analysis

5. IDP Education

Most Shorted ASX Stocks 5/11/25 - IEL price and short position charts

IEL Red flag analysis

6. Corporate Travel Group

Most Shorted ASX Stocks 5/11/25 - CTD price and short position charts

CTD Red flag analysis

7. Lifestyle Communities

Most Shorted ASX Stocks 5/11/25 - LIF price and short position charts

LIC Red flag analysis

8. Mineral Resources

Most Shorted ASX Stocks 5/11/25 - MIN price and short position charts

MIN Red flag analysis


A look at some of the stocks that are no longer on the list

  1. Syrah Resources

Most Shorted ASX Stocks 5/11/25 - SYR price and short position charts

SYR Red flag analysis

2. Deep Yellow

Most Shorted ASX Stocks 5/11/25 - DYL price and short position charts

DYL Red flag analysis

3. Star Entertainment Group

Most Shorted ASX Stocks 5/11/25 - SGR price and short position charts

4. Megaport

Most Shorted ASX Stocks 5/11/25 - MP1 price and short position charts

MP1 Red flag analysis

5. Lynas

Most Shorted ASX Stocks 5/11/25 - LYC price and short position charts

LYC Red flag analysis


A look at some recent additions

  1. Guzman Y Gomez

Most Shorted ASX Stocks 5/11/25 - GYG price and short position charts

GYG Red flag analysis

2. Telix Pharmaceuticals

Most Shorted ASX Stocks 5/11/25 - TLX price and short position charts

TLX Red flag analysis

3. Digico Infrastructure

Most Shorted ASX Stocks 5/11/25 - DGT price and short position charts

DGT Red flag analysis


Conclusion

The conclusions I reached in February 2025 still hold. Troubled resource names and fallen angels continue to dominate the most-shorted list. Overlaying my red-flag checks shows that almost every heavily shorted stock has multiple fundamental issues—declining earnings, high debt, margin compression, and/or stretched valuations. This isn’t market manipulation or predatory behaviour; it’s weak fundamentals. In most cases, the rationale for heavy short interest is as straightforward as the rationale for strong buying in companies delivering consistent growth.


Disclaimer: This information is provided purely for educational purposes. It takes no account of an individual’s personal financial circumstances and hence can in no way constitute financial advice. The above data may be subject to errors or inconsistencies for which the author takes no liability. It is imperative that all investors do their own research or if they need advice, seek it from a qualified financial adviser.

Most Shorted ASX Stocks 5/11/25

Tabcorp Holdings (ASX:TAH) 2025 AGM Presentation Summary

October 2025 | Website: https://www.tabcorp.com.au

Overall Report Tone

Tabcorp Holdings (ASX: TAH) delivered a substantial turnaround in FY25, showing strong revenue and earnings growth, improved operational efficiency, and a clear execution strategy to become a structurally profitable omnichannel wagering business. Management expressed confidence and momentum heading into FY26, driven by strategic reforms, leadership renewal, and continued investment in digital and customer safety capabilities.


📊 Financial Results Summary (FY25 vs FY24)

Metric FY25 FY24 % Change
💰 Revenue $2,614.6M $2,338.9M +11.8%
📈 Variable Contribution $1,088.7M $931.7M +16.9%
💸 Operating Expenses (Opex) ($697.2M) ($614.0M) -13.6%
💼 EBITDA $391.5M $317.7M +23.2%
🧮 EBIT $188.7M $97.4M +93.7%
🧾 NPAT (before significant items) $49.5M $28.0M +76.8%
📉 Statutory NPAT $36.6M ($1,359.7M) Turnaround
💵 Adjusted EPS 3.9 cps Not disclosed >100%
💰 Dividend (unfranked) 2.0 cps 1.3 cps +54%
📉 Net Debt to EBITDA 1.6x Not disclosed ✅ Below 2.5x target

🆕 New Information Disclosed

🐎 Successful transition to new Victorian Wagering Licence, contributing ~$84M in EBITDA uplift over 10.5 months.
🧠 New AI-powered player monitoring tool to be deployed in FY26 to enhance real-time intervention and customer safety.
🧱 Restructuring implemented: 230 roles removed, vertical integration applied, tighter P&L accountability introduced.
🧑‍💼 New leadership team onboarded with capability in wagering, digital, legal, operations, and compliance.
🏇 TAB Takeover and TAB Time delivering brand impact across racing carnivals and Saturday venues.
📺 Strategic focus on retail innovation, Sky Media, and the MAX network, targeting an integrated omnichannel experience.


✅ Positive Surprises or Potential Concerns

  • 📈 NPAT grew 77% and EBIT nearly doubled, showing strong operational leverage.

  • 🧠 Cost discipline resulted in opex down 2.4%, ahead of target — margin-accretive execution.

  • 💡 New strategic clarity: Five-pillar framework offers structured growth roadmap with stakeholder alignment.

  • ⚠️ Transformation costs ($27.1M) and lack of franking capacity (due to tax refund) could weigh on short-term perceptions.


📉 Results vs Market Expectations

  • 🎯 Earnings well above prior year and likely ahead of market expectations post-restructure and demerger impact.

  • ✅ FY25 marks a clear pivot from turnaround to execution, with FY26 now expected to reflect full Victorian Licence benefit.

  • 🔍 Investor focus shifting from survival to scalability and profitability, helped by strong media and digital assets.

  • Franking credit absence (due to FY24 ATO refunds) limits full income yield for some investors.


🔮 Outlook and Guidance Statements

  • 🔄 FY26 to focus on operationalising strategy and delivering full-year uplift from Victorian licence.

  • 🔄 Continued investment in AI and customer protection, with new monitoring tools and enhanced Safer Gambling team.

  • 🧭 Long-term goal to deliver structural profitability in retail and leadership in national tote reform.

  • 💼 Media growth and asset integration (Sky, Tote, MAX) set to differentiate offering in sports and racing entertainment.


Tabcorp Holdings (ASX:TAH) 2025 AGM Presentation Summary - 12 month share price chart with 3EMA and volume indicators


Disclaimer: This information is provided purely for educational purposes. It takes no account of an individual’s personal financial circumstances and hence can in no way constitute financial advice. The above data may be subject to errors or inconsistencies for which the author takes no liability. It is imperative that all investors do their own research or if they need advice, seek it from a qualified financial adviser.

Tabcorp Holdings (ASX:TAH) 2025 AGM Presentation Summary

Kinatico (ASX:KYP) 2025 AGM Presentation Summary

October 2025 | Website: https://www.kinatico.com

Overall Report Tone

The Q1 FY26 update from Kinatico (ASX: KYP) signals strong operational momentum, driven by accelerating SaaS revenue growth and improved profitability, all while maintaining a debt-free balance sheet. The company’s strategic focus on small to medium business (SMB) markets and the launch of its compliance marketing initiative (“KC”) underline its transition into a higher-margin, scalable SaaS-driven growth model.


📊 Financial Results Summary (Q1 FY26 vs Q1 FY25)

Metric Q1 FY26 Q1 FY25 % Change
💰 Consolidated Revenue $9.1M $8.0M +13%
💻 SaaS Revenue $4.8M $3.0M +58%
📊 SaaS % of Total Revenue 53% 38% ↑ by 15pp
📈 Annualised SaaS Revenue $19.2M $12.1M +58%
🏦 EBITDA $1.4M $1.2M +21%
📉 Net Debt $0 $0 No change

🆕 New Information Disclosed

🔹 “KC” Compliance Platform has been soft-launched with 7 early signups even before marketing begins — a new initiative aimed at the SMB compliance market.
🔹 Marketing investment into KC includes print, digital, social, podcast, and streaming ads, signalling a full-scale go-to-market push.
🔹 Clear dual-track strategy revealed: SMB (volume + self-service) and Mid/Enterprise (ACV + expansion potential).
🔹 First signs of international growth plans: focus on New Zealand and Southeast Asia.
🔹 Company is pushing the narrative of growing AND remaining profitable through automation, margin expansion, and scalability.


✅ Positive Surprises or Potential Concerns

  • 💡 +58% SaaS revenue growth with SaaS now over half of total revenue indicates a rapid and healthy business model transition.

  • 🐶 Launch of KC (Kelpie character) is a bold and differentiated marketing initiative — unique in B2B RegTech space.

  • 💪 EBITDA margins expanded despite growth investment, showing disciplined cost management.

  • 🚫 No mention of cash flow, EPS or dividend, which may be a concern for income-focused investors.


📉 Results vs Market Expectations

  • 📈 Revenue and EBITDA growth exceed typical expectations for a microcap SaaS business — particularly with no debt.

  • 🤖 The platform appears ready to scale, with investment into automation and unit economics already paying off.

  • 🚀 Marketing activity implies confidence in demand, with 7 early adopters signed pre-launch.

  • 🔍 Investors may note the lack of full financials (no EPS or cash flow), making full analysis more difficult.


🔮 Outlook and Guidance Statements

  • 🎯 Company expects to scale profitably, balancing investment in KC with margin discipline.

  • 🌏 International expansion planned after AU/NZ success — SEA markets cited as next logical step.

  • 🛠 Continued emphasis on automation and tech enablement to support margin expansion.

  • 📈 Strong statements of ongoing EBITDA growth, with self-funded reinvestment a key theme.


Kinatico (ASX:KYP) 2025 AGM Presentation Summary - 12 month daily price chart with 3EMA and volume indicators


Disclaimer: This information is provided purely for educational purposes. It takes no account of an individual’s personal financial circumstances and hence can in no way constitute financial advice. The above data may be subject to errors or inconsistencies for which the author takes no liability. It is imperative that all investors do their own research or if they need advice, seek it from a qualified financial adviser.

Kinatico (ASX:KYP) 2025 AGM Presentation Summary

FY25 Results Season Performances

Baby Bunting (BBN)

Sector: Consumer Cyclical | Industry: Specialty Retail

Baby Bunting Group Limited is Australia’s largest specialty retailer of baby goods, offering a comprehensive range of products and services for infants and parents.

BBN Broker Price Target: $2.74 (previous $1.775) – BUY


Tabcorp (TAH)

Sector: Consumer Cyclical | Industry: Gambling

Tabcorp Holdings Limited is a diversified gambling entertainment company, operating wagering, media, and gaming services across Australia, including TAB, Sky Racing, and Keno brands.

  • 2025 PER 25.4 | 2026e PER 33.8

TAH Broker Price Target: $0.96 (previous $0.82) – BUY


ZIP Co (ZIP)

Sector: Financial Services | Industry: Credit Services

Zip Co Limited is a financial technology company providing buy now, pay later services, allowing consumers to make purchases and pay over time, operating across various markets globally.

ZIP Broker Price Target: $4.48  (previous $3.46) – STRONG BUY


Life360 (360)

Sector: Technology | Industry: Software – Application

Life360, Inc. is a technology company specializing in location-based services through its Life360 mobile app, which offers features like location sharing, driving safety, and emergency assistance. The company also provides hardware tracking devices through its Tile product line, enabling users to locate lost items.

360 Broker Price Target: $47.27  (previous $27.30) – BUY


Eagers Automotive (APE)

Sector: Consumer Cyclical | Industry: Auto & Truck Dealerships

Eagers Automotive Limited is Australia’s largest automotive retail group, operating a network of dealerships across the country. The company offers a wide range of new and used vehicles, along with related services such as financing, insurance, and parts distribution.

APE Broker Price Target: $24.05  (previous $12.16) – NEUTRAL


Lovisa Holdings (LOV)

Sector: Consumer Cyclical | Industry: Specialty Retail

Lovisa Holdings Limited is a fast-fashion jewelry retailer, operating stores across Australia and internationally, offering a range of affordable jewelry and accessories.

LOV Broker Price Target: $24.05  (previous $12.16) – NEUTRAL


Netwealth Group (NWL)

Sector: Technology | Industry: Software – Application

Netwealth Group Limited offers investment and superannuation platform solutions, providing financial intermediaries and investors with a range of portfolio administration and management services.

NWL Broker Price Target: $34.50  (previous $28.09) – NEUTRAL


Aussie Broadband (ABB)

Sector: Communication Services | Industry: Telecom Services

Aussie Broadband Limited is an Australian telecommunications company providing internet, mobile, and other related services to residential, business, and government customers. Founded in 2003 and based in Morwell, Australia, it offers broadband, voice, and managed network solutions across the nation.

ABB Broker Price Target: $5.87  (previous $3.99) – BUY


The A2 Milk Company (A2M)

Sector: Consumer Defensive | Industry: Packaged Foods

The a2 Milk Company Limited specializes in the sale of branded milk and related products containing only the A2 protein type, catering to consumers in Australia, New Zealand, China, and the United States. Their product line includes liquid milk, infant formula, and other dairy products under the a2 Milk and a2 Platinum brands.

A2M Broker Price Target: $8.13  (previous $6.17) – NEUTRAL


CSL (CSL)

Sector: Healthcare | Industry: Biotechnology

CSL Limited is a global biotechnology company that develops and delivers innovative biotherapies and influenza vaccines, improving the health of people worldwide.

CSL Broker Price Target: $284.7  (previous $319.08) – BUY

James Hardie Industries (JHX)

Sector: Basic Materials | Industry: Building Materials

James Hardie Industries plc (ASX:JHX) manufactures and sells fiber cement and gypsum products for building applications like siding and cladding. They operate in North America, Asia Pacific, and Europe with brands like HardiePlank.

JHX Broker Price Target: $33.95  (previous $54.10) – BUY


Woolworths Group (WOW)

Sector: Consumer Defensive | Industry: Grocery Stores

Woolworths Group Limited (ASX:WOW) operates supermarkets in Australia and New Zealand under Woolworths, Metro, and Countdown brands, alongside discount retailer Big W and Petstock for pet supplies. It also supports online retail and B2B food supply services.

WOW Broker Price Target: $30.32  (previous $34.99) – NEUTRAL


Your Stock Requests

Island Pharmaceuticals (ILA)

  • Micro-cap antiviral repurposing biotech. Lead asset ISLA-101 (a repurposed small-molecule) is being developed for dengue fever using a human challenge model; strategy is faster, lower-risk development by starting with known safety profiles.
  • Positive Phase 2a/b top-line results (12 Jun 2025). Company reported clinically meaningful anti-dengue activity: reduced viremia and symptoms in the prophylactic cohort; a treatment-cohort drug signal; presentation with additional findings followed on 17 Jun. These results are the primary driver of recent interest.
  • June QTR Cash flow report: Revenue $0 | OCF -$823K | Cash on hand: $7.3M | No debt

Race Oncology (RAC)

  • Clinical-stage oncology company developing RC220 (bisantrene), a reformulated anthracene-derived agent pitched for two things: anticancer activity and cardio-protection when combined with doxorubicin (a standard chemo that’s cardiotoxic).
  • Phase 1 combo trial is live and recruiting: first patient safely dosed on 19 Jun 2025 in Australia; Hong Kong sites (Queen Mary, Prince of Wales) received ethics approvals in July and activation commenced in early September with screening underway. These steps de-risk execution and tend to be trading catalysts for small-cap biotech.
  • June QTR Cash flow report: Revenue $0 | OCF -$3.5M | Cash on hand: $13.7M | No debt

4DMedical (4DX)

  • Respiratory imaging software that quantifies lung ventilation/perfusion from standard scans (no contrast). Core products include XV LVAS and the newer CT:VQ. Revenue is intended to be per-scan SaaS + service contracts with US health systems.
  • FDA 510(k) clearance (4 Sep 2025) for CT:VQ — first non-contrast V/Q imaging solution cleared in the US.

  • CMS reimbursement confirmed (3 Sep 2025) — CT:VQ mapped to Category III CPT codes 0721T/0722T with US$650.50 per scan, effective immediately. That gives hospitals a payment pathway.

  • Together, these de-risk US commercialization and explain the sharp price spike and new 52-week highs reported around that time.

  • June QTR Cash flow report: Revenue $1.6M | OCF -$9.5M | Cash on hand: $6.9M | No debt


Disclaimer: This information is provided purely for educational purposes. It takes no account of an individual’s personal financial circumstances and hence can in no way constitute financial advice. The above data may be subject to errors or inconsistencies for which the author takes no liability. It is imperative that all investors do their own research or if they need advice, seek it from a qualified financial adviser.

FY25 Results Season Performances

Presentation: When Do I Sell?

In this presentation — When Do I Sell? — I explore why selling is the hardest part of investing. We’ll look at the many reasons investors sell, the common pitfalls we’ve all fallen into, and then I’ll share the framework I use today. I support this with recent examples of stocks I’ve sold, and finish with a look at some of my current holdings and how I’m thinking about potential exit points.

1. Introduction

  • Selling is the hardest decision in investing.

  • Paper trading can’t capture the psychology.

  • Biases: anchoring to entry, waiting for breakeven, falling in love with a story.

  • My biggest past issue: cutting winners too soon.

    • Improved by using a framework + building skill at buying back in when I’ve sold too early.

It’s not about winning every hand. It’s about stacking probabilities. Fold when odds aren’t in your favour and wait for the better hand.


2. Reasons People Sell

(broad, neutral list — not judged, meant to spark recognition)

  • Technical breakdown

    • Falling through support or resistance levels.

    • Overbought / oversold indicators.

    • Moving average crossovers (general).

    • Breakdown of a clear trend.

  • Change in investment thesis

    • Fundamentals shift.

    • Earnings downgrades. 

    • Significant earnings misses.

  • Portfolio reshaping

    • Selling weaker positions to fund higher conviction opportunities.

    • Rebalancing for risk control.

  • Market-driven selling

    • Fear of crashes, recessions, geopolitical shocks.

  • Personal reasons

    • Tax planning.

    • Liquidity needs.

  • Behavioural reasons

    • Chasing another idea.

    • Boredom / story fatigue.

    • Overconfidence in calling tops.

  • Profit-taking

    • Locking in gains.

“You never go broke taking a profit” — first heard this from Rene Rivkin as one of his rules. I’ve come to realise thinking like this cost me a lot of money as it often means cutting winners too soon.

  • Capitulation

    • Selling because you just can’t bear the pain anymore.

This last one, capitulation, is where we cross into pitfalls. When selling shifts from disciplined to emotional.


3. Pitfalls

  • Anchoring to entry price.

  • Waiting for breakeven.

  • Selling too soon (my biggest past issue) – happy with a quick profit.

  • Falling in love with a story/company.

  • Not admitting you’re wrong quickly (and refusing to buy back in).


4. My Framework

  • Multi-period analysis (monthly, weekly, daily alignment).

  • 3EMA crossovers — my consistent technical signal.

  • Fundamental triggers:

    • Change in investment thesis (downgrades/misses).

    • Selling weaker positions to fund stronger conviction ideas.

  • Other indicators I’ve trialled but don’t rely on now:

    • ATR trailing stops.

    • % fall rules.

    • Dollar-loss limits (% of portfolio).


5. Case Studies – some recent sells

BUB

  • Trigger: Technical weakness led to sell and recent unexplained CEO change added risk.

  • Outcome: Stock has slowly continued to trend lower.

  • Lesson: A stricter application of my rules would have captured more profit.

MXO

  • Trigger: Cross of 10 and 21 day EMA.
  • Outcome: Stock has slowly continued to trend lower.
  • Lesson: A stricter application of my rules would have captured more profit.

XRO

  • Trigger: An acquisition that I perceived to be high risk / capital raise putting pressure on the share price / weakening technical picture.
  • Outcome: Stock has continued to trend lower.
  • Lesson: Application of my methodology has saved me from being stuck in falling stock in a rising market.

PME

  • Trigger: change of trend, moving averages crossing below one another.
  • Outcome: stock fell for a few weeks after only to start a new uptrend just above $200
  • Lesson: No regrets. Followed the process which saved me from some sleepless nights for a few weeks. I was aware when the trend turned favourable again and chose not to buy back in having moved on an invested elsewhere.

MRE

Trigger: Conversation with an ASA member that I highly respect

Outcome: I sold but should have done so much sooner

Lesson: Don’t allow my biases to blur my judgement!


6. Portfolio walk-through – when would I sell?

A change in fundamentals – ie shifting from increasing profits to falling profits, a significant fall in earnings, a poorly justified change in leadership or a significant acquisition that I perceive changes the risk profile of the business.

  • DVP – close below 21 day EMA

  • GDG | ZIP | VYS | GNP | CGS | SRV | KYP | TEA  – 10 day EMA crosses below 21 day EMA.
  • RMD – 10 day EMA crosses below 125 day EMA

  • CCL | FWD – have held through a 10 day cross of the 21 day EMA but would likely sell if it happened again to protect profits but would depend when it occurred.
  • SRV → Sold, then re-entered lower.


7. Wrap-Up

Selling is the hardest decision. There are many reasons investors sell — some rational, others emotional traps. My journey has been about moving from cutting winners too early to developing a more disciplined framework. I’m now better at cutting losers, holding winners, and buying back in when I’ve sold too soon. In the end, it’s about consistency and discipline: stacking the odds like in poker, and living to play the next hand.

Over time, consistency and discipline beat emotion.


8. Group Discussion

Prompts:

  • What’s your biggest struggle with selling?

  • Do you recognise yourself in any of these reasons or pitfalls?

  • Do you set sell rules before you buy?

  • Do you buy back in if you think you’ve sold too early?

  • What’s been your best or worst sell?

  • Looking ahead: how do you plan to improve your selling discipline?


Disclaimer: This information is provided purely for educational purposes. It takes no account of an individual’s personal financial circumstances and hence can in no way constitute financial advice. The above data may be subject to errors or inconsistencies for which the author takes no liability. It is imperative that all investors do their own research or if they need advice, seek it from a qualified financial adviser.

Presentation: When Do I Sell?