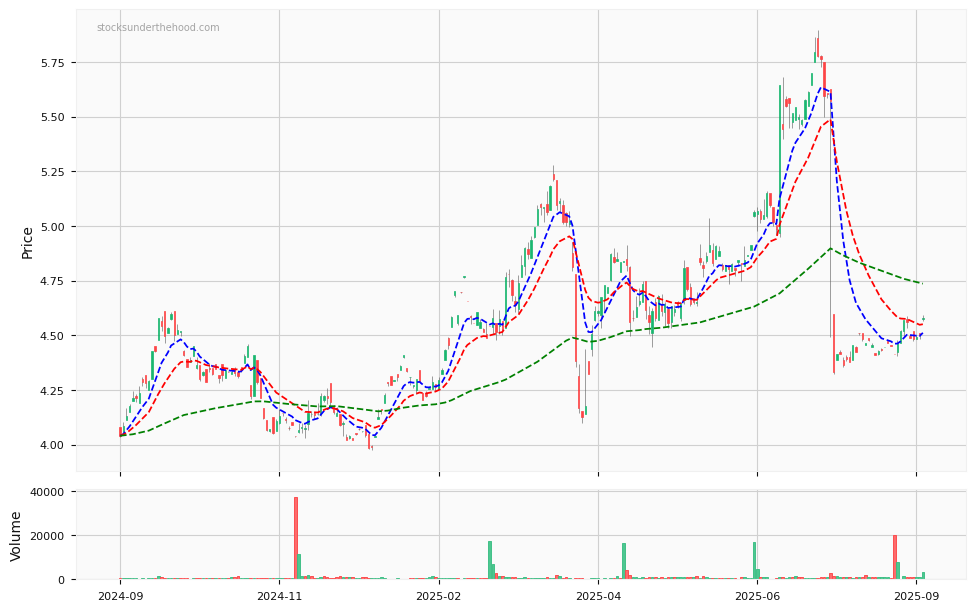
Copper Price in USD
Copper Miners ETF (WIRE)
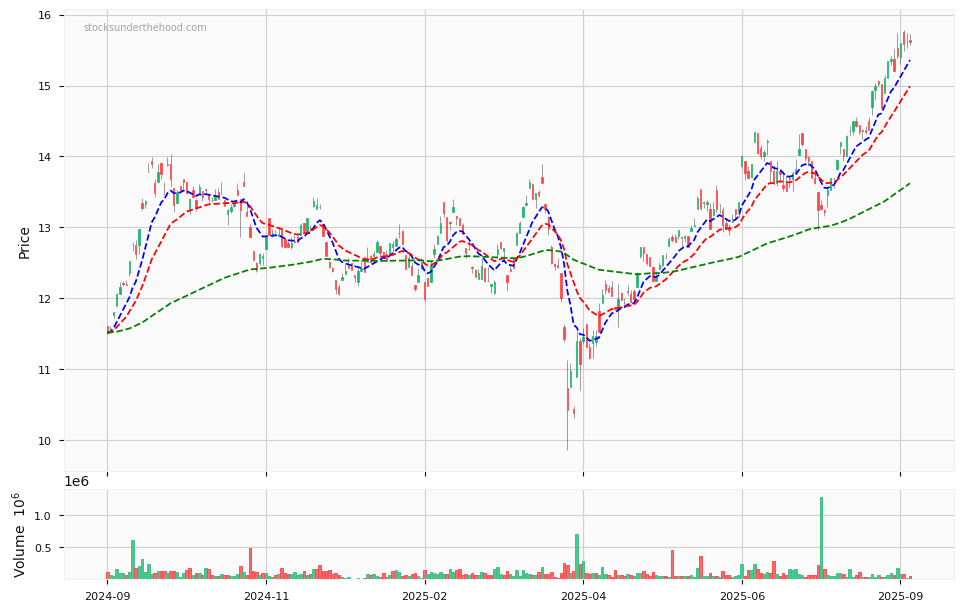
Copper price, Copper Miners ETF price and some price charts of the most popular Copper stocks listed on the ASX.
Copper price, Copper Miners ETF price and some price charts of the most popular Copper stocks listed on the ASX.
This is a restricted members post.
This is a restricted members post.
Why Did ASX:SKS Fall On Great Results? Let’s have a look at what I think may be the reason.
This is the 5 minute chart for SKS Technologies yesterday:
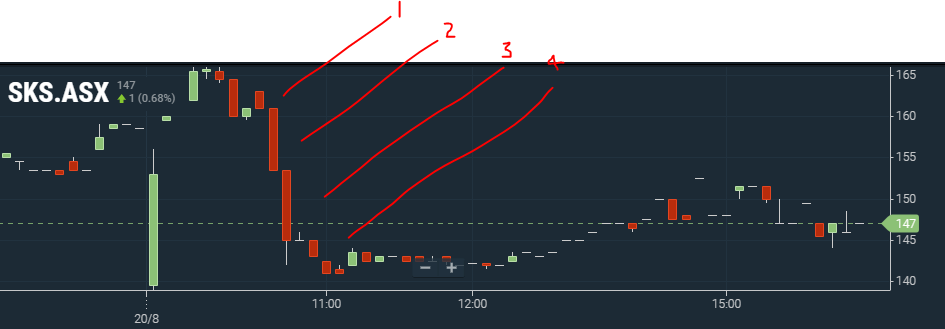
Prior to that the shares were up on what appeared to be a very strong result.
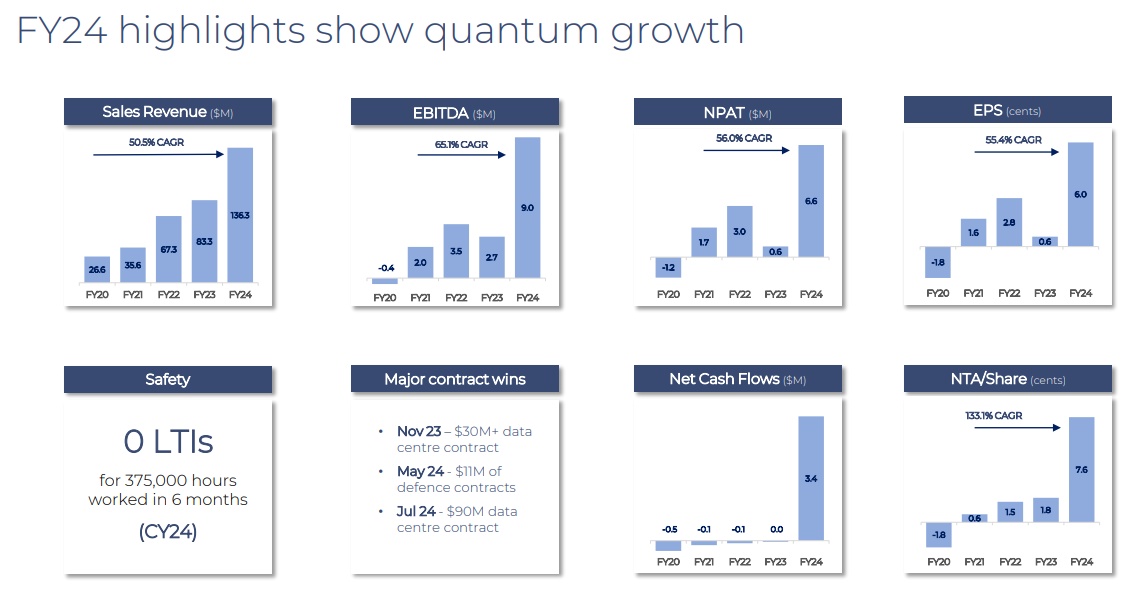
Strong growth, recent contract wins, profitability, and even a dividend highlight the positive outlook for the company.
It seems the share price decline coincided with the company’s earnings call at 10:30 am. Around 10:45 am, the CEO mentioned receiving interest from brokers about conducting a capital raise. It appears that some investors, who may have missed earlier developments, now want to buy in at a discount. Unfortunately, the CEO’s consideration of these options has likely prompted some shareholders to sell.
On a positive note, the stock recovered some of the day’s losses, perhaps as more investors understood the reason for the initial sell-off.
Overall, the company’s fundamentals remain strong, but the market has been unsettled by the potential for a capital raise.
Disclaimer: This information is provided purely for educational purposes. It takes no account of an individual’s personal financial circumstances and hence can in no way constitute financial advice. The above data may be subject to errors or inconsistencies for which the author takes no liability. It is imperative that all investors do their own research or if they need advice, seek it from a qualified financial adviser.
Why Did ASX:SKS Fall On Great Results?
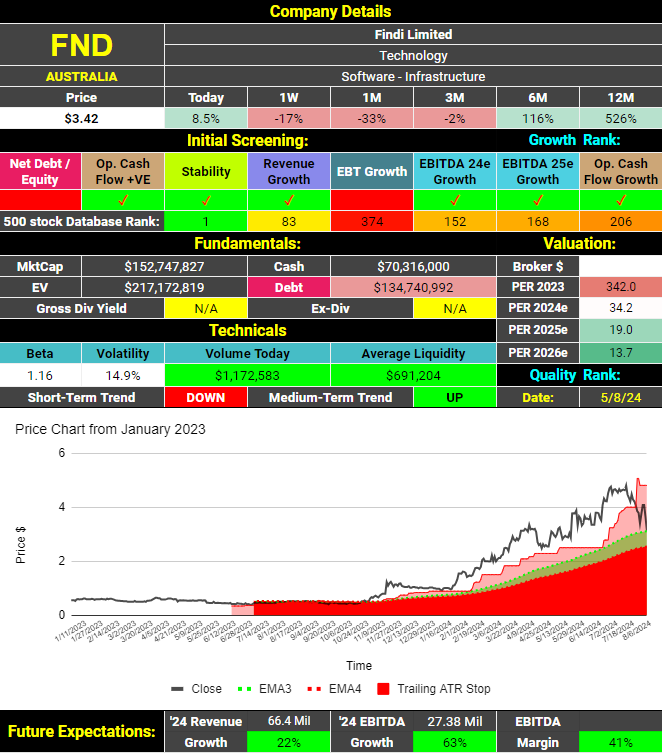
The latest report shows an increase in operating cash flows and revenues on a trailing 12-month basis. The company maintains a strong cash position and chooses to reinvest in the business rather than paying dividends. Analysts forecast EBITDA growth for 2025, although at a more moderate level compared to 2024. The stock currently has a P/E ratio of 34, which isn’t cheap, but strong growth is anticipated. This suggests that the valuation could improve significantly over the next couple of years.
Technically, the medium-term price trend remains upward, though the short-term trend has recently turned negative. Despite a decline of over 33% in the past month, the shares are still up an impressive 526% compared to 12 months ago. The only notable downside is that the company failed to increase earnings before tax and abnormal items in the last report.
Findi listed on the ASX in 2007 as Vortiv and rebranded on August 24, 2022.
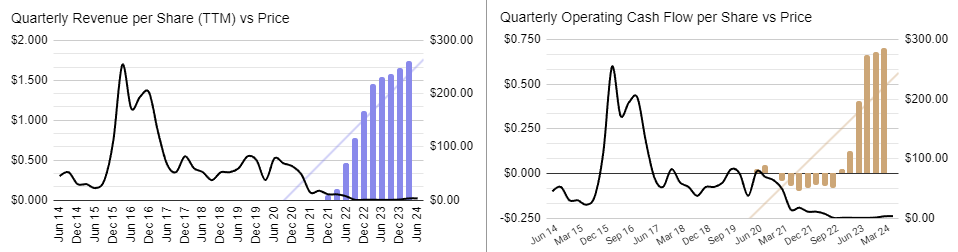
Since the rebranding, revenues and operating cash flows have shown steady and consistent growth.
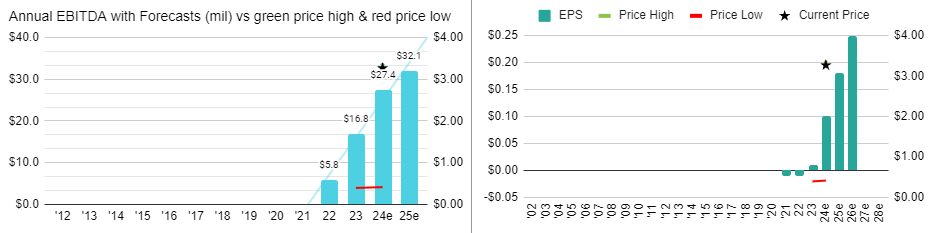
Likewise, EBITDA and Earnings Per Share (EPS) have been increasing and are forecast to continue to do so.
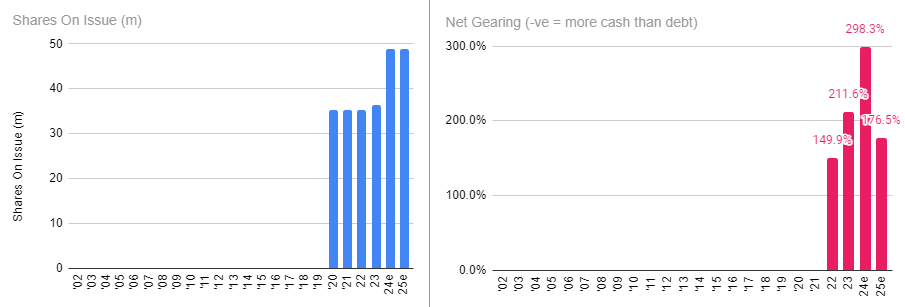
The company has financed its expansion through a mix of cash flows, equity, and debt. Shareholders have experienced significant dilution more recently mainly due to the conversion of options.
Findi (ASX:FND) does not feature at all on the ASX list of most shorted stocks. With a market cap of only ~$150M, it’s too small.
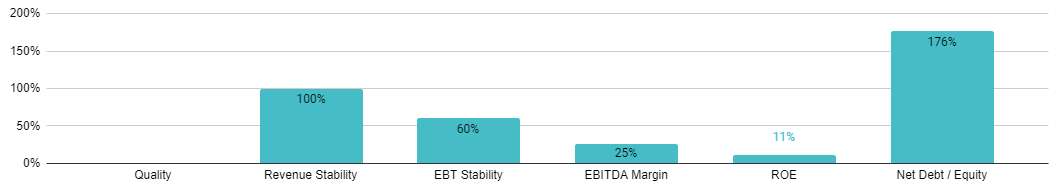
So far revenues have increased every time since the company changed its name to Findi. Earning before tax and abnormal items have been more inconsistent. Margins and return on equity (ROE) are acceptable and, more importantly, improving. The company is funding some of its expansion with debt but with positive cash flows and a healthy cash balance, this is of no concern at this time. Overall, Findi is an emerging company that could currently be classified as medium quality. However, if its current trajectory continues, it could be considered high quality in the coming years.
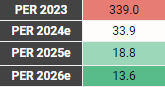
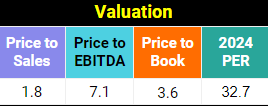 All of these metrics look reasonable for an emerging growth company. Based on analyst projections, the price-to-earnings ratio (PER) is expected to fall below 20 next year and under 15 the following year. Of course a lot can happen between now and then and being a small company, there may only be one analyst covering it. I cannot apply my valuation model to Findi as it has not been listed long enough.
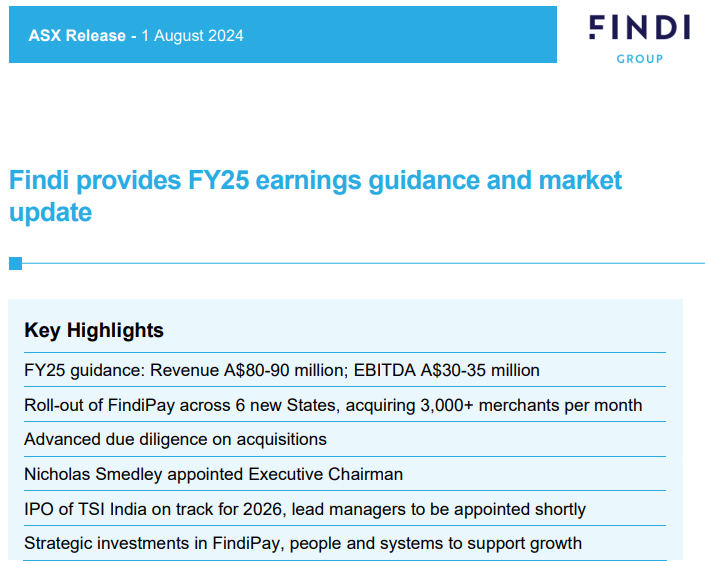
The company recently raised its revenue guidance while maintaining its EBITDA forecast. This suggests additional revenues may be allocated to expansion costs. The upcoming Indian IPO offers potential benefits and risks. It could lead to shareholder dilution but might also result in a higher valuation multiple. The success of the IPO will depend on the prevailing conditions in the Indian stock market. While the market has been buoyant recently, conditions could change.
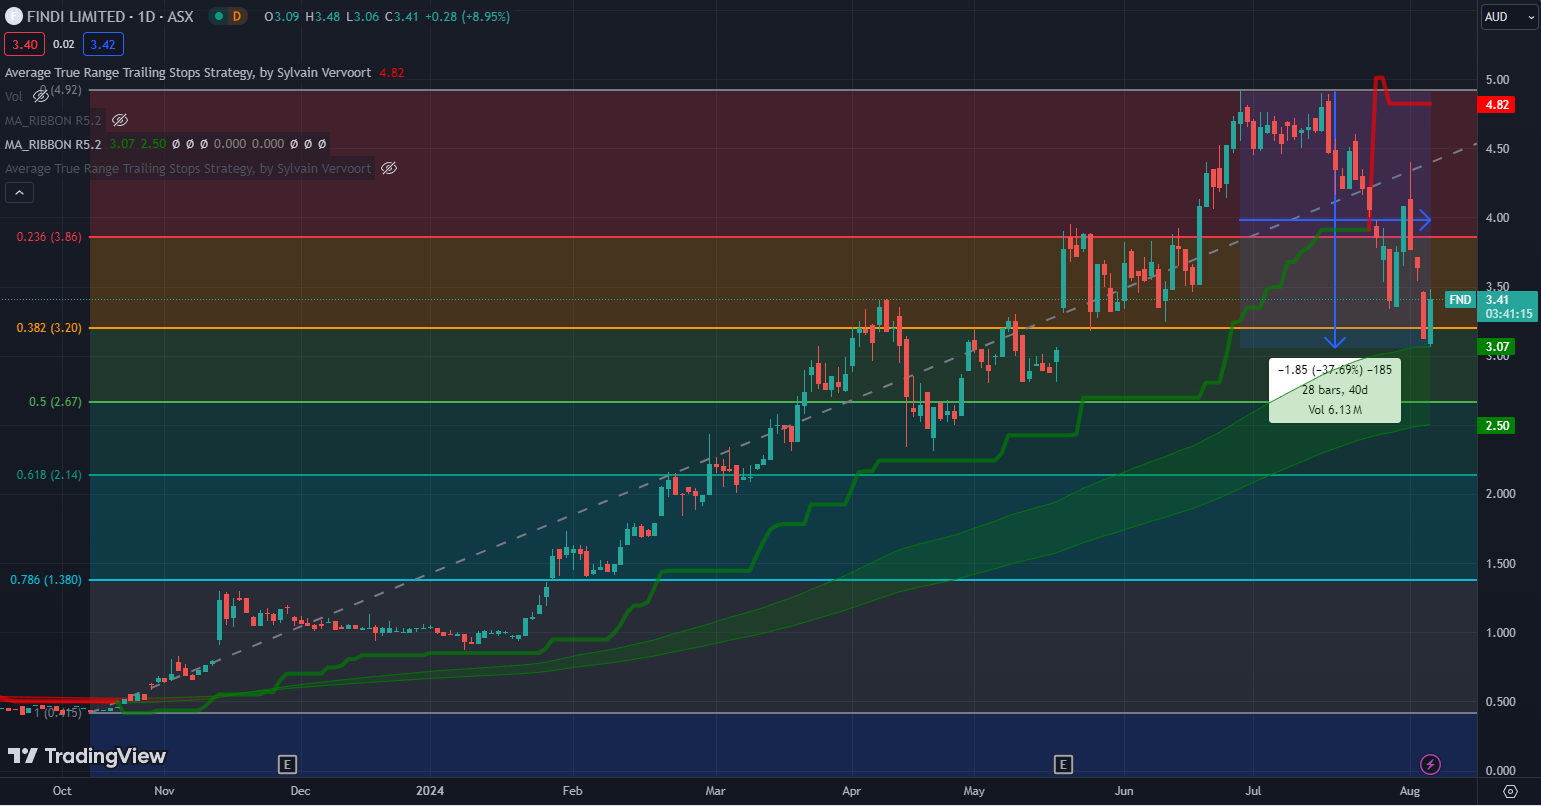
Findi’s share price rose significantly from October 2023 to July 2024. However, it has since fallen 37% over 39 days. The short-term uptrend has paused, with the share price recently finding support around $3.20. This level aligns with the 38.2% Fibonacci retracement level. Investors will hope for a bounce and a move back toward the $3.86 level. If this support fails, the next level to watch is $2.67, which aligns with the 50% retracement level. The medium-term uptrend remains intact for now.
Findi Limited (ASX: FND) has strategically shifted its focus to Indian operations, particularly through its substantial stake in TSI India. The company’s consistent growth in revenues, operating cash flows, and earnings demonstrates a strong upward trajectory, despite some shareholder dilution from increased equity. With a P/E ratio expected to drop below 20 next year, the market may not yet fully appreciate Findi’s growth potential. The recent 37% decline in share price has brought the stock to a more attractive valuation level, potentially offering an entry point for investors confident in the company’s long-term prospects.
The upcoming Indian IPO represents a pivotal moment for Findi, presenting both opportunities and risks. A successful IPO could unlock a higher valuation multiple and provide additional capital for expansion, though it also carries the potential for shareholder dilution and the effects of market volatility in India. Overall, while Findi faces some near-term uncertainties, its strong financial foundation and strategic focus on the high-growth Indian e-transactions and payments market position it well for future success. The growth outlook for this emerging fintech company remains promising.
If you’re an active investor or would like to become one, Stocks Under The Hood is your ideal companion. I provide a wealth of educational resources, including detailed company dashboards, in-depth reports, and model portfolios. My goal is to help you cut through market noise with clear, actionable insights and educational content, empowering you to make informed investment decisions. With a strategic, growth-focused approach, I guide you toward the best opportunities in the market.
A FREE 14 Day TRIAL is available enabling you full access to the site (just provide your name and email address – no credit card is required). You will then be able to view all of the Stock Reports, Company Dashboards, and two Model Portfolios. ALSO, request ONE STOCK OF YOUR CHOICE from the Australian or US market and I will do a full stock report for you.

Disclaimer: This information is provided purely for educational purposes. It takes no account of an individual’s personal financial circumstances and hence can in no way constitute financial advice. The above data may be subject to errors or inconsistencies for which the author takes no liability. It is imperative that all investors do their own research or if they need advice, seek it from a qualified financial adviser.
Findi (ASX:FND) Analysis
This is a restricted members post.
This is a restricted members post.
This is a restricted members post.
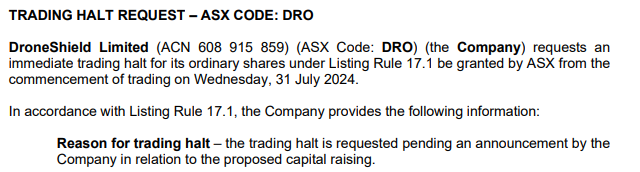
This morning, I was surprised to see that Droneshield ASX:DRO shares were suspended pending another capital raise. This is particularly interesting since they only completed a raising of $115M in April, just 3 months ago. This comprised of a $100M placement and $15M SPP at 80c. At last report, they had $145M cash in the bank with no debt.
This is not the first time this company has surprised me. As a previous shareholder and someone who knows people that own or have owned shares in the company, I have continued to keep a close eye on them. I thought I’d take a few minutes to share some observations.
This was where it all began for me with Droneshield ASX:DRO. I bought shares in them on this day, on the back of this announcement. What a quarter! I was confident this would bring a lot more attention to this company even if it was possible that this was just a one-off. If it wasn’t just a one-off, then this company had incredible potential, possibly for many years to come.
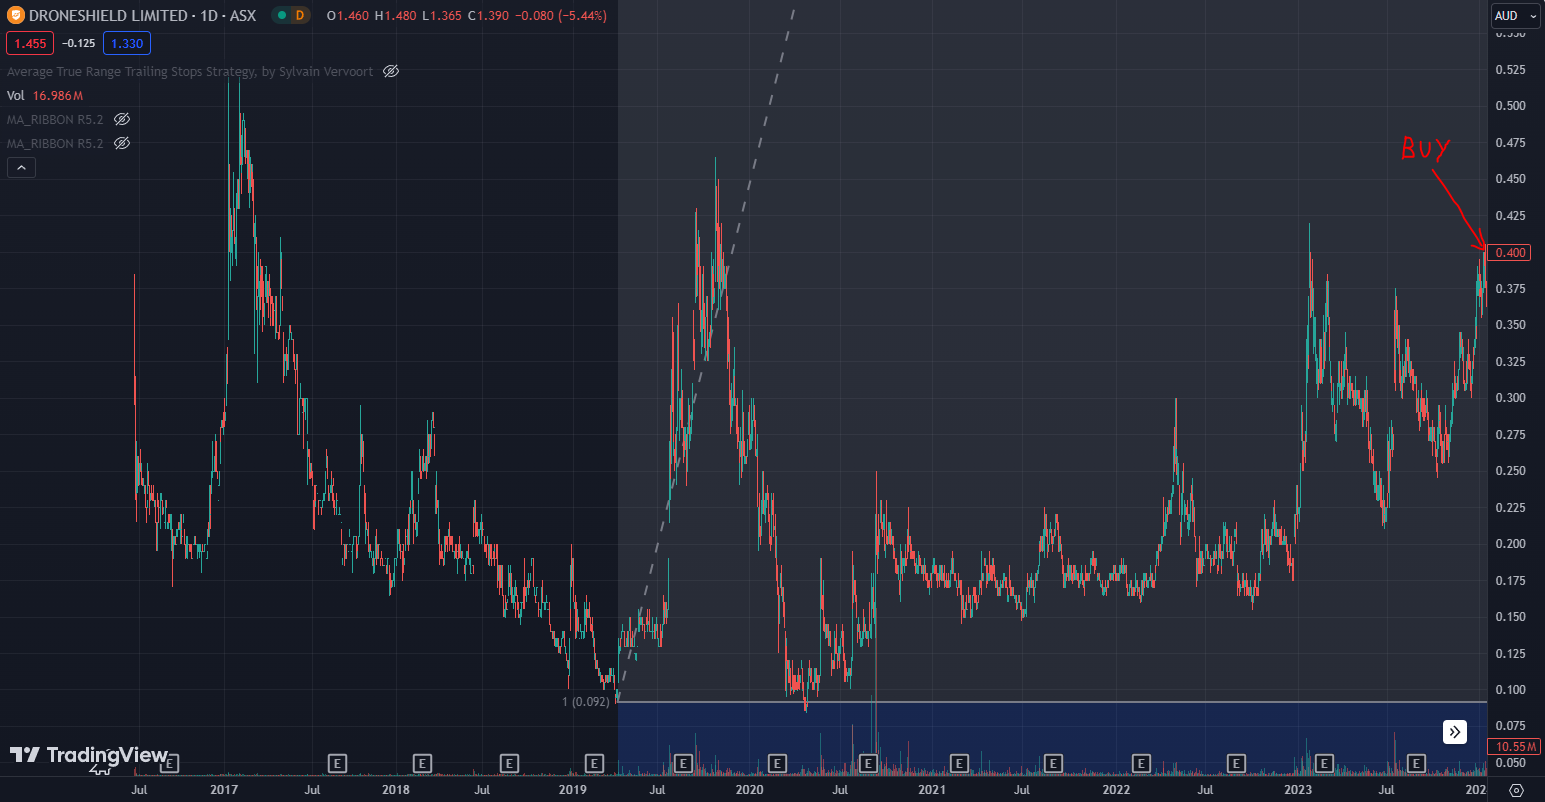
The shares had been listed for some time prior and had been an inconsistent performer. Leading into that result though, the shares had already been on the move again. Clearly, the situation in Ukraine had started to gain them some attention.
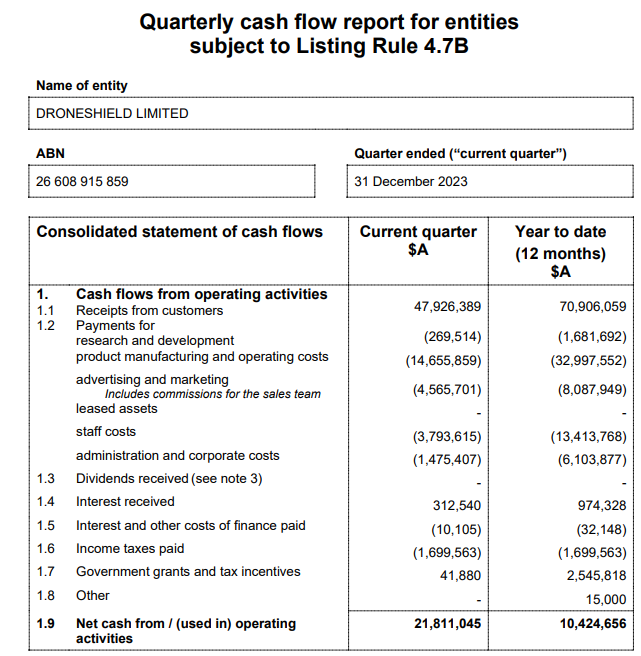
For context, this is their history of operating cash flows prior to this result:

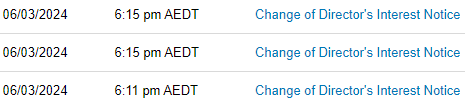
Two of the three directors sold all of their shares, retaining only performance options. Over $15M worth of shares were sold between Feb 29 and March 5th. Pretty easy to see when they did it. It wasn’t subtle!
They announced their sale after the market closed on the 6th when the shares had closed at 69.5c. The market saw this announcement as negative (as did I) and the shares closed at 59.5c the following day. I’m sure some would have interpreted this as a sign that the March quarterly report would not be anywhere near as strong as the December one. I nervously continued to hold.

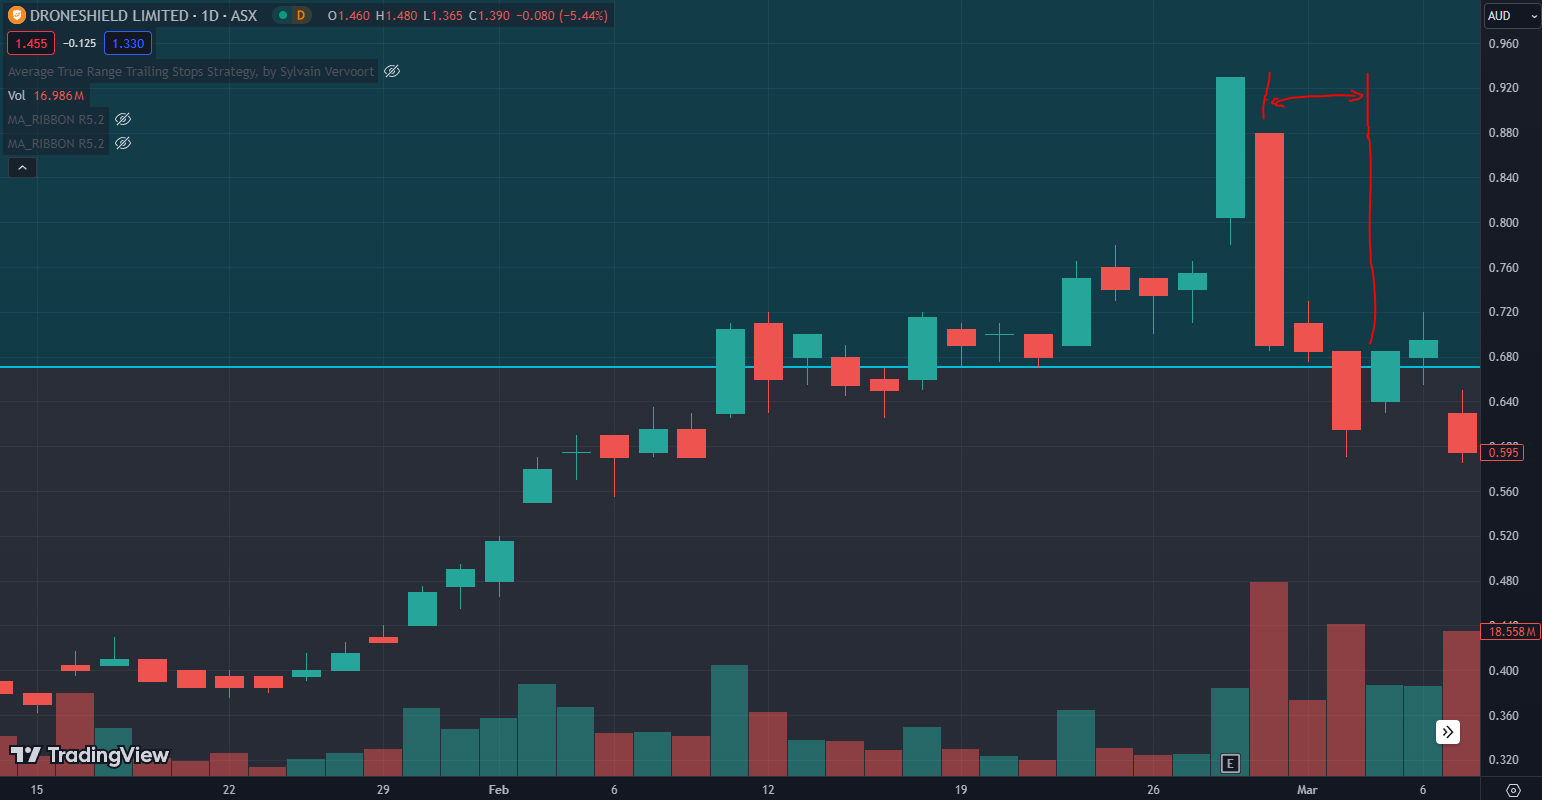
Yuck! I sell my shares on this day. As I had suspected, December was likely just a perfect storm and the directors selling was certainly a signal that something like this was to come.
However, history shows that I got this wrong. The directors claimed that timing was the main factor for the poor result and that a better outcome could be expected in the next quarter. The market so wanted to believe the story and so it wasn’t over yet.
On the back of continued share price strength, it is announced that the company would be conducting a large capital raise at 80c. Interestingly, only the single director who retained some of his shares participated in the SPP acquiring around $12,000 worth of shares.
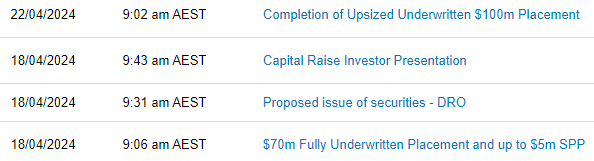
The capital raise slowed the progress of the share price through the month of May. However, the shares really got going again, right through until July 17.
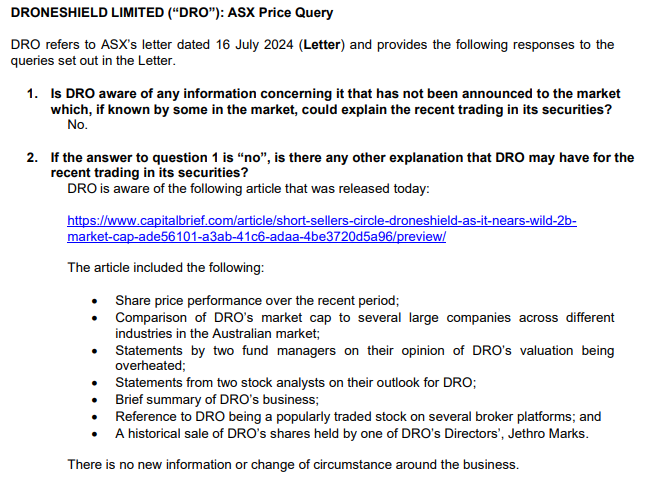
To me the board did nothing to refute the claims in the article because their prior actions suggest that they agreed with it.
All of these are things you do when you believe the shares are overvalued. Don’t take any of that as a criticism. I much prefer boards that raise funds on their terms (when the shares are up) than boards that do it out of desperation (when the shares are down).
The article certainly spooked the market.

I won’t reproduce the report here but will just show you the operating cash flow outcome. That great December quarter has been followed up with the two biggest outflow quarters since I’ve been following them.
In 2 weeks the stock has lost half of its value. A $2B company is now worth $1B. With the stock in free-fall the board has decided to try and grab some more cash while they can. It will be interesting to see if they participate this time.
I remain intrigued about where this story goes next for Droneshield ASX:DRO. Stay tuned!
If you’re an active investor or would like to become one, Stocks Under The Hood is your ideal companion. I provide a wealth of educational resources, including detailed company dashboards, in-depth reports, and model portfolios. My goal is to help you cut through market noise with clear, actionable insights and educational content, empowering you to make informed investment decisions. With a strategic, growth-focused approach, I guide you toward the best opportunities in the market.
A FREE 14 Day TRIAL is available enabling you full access to the site (just provide your name and email address – no credit card is required). You will then be able to view all of the Stock Reports, Company Dashboards, and two Model Portfolios. ALSO, request ONE STOCK OF YOUR CHOICE from the Australian or US market and I will do a full stock report for you.
Disclaimer: This information is provided purely for educational purposes. It takes no account of an individual’s personal financial circumstances and hence can in no way constitute financial advice. The above data may be subject to errors or inconsistencies for which the author takes no liability. It is imperative that all investors do their own research or if they need advice, seek it from a qualified financial adviser.
Droneshield ASX:DRO – Another Capital Raising!
This is a restricted members post.
Reporting Season is underway, let’s have a look at some companies reporting today:
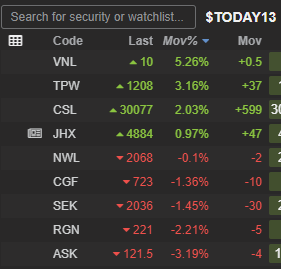
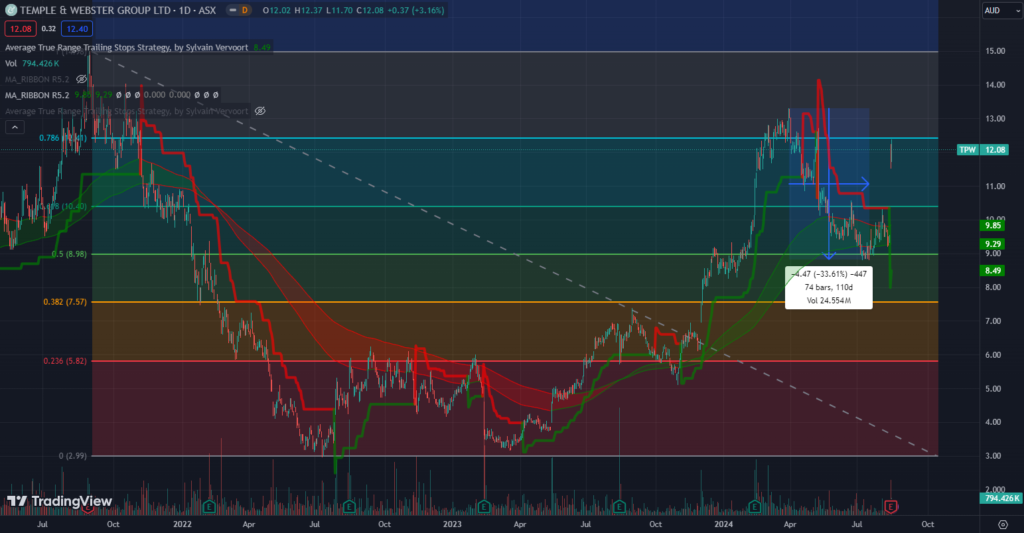
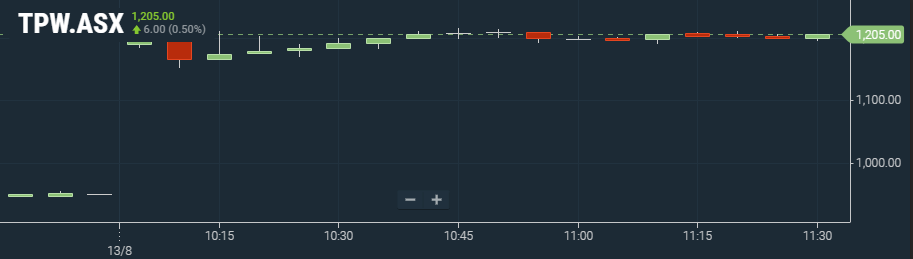
The big winner out of these stocks in Temple & Webster ASX:TPW. After a healthy 33.6% pull back, the share price is well and truly found its mojo once again.
Netwealth ASX:NWL is a great company that, not for the first time, fell short over very lofty market expectations. EBITDA still rose 23.8% which is still a great result and the company is confident that the momentum will continue.


The market is having an efficient day with no surprises here. Everything that should be up is up and everything that should be down is down.

https://abacusgroup.com.au/investor-centre/abacus-storage-king/
Beat
Wow, I never realised how much jargon they use in this sector. I haven’t looked at a property trust report for years but I would have thought it would have been one of the most straight forward reports to read but I was wrong. I’ve got to say I think it’s ridiculous. Anyway, from what I can decipher this looks like a slight beat. ($81.1M profit vs $79.8M expected).
https://www.challenger.com.au/
Beat
Net Profit Before Tax: $608M vs $594.5M (up 17% on last year)
EPS Normalised: 60.9c vs 56c (up 14% on last year)
A strong result for what’s normally a pretty steady company.

https://www.netwealth.com.au/web
Slight Miss
Total Income: $255.2M vs $258.1M expected (up 18.9% on last year)
EBITDA: $124.7M vs $127.5M expected (up 23.8% on last year)
It’s still a great result but the market had very high expectations with a PER of 58 based on this year’s profit.

Big Miss
Revenue: $1084.1M vs $1148.4M expected (down 6% for the year)
EBITDA: $468.9M vs 492.3M expected (down 14% for the year)
Yet another disappointing result for Seek. 2 years ago the share price was $36. Today they are just under $20. Did someone say LinkedIn?

https://www.templeandwebstergroup.com.au/Home/
Beat
Revenue: $498M vs 496.6M (up 26% for the year)
EBITDA: $13.1M vs $10.81M (down from $14.8M for the year but not mentioned in the result)
Easily the stock of the day. When I saw the result I thought about taking a position. It looked for a while before market open that they would open up around 6%. That soon jumped to 26% and needless to say Temple & Webster remains a stock I do not hold. JB Hi Fi reported a resilient result yesterday. Nick Scali’s result was also well received. Perhaps there a few other quality retailers that have not reported that could be worth a look at in anticipation of a better than expected result. AX1, SUL, LOV all off the top of my head. This could be results season where retailers shine not for being brilliant but for not being as bad as expected.
EBITDA is up around 22% on what was expected hence the price is up around the same amount hence why I was a keen buyer if I could get them for only a 6% rise!
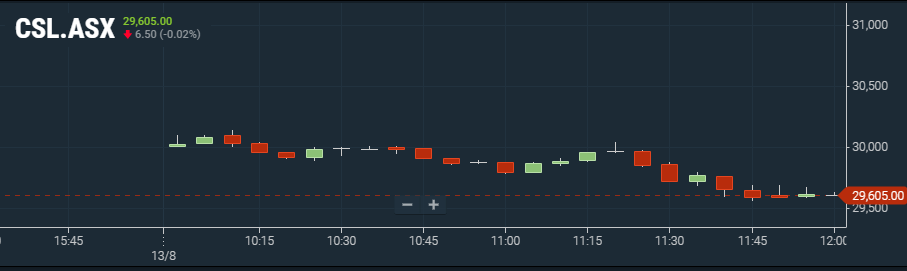
Slight Miss
Revenue $14.8B vs $14.687B (up 11% over last year)
Very confusing how they report their results for NPAT. My main takeaway is that they are forecasting growth of 10-13% for 2025 while the analysts seem to have been expecting 16%.
Main business of blood products (which when I last looked accounted for around 70% of revenues) is still humming along. The result isn’t good enough to dig deeper at this stage but needless to say the Vifor acquisition is looking more and more like a poor decision. I suspect CSL remains trapped in this sideways range for at least another 6 months now.
https://ir.jameshardie.com.au/
Slight Miss or even an In-line.
This company is going nowhere currently in terms of growth so I’m not going to delve into the result. It wasn’t bad under the circumstance but it’s just the wrong part of the cycle at the moment. The market didn’t like the result initially but the price has recovered somewhat.

Disclaimer: This information is provided purely for educational purposes. It takes no account of an individual’s personal financial circumstances and hence can in no way constitute financial advice. The above data may be subject to errors or inconsistencies for which the author takes no liability. It is imperative that all investors do their own research or if they need advice, seek it from a qualified financial adviser.
Reporting Season 13/08/2024 – Today I have a look at ASX:ASK, ASX:TPW, ASX:CFG, ASX:SEK, ASX:NWL, ASX:JHX & ASX:CSL.
Let’s have a quick look at some announcements from today.
These companies have reported quarterly cash flows or had significant announcements today. I will proceed to comment on a few that have caught my eye for one reason or another.
There were plenty of other stocks that are not on that list. A lot of them are garbage stocks that are nowhere near operating cash flow positive let alone profitable.
The standout quarterly report of the day and quite possibly their last since they have now achieved positive operating cash flows for the last 5 quarters and should no longer be required to do so.


It will be interesting to see where the share price finishes the day, but for now it’s looking like today’s result will see it break out of the range it has been trading in for most of this year.

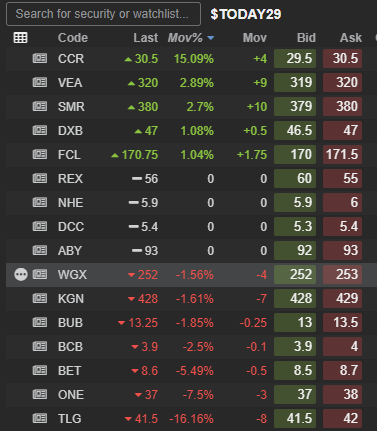
Not a stock I follow. When I saw this announcement my first thought was that perhaps they were going to receive a takeover bid. However, a quick google search suggests this won’t be a positive announcement.
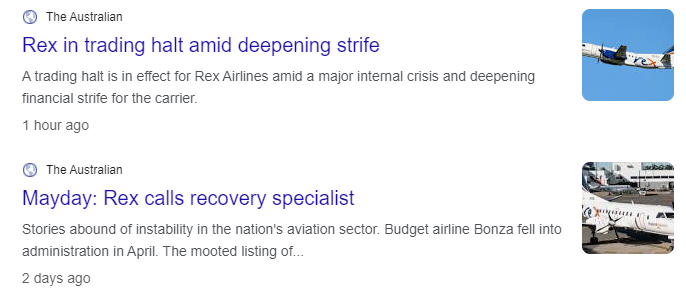
Airlines are notoriously terrible investments. QANTAS ASX:QAN is (was?) considered one of the best in the world even it has had to lean on the government for support at different times over the years.

The chart of this company has been flashing “RED ALERT” for some time now. Ultimately it is a sad day as the Australian consumer will be the loser if this airline is about to fall over.
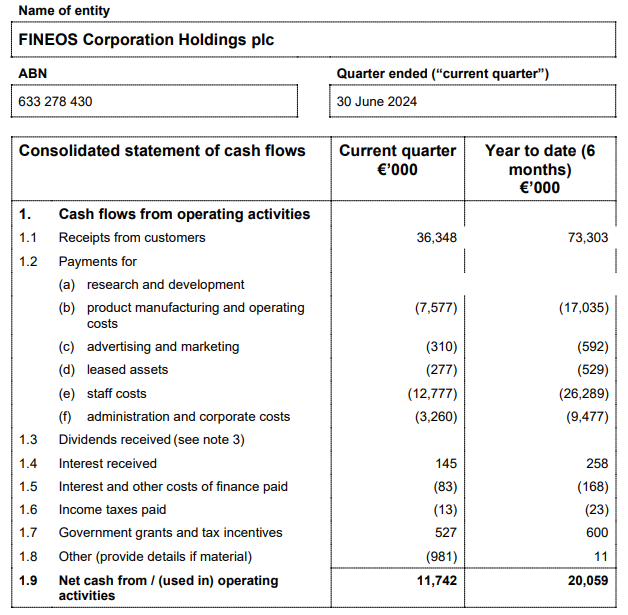
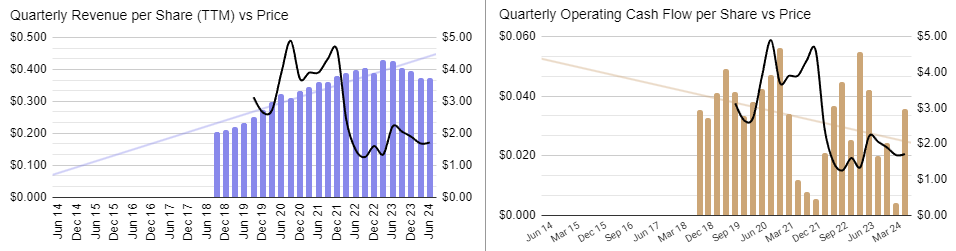
At face value, this looks to be a strong report for ASX:FCL. This company listed a while back now with a lot of hype surrounding it. The hype has proven to be unfounded.
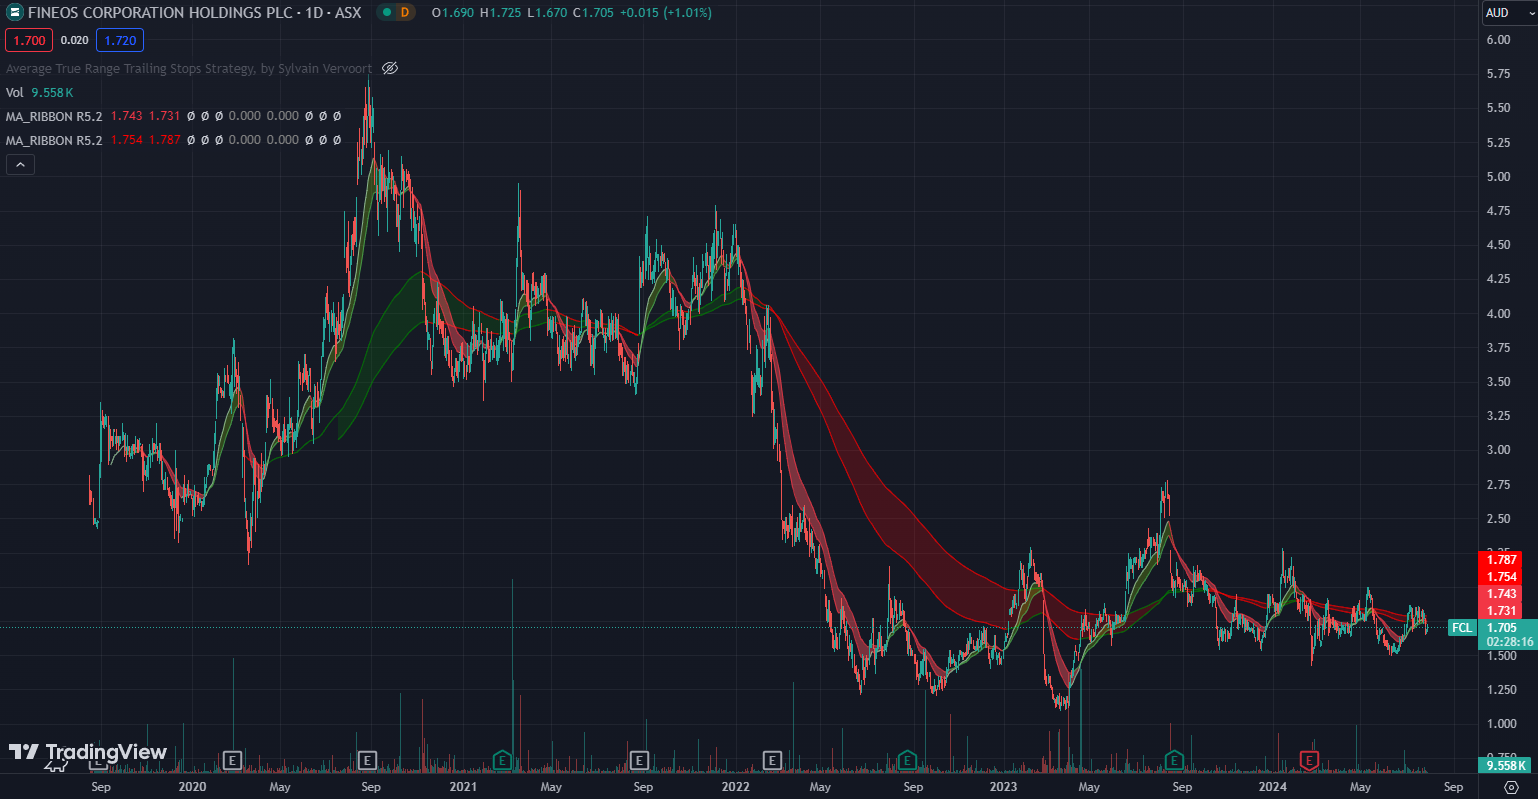
There is nothing wrong with this result except this company has provided reports like this in the past only to slap shareholders in the face the following quarter. It needs to string a few more of these together before I will give it further consideration.
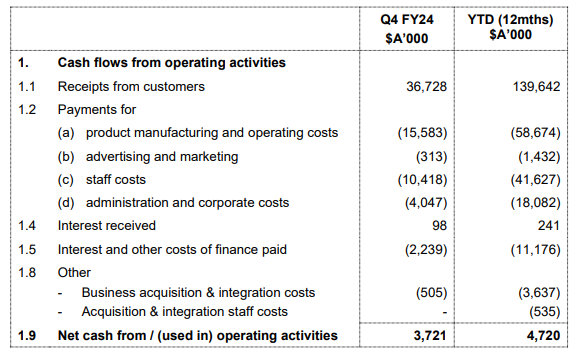
Another 4c stock that seems promising at first glance since operating losses continue to narrow. However, a major concern is the significant shareholder dilution. Although the revenue has increased compared to the previous period, it’s actually decreased on a per-share basis. This underscores the importance of always reviewing a company’s share issuance history. If and when this company becomes cash flow positive and profitable, the sheer number of shares outstanding means it will need substantial growth to generate meaningful returns for shareholders.

Doesn’t sound too bad. Often the commentary does.
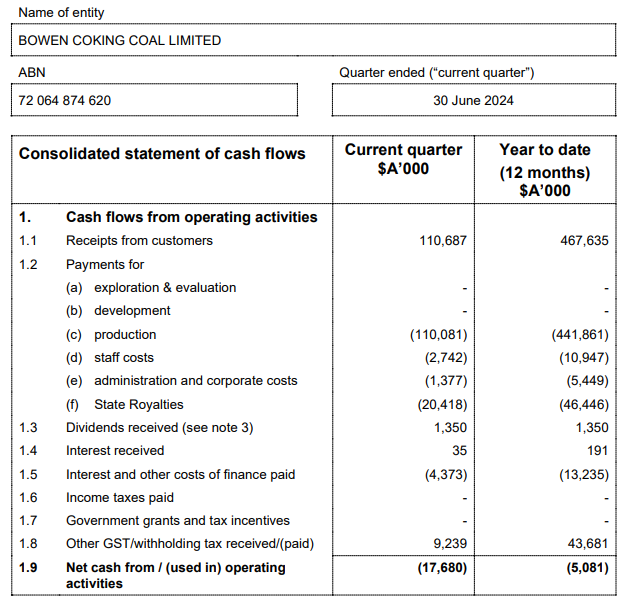
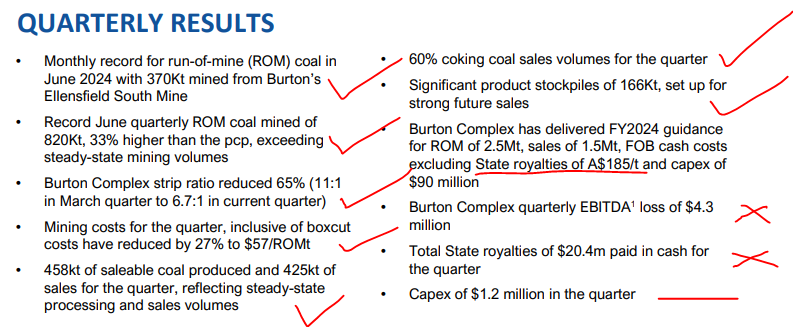
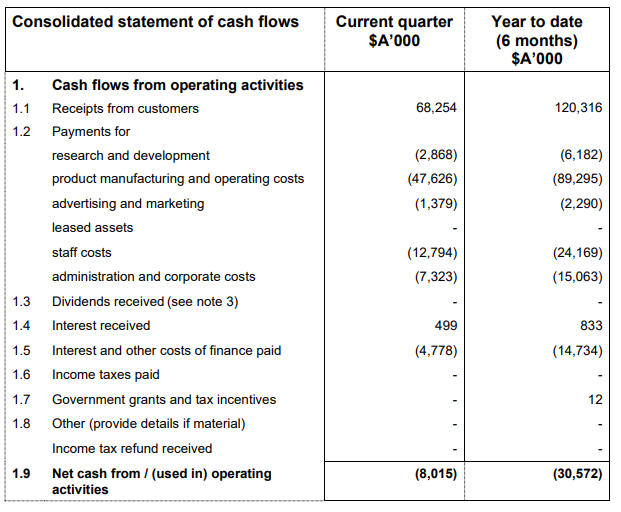
This is why I almost always ignore the commentary unless these numbers appeal to me first. Yuck! Cost of production was the same as receipts. Pretty unfair they have to pay $20M in QLD state royalties when they’re not even close to profitable.
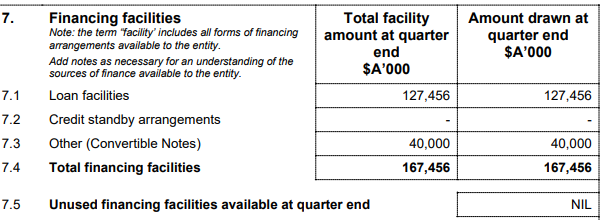
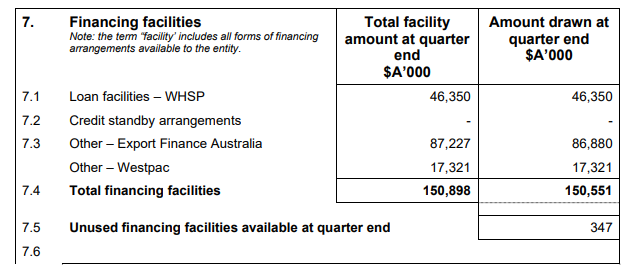
Oh dear, they’re in debt to their eyeballs too! Amazing to think I’ve seen this stock recently promoted as a spec buy by a very prominent stock broking house recently.
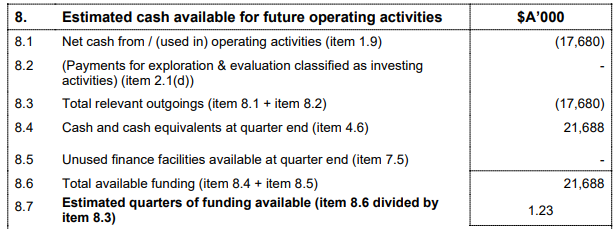
And for the trifecta, they’ve just about run out of cash.
I’ve heard a lot of commentary about coking coal vs thermal coal and how you want exposure to the former over the latter. This stock was proposed as one of the way to get that exposure. No thanks!
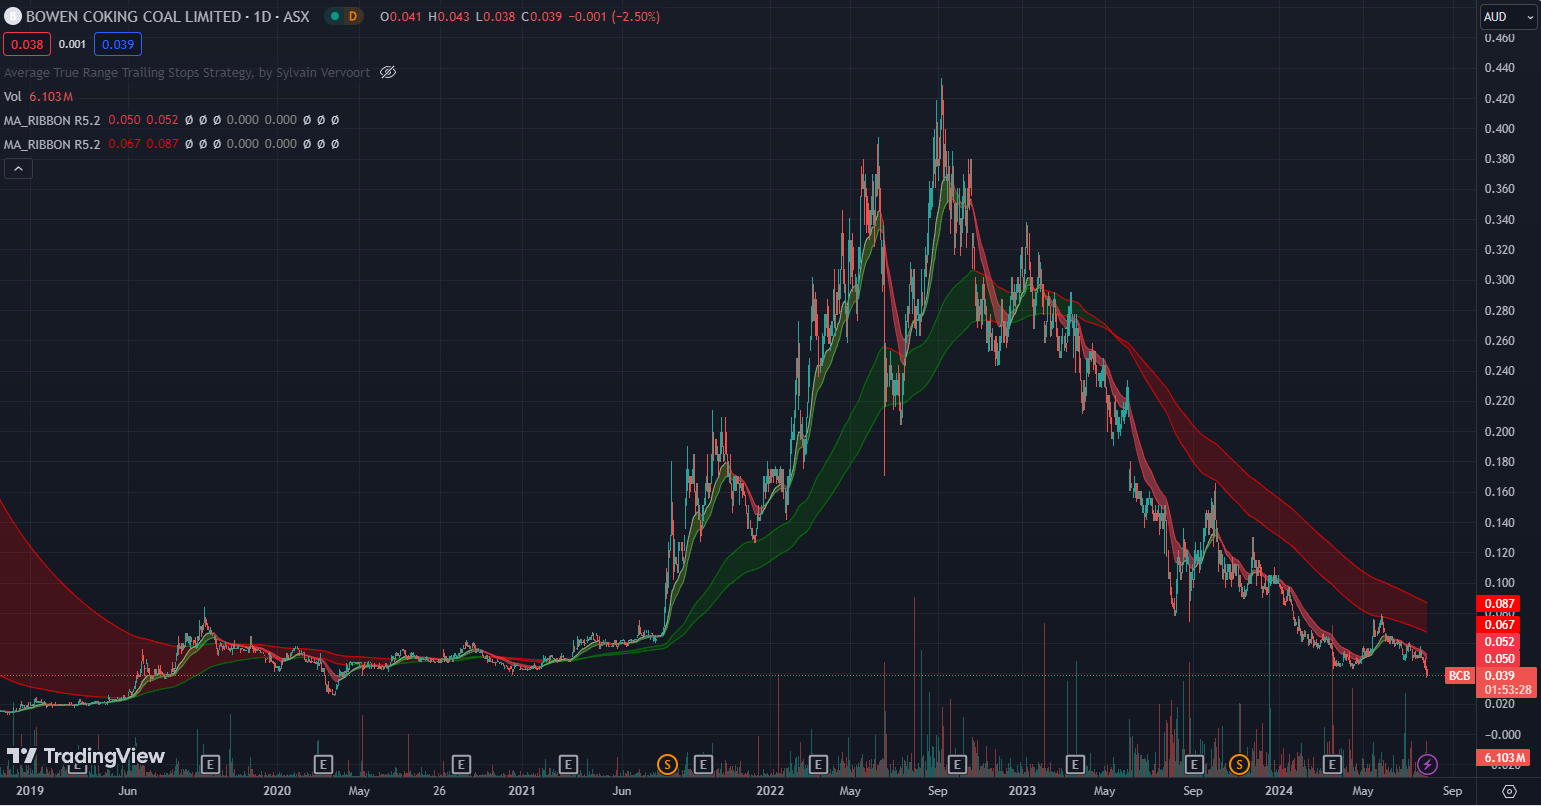
By the way, for what it’s worth, I don’t think either forms of coal and the stocks that give exposure to that are that enticing right now. For one they are highly cyclical so by definition can never be considered high quality. Ultimately ,they are producing something we need but it is bad for the environment. Lastly, they’ve never been great investments. Sure if you picked a few before Russia invaded Ukraine (which I did by the way but have since sold) then you will have done well. But before that yuck. Since then, some yuck, some ok. Going forward – why bother? Surely we can find better opportunities without the ups and downs of the cycle to worry about, with higher returns on equity that are actually contributing to the world in a positive manner?
Disclaimer: This information is provided purely for educational purposes. It takes no account of an individual’s personal financial circumstances and hence can in no way constitute financial advice. The above data may be subject to errors or inconsistencies for which the author takes no liability. It is imperative that all investors do their own research or if they need advice, seek it from a qualified financial adviser.
Announcements July 29
Let’s have a quick look at some announcements from today.
There are lot’s of moving parts with this one. The quarterly report is worth a read. Revenues are higher, debt has been reduced but positive cash flows remain elusive.
 After a huge fall, the company is trying to pick itself up off the floor. Sadly, they do require the current conflicts in the world to continue for their shareholders to prosper.
https://intelligentmonitoringgroup.com/
Positive cash flows again. Some one-off acquisition costs are in there too which improves the result further if stripped out. There’s been a lot of announcements from this company lately so there are not a lot of surprises in these numbers.
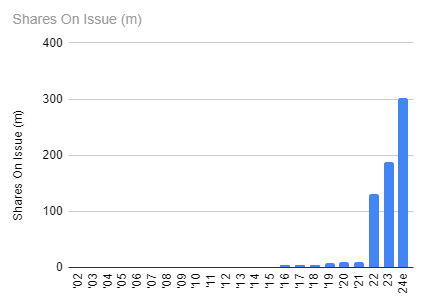
The results need to continue to be good though as the number of shares on issue have increased substantially for this company in recent times.
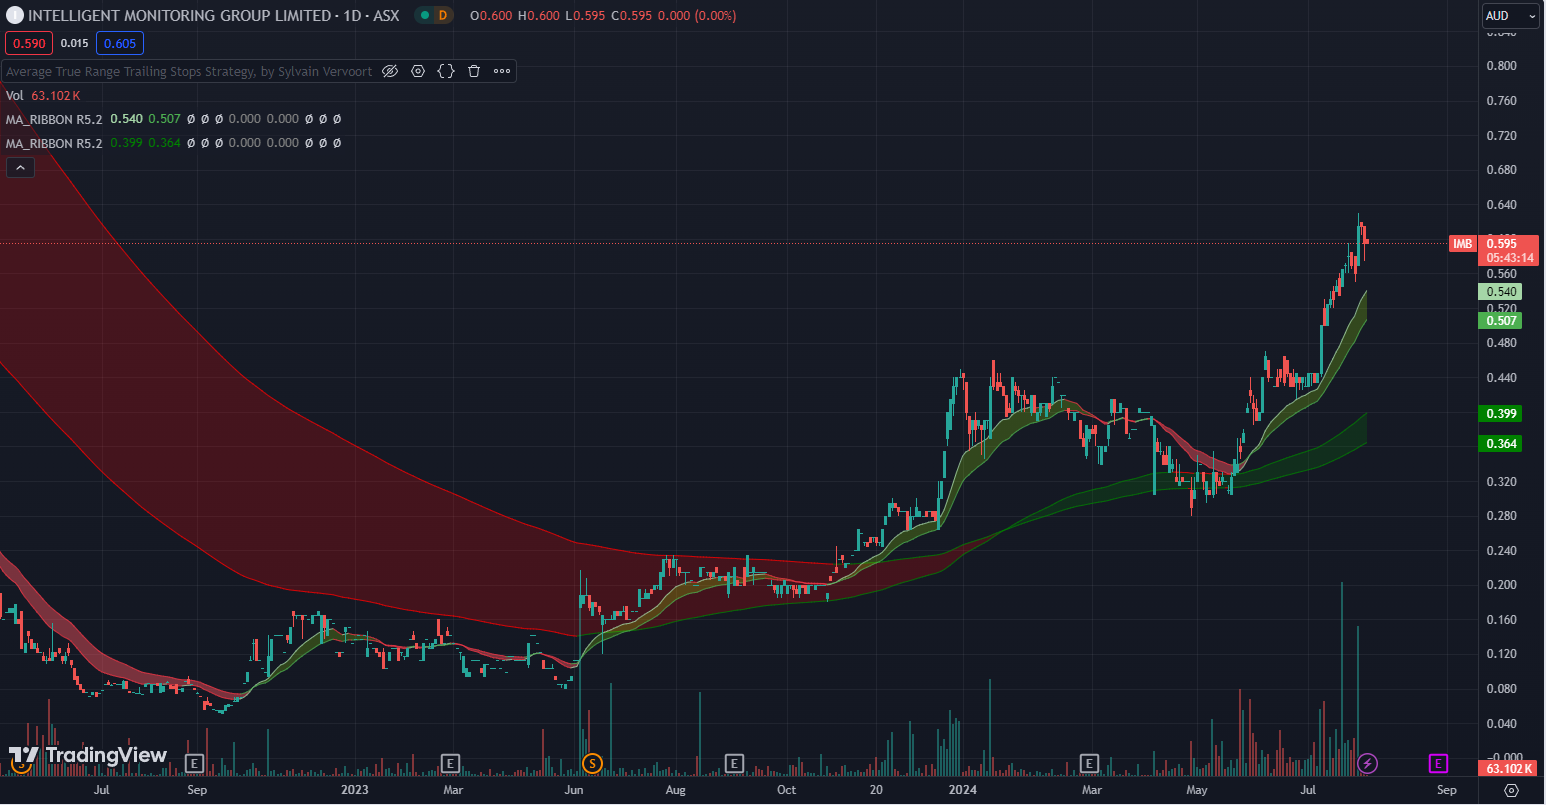
The stock continues to recover well.
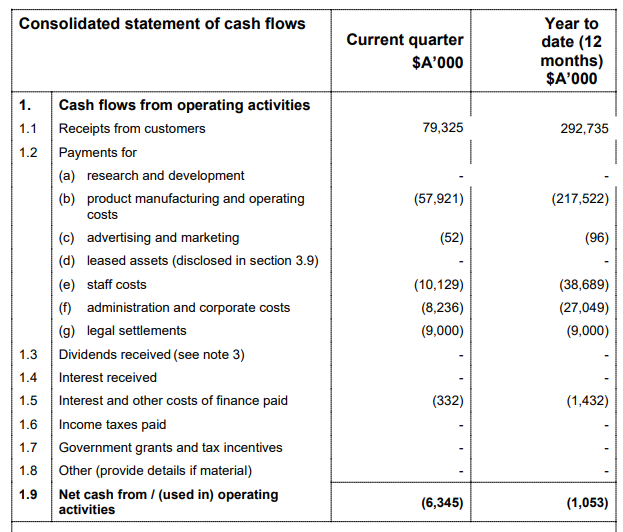
Disappointing result for this company at first glance with the negative cash flow result. However, at closer inspection revenue and I note the $9M legal settlement is a one off though so that can and should be ignored.
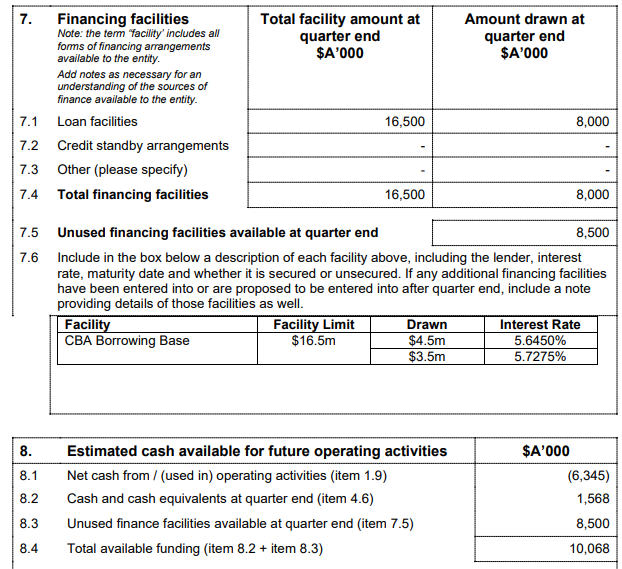
Not a lot of cash there with some debt used and some debt up their sleeve. I wouldn’t be surprised to see a capital raise but I’d have to look more closely to firm up my view.
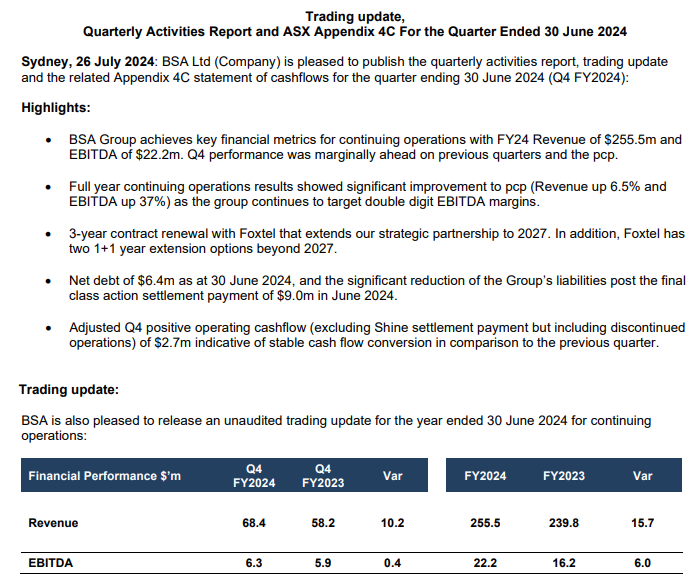
The company is positive overall and with the exclusion of the one-off legal expense, I can see why.
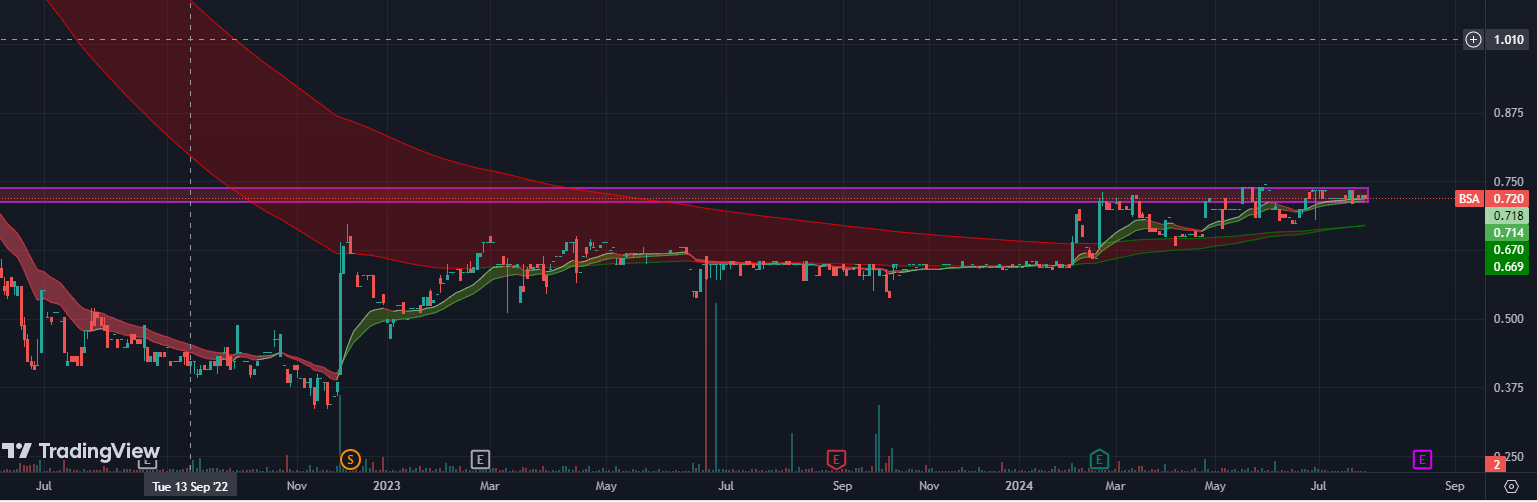
This is a recovery story with a lot of potential value still to be realised.
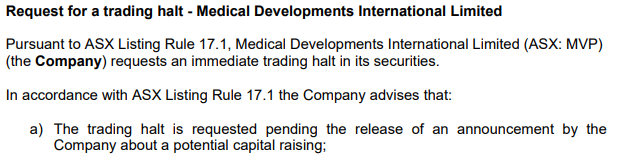
This company is once again asking investors to give them more money so they can set fire to it.
![]()
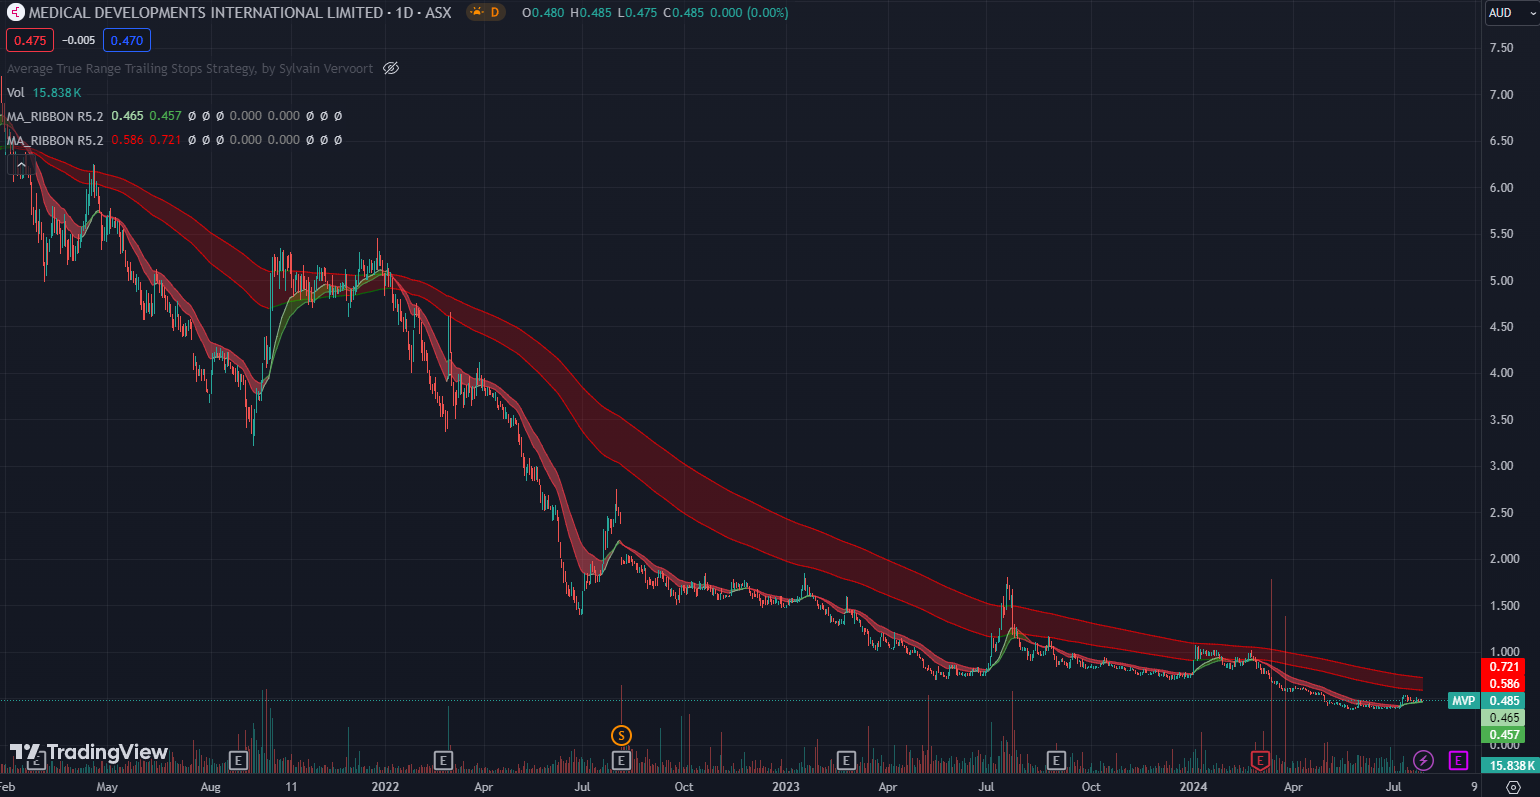
No comment required.
Good to see a company that’s actually operating cash flow positive. Nevertheless, both receipts and cash flows are lower than last quarter. This result isn’t worth closer inspection at this time.
Of all the stocks covered today, this one has the largest short position at 2.3%.
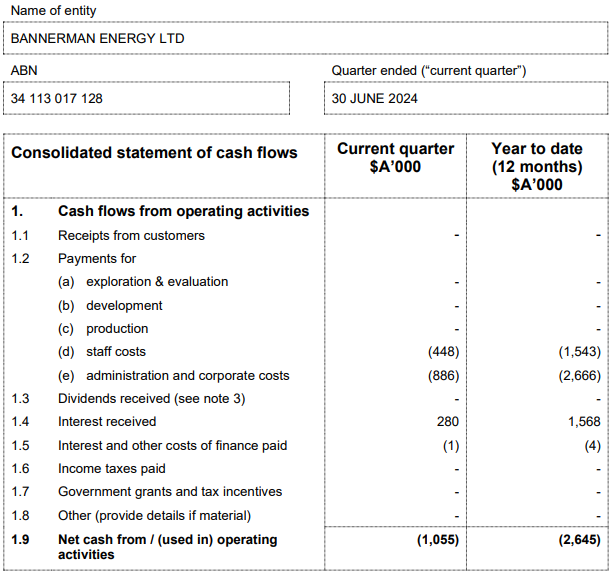
Still digging around in the dirt for this Uranium stock. First revenues are not expected until 2027.
 The Uranium trade was a good one for about 12 months. Not at the moment though.
Disclaimer: This information is provided purely for educational purposes. It takes no account of an individual’s personal financial circumstances and hence can in no way constitute financial advice. The above data may be subject to errors or inconsistencies for which the author takes no liability. It is imperative that all investors do their own research or if they need advice, seek it from a qualified financial adviser.
Announcements July 26
Let’s have a quick look at some announcements from today.
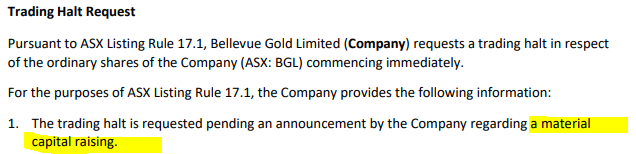
The shorts are right again. There is a pretty big short position (5.8%) in this gold miner believed to be there in expectation of a capital raise. The company has said it didn’t need to do a raise but low and behold here it is.

This is the best quarterly operating cash flow the company has produced to date. Revenues are much higher as are the operating cash flows.

Guidance seems to be below what the market was expecting. This is a small company though so there may only be one analyst.
 This is a typical chart of a company that is waiting to decide which way to trend again. Strong quarter with solid but unspectacular outlook. It may just not be enough considering the company is trading at over 20x revenues.


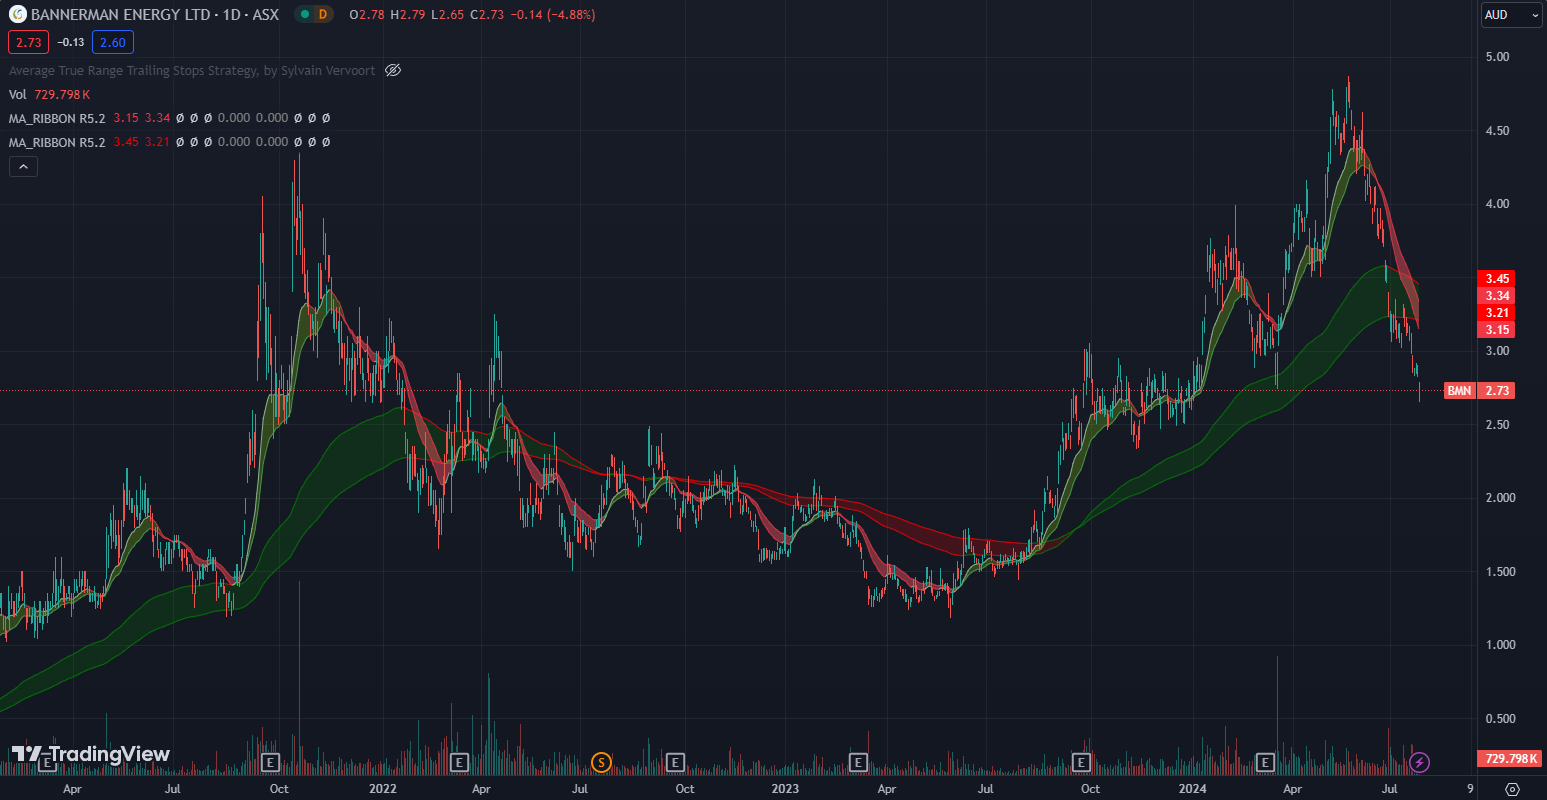
Revenues come in fits and starts for this Uranium miner. I know one of the big brokers out there always mentions them as one of their Uranium plays but it’s a total dud so far.
 Ugly chart with nothing in that quarterly cash flow to encourage further investigation for me. Maybe next quarter.
Disclaimer: This information is provided purely for educational purposes. It takes no account of an individual’s personal financial circumstances and hence can in no way constitute financial advice. The above data may be subject to errors or inconsistencies for which the author takes no liability. It is imperative that all investors do their own research or if they need advice, seek it from a qualified financial adviser.
Announcements July 25
Let’s have a quick look at some announcements from today.

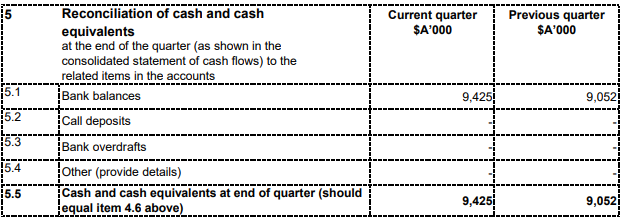
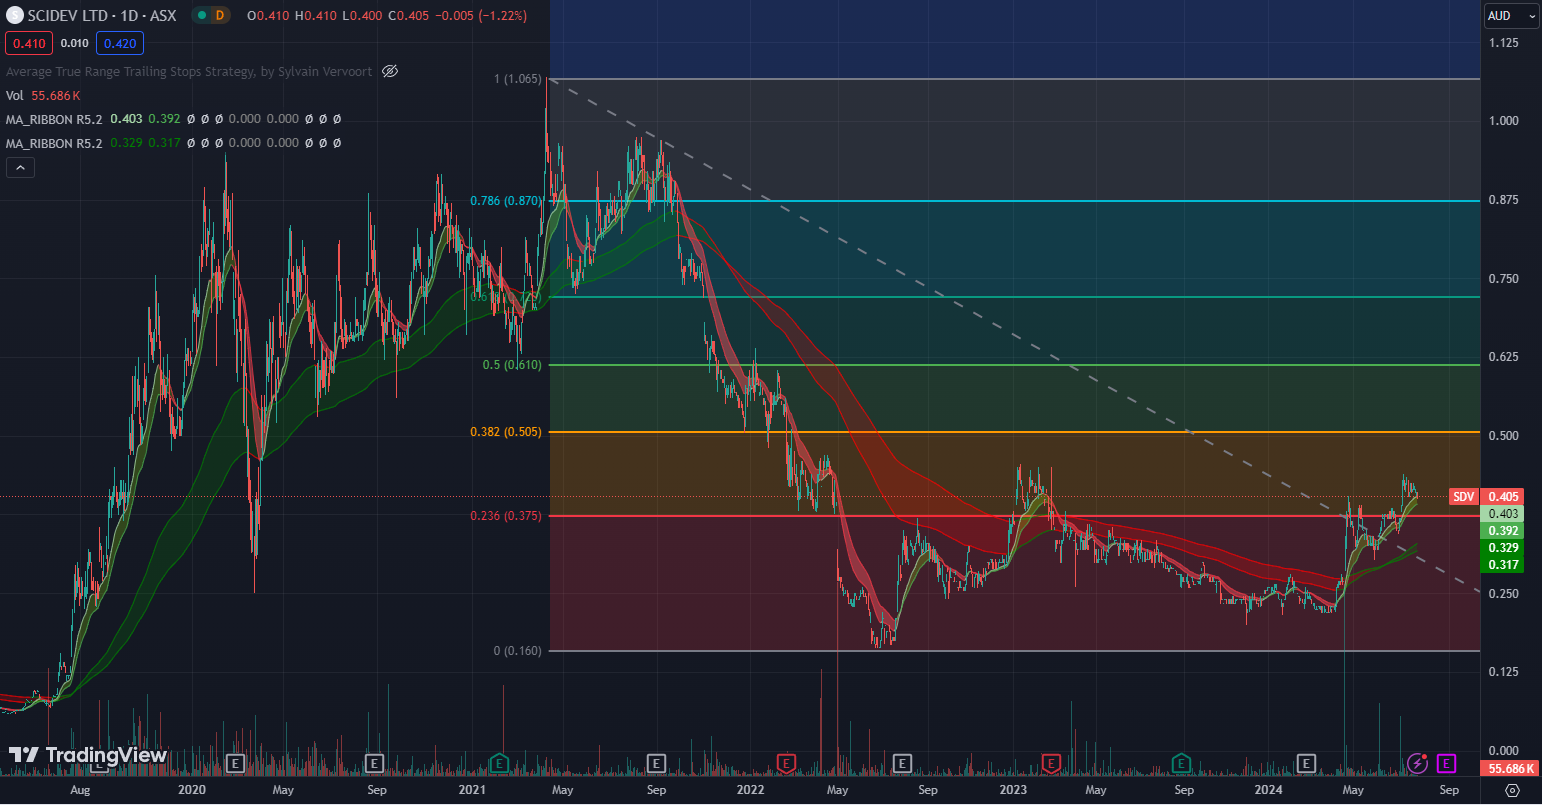
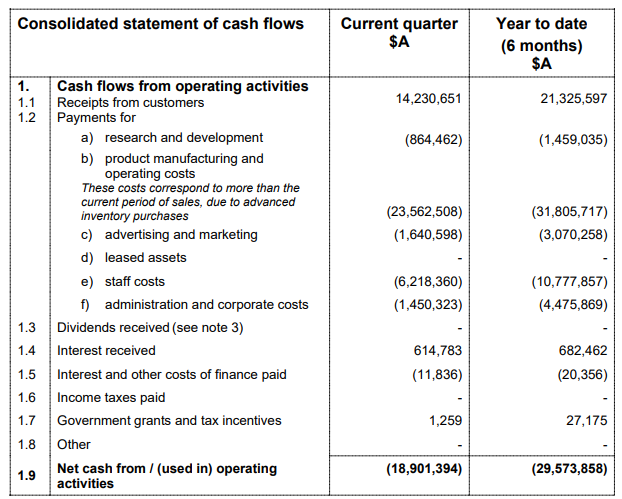
SDV is the winner so far today while the dilution in TLX is being absorbed.
This one came after the market close yesterday:


I don’t follow this company too closely although I have owned them in the past. Just based on this quarterly report, you would have to think a capital raise will be required in the coming months unless they’re on the verge of significant cash flows.

Can the stock push back above the 23.6% level at 52c or head lower down to the 38.2% level of 43.5c on the back of this result?
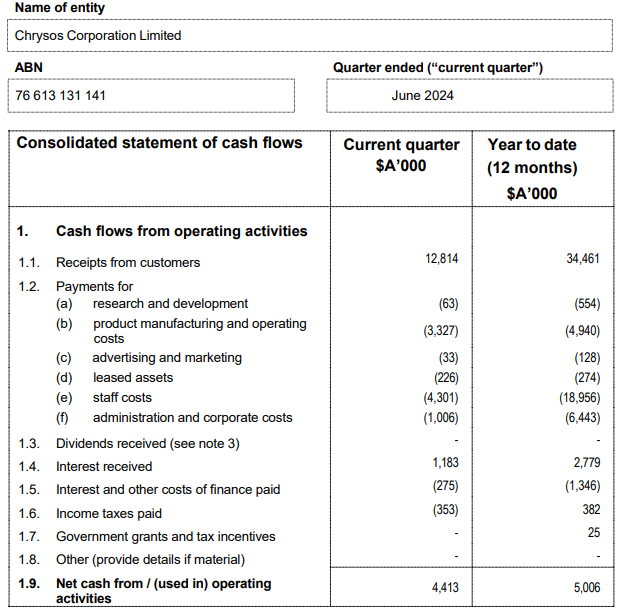
https://pilbaraminerals.com.au/

The company continues to prove that they are great operators. Sadly like all mining companies, they are at the mercy of the commodity price of their resource(s). I am quite interested to note that they received a higher Lithium price this quarter than last quarter when all the information I’ve seen suggesting that the Lithium price continued to fall during the quarter.
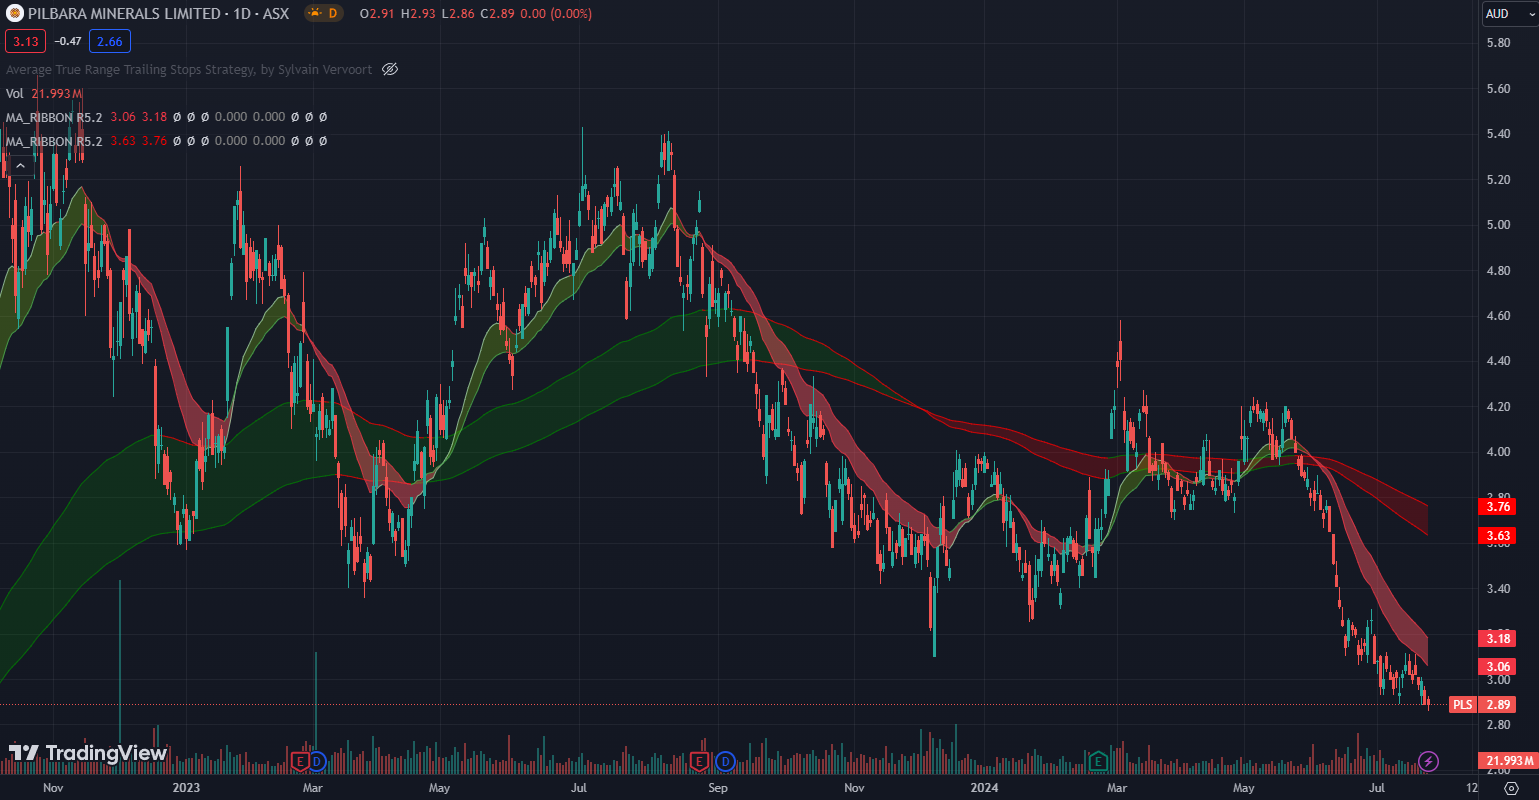
The most shorted stock on the market and with good reason when you look at this chart.
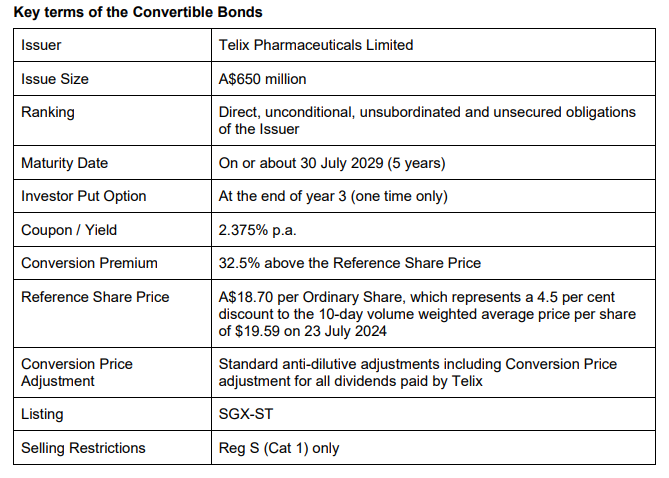
Convertible Bond issue from Telix looks a great deal for the company. Unless I’m missing something, this is equivalent to a capital raise in the future at ~26% above the current price with an interest payment in the meantime of 2.375% p.a. Bravo Telix! Nevertheless, this does dilute existing shareholders somewhat and the price looks set to open lower as a result.

Bit of hype around this company due to the involvement of Richard White (CEO of Wisetech). I don’t see anything to get excited about at this stage in these numbers. Remains a story stock for now.
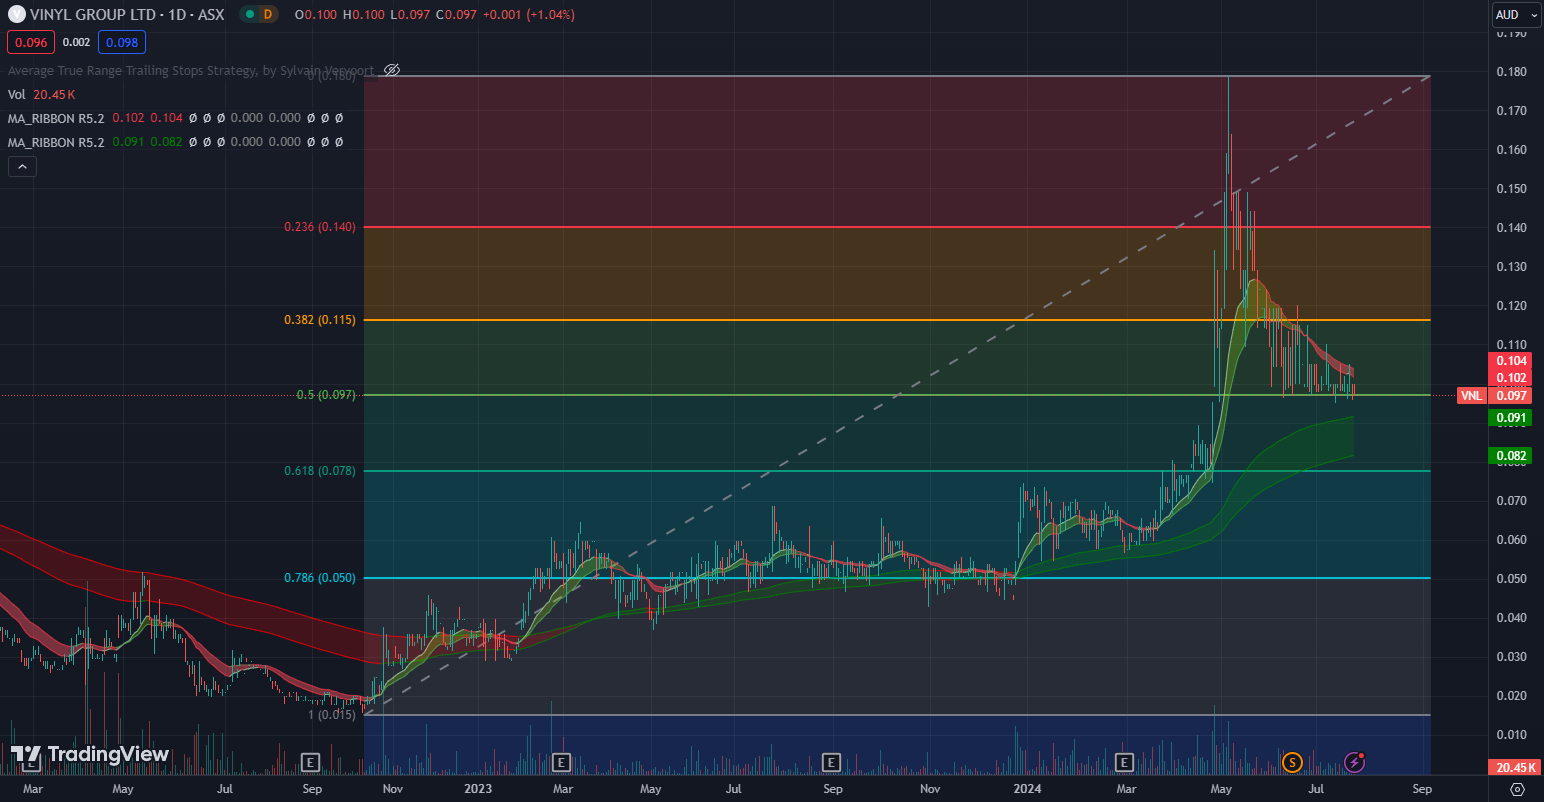
Will the 50% level hold and see a bounce back to test 11.5c or will it break and do down to test 7.8c?


Comments for ASX:VNL also apply to this company. Both could be incredible one day but they have more work to do yet.

Will the 50% level be tested today or the 38.2% level?


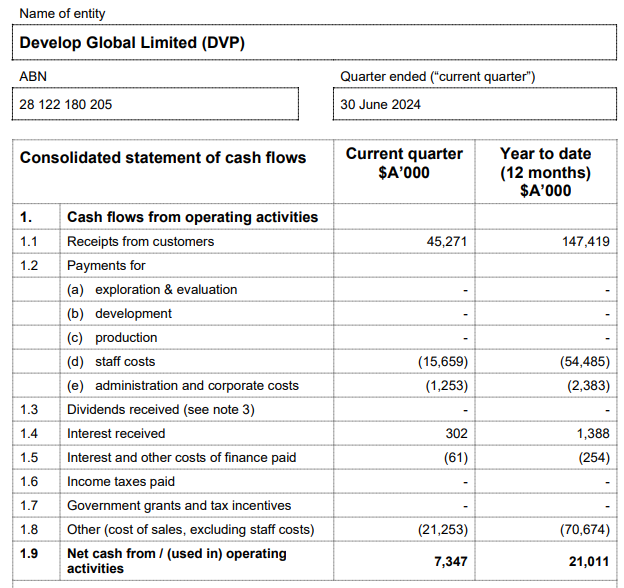
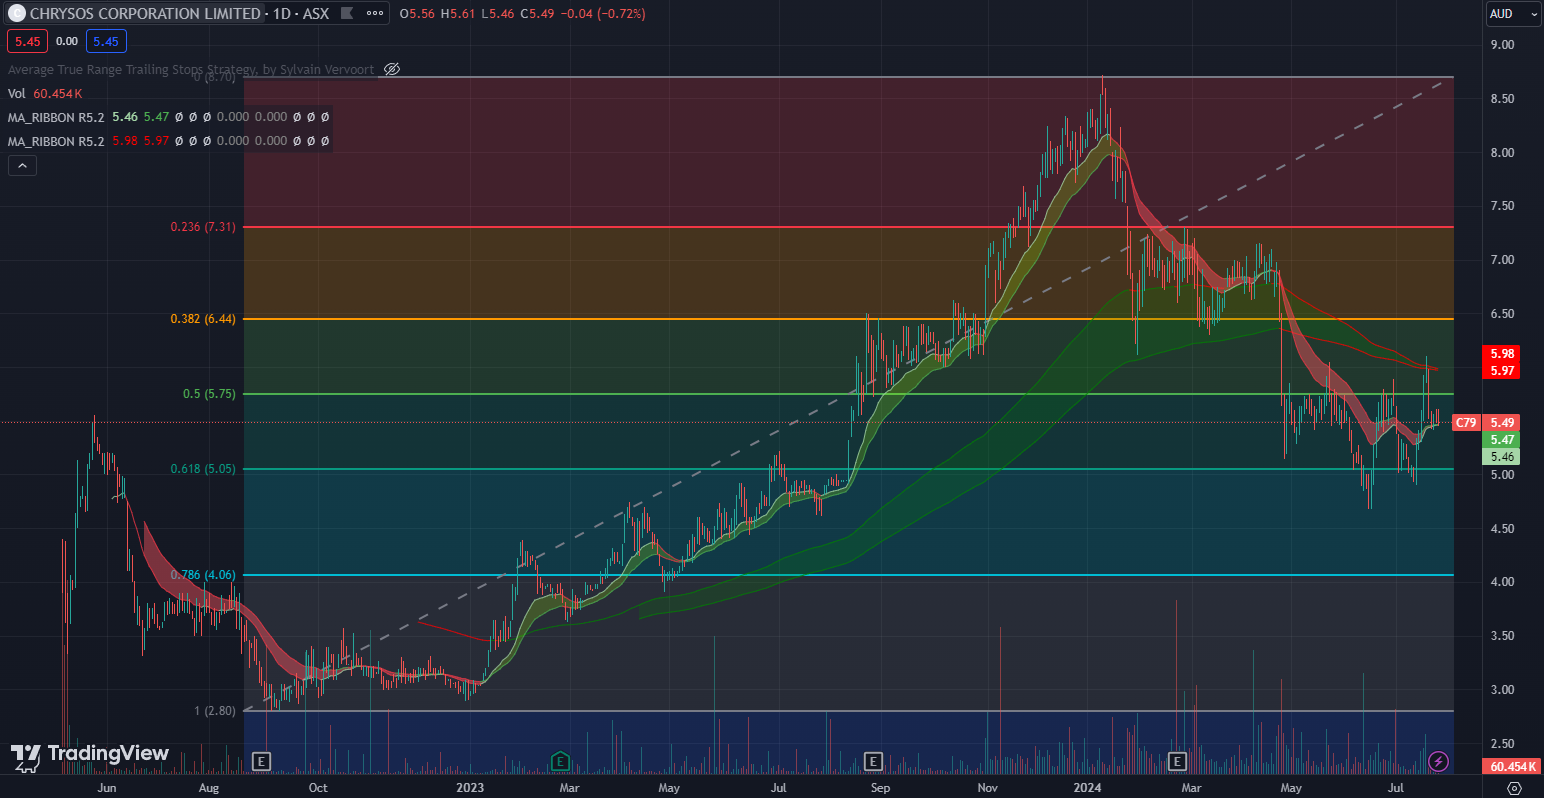
This emerging gold producer continues to execute in all the ways you’d want to see. Debt continues to come down, production continues to increase and the money is now rolling in. 100% unhedged means they are capturing in full the benefits of a buoyant gold price.

This stock has a long way to go. Near record gold prices and increasing production and profitability are the ingredients they need to continue to deliver.
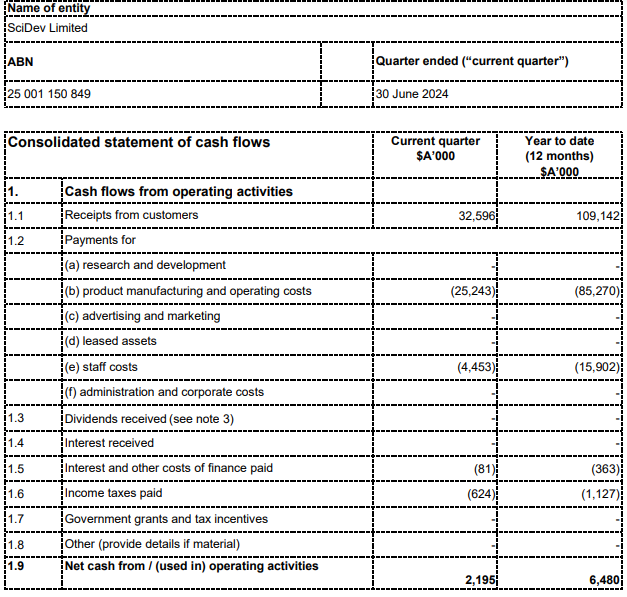
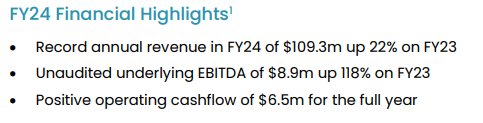
This little company continues to execute well. They have now been operating cash flow positive 8 out of the last 9 quarters and have just completed their best year ever. Revenue looks to be a beat by a couple of million while EBITDA looks like a big beat on what the analysts were expecting (although for such a small company with a $77M market cap, there is probably only 1 or 2 analysts).
It’s a long way to go for this company but continuing to deliver results as they have can only help.
Disclaimer: This information is provided purely for educational purposes. It takes no account of an individual’s personal financial circumstances and hence can in no way constitute financial advice. The above data may be subject to errors or inconsistencies for which the author takes no liability. It is imperative that all investors do their own research or if they need advice, seek it from a qualified financial adviser.
Announcements July 24
Let’s have a quick look at some announcements from today.
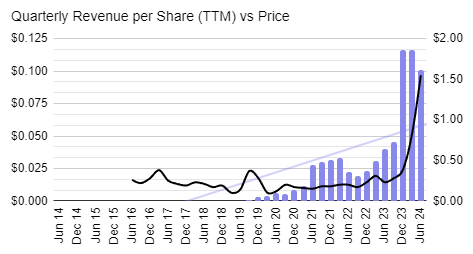
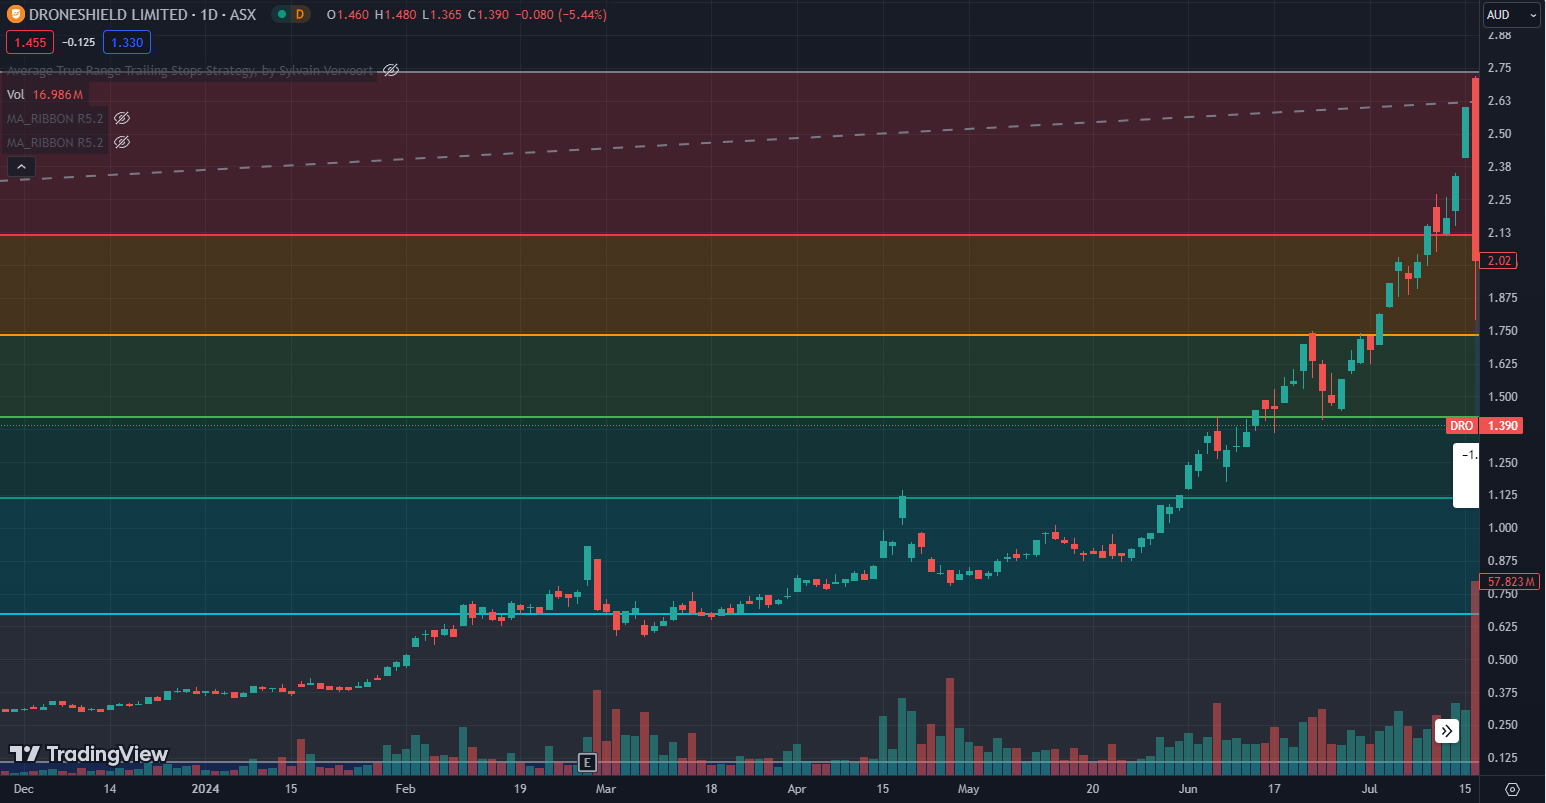
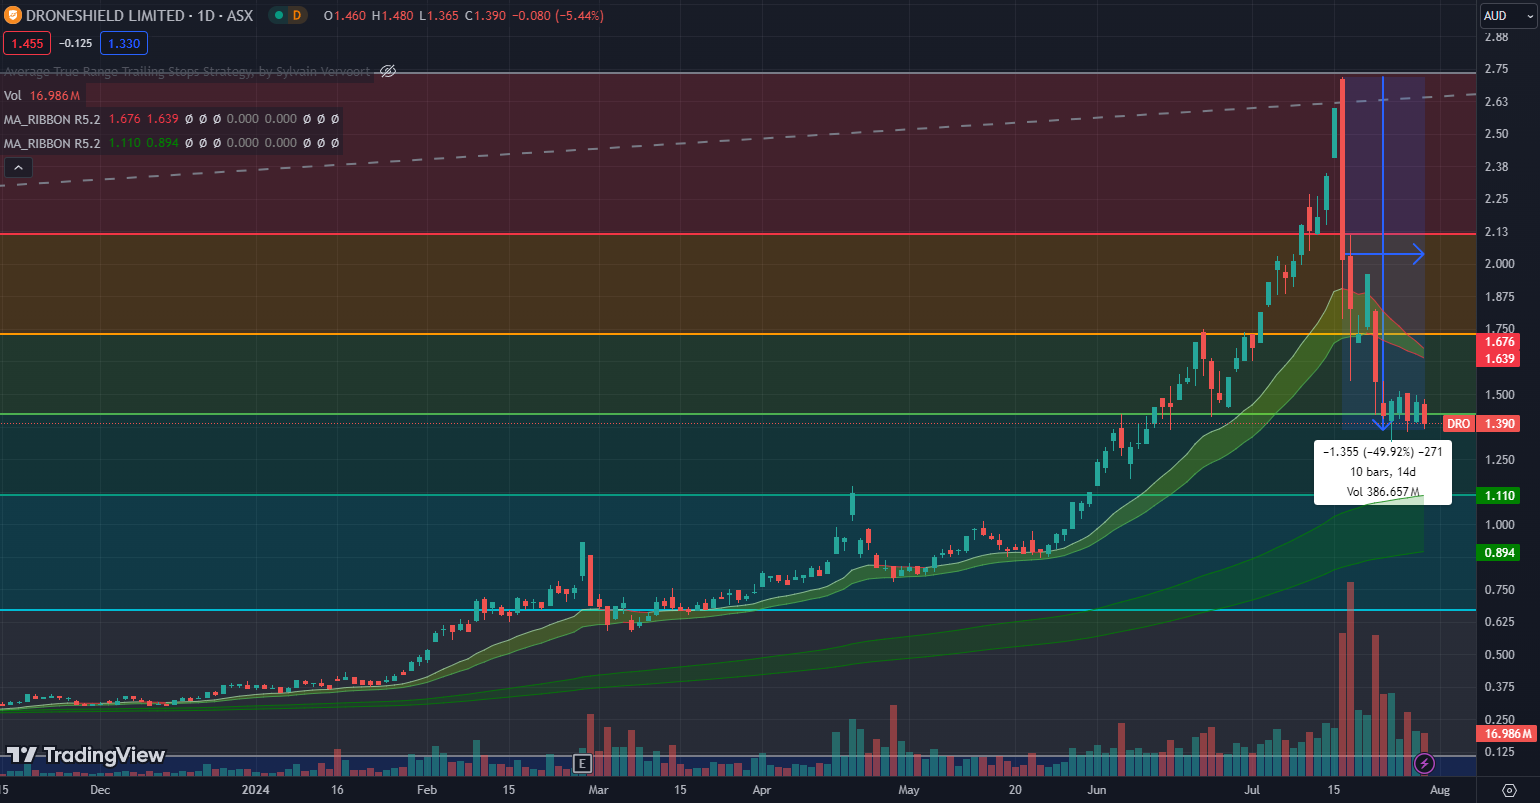
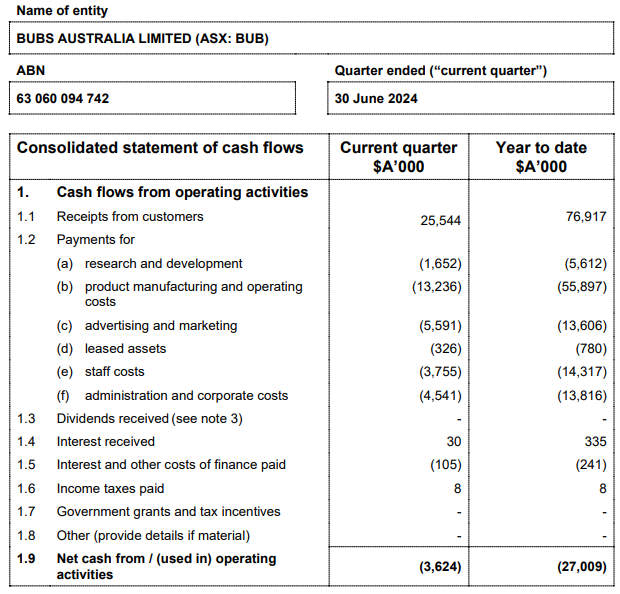
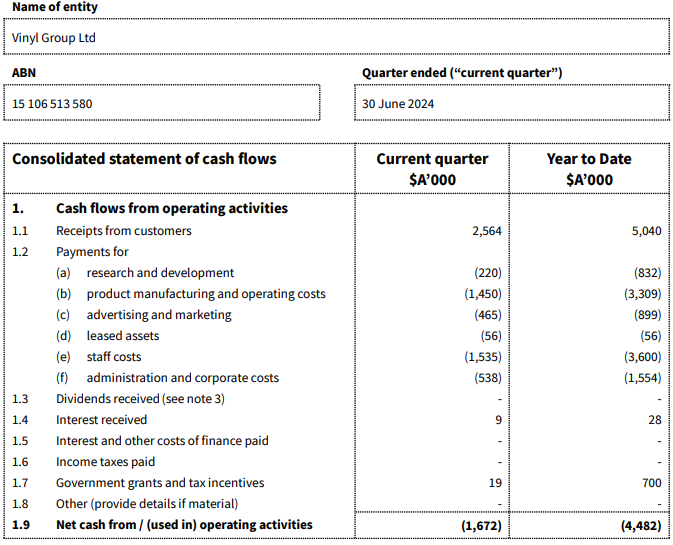
Revenues are rising but on a per share basis they’ve actually fallen due to the large capital raise and SPP in April. Operating cash flows have collapsed as they build inventory. Staff costs have increased from $3.5M to $6.2M from the corresponding quarterly 12 months ago. This is a pretty uninspriing result considering all of the hype around this company in recent months.
The parabolic chart is doing what parabolic charts eventually do – collapsing. It’s near impossible to apply support and resistance to parabolic charts so the next best thing is to use a Fibonacci retracement. I generally only become interested in parabolic charts when they retrace to the 61.8% level which is around $1.08. They’re currently at the 50% level which has provided some resistance today. The next few weeks will be very interesting.
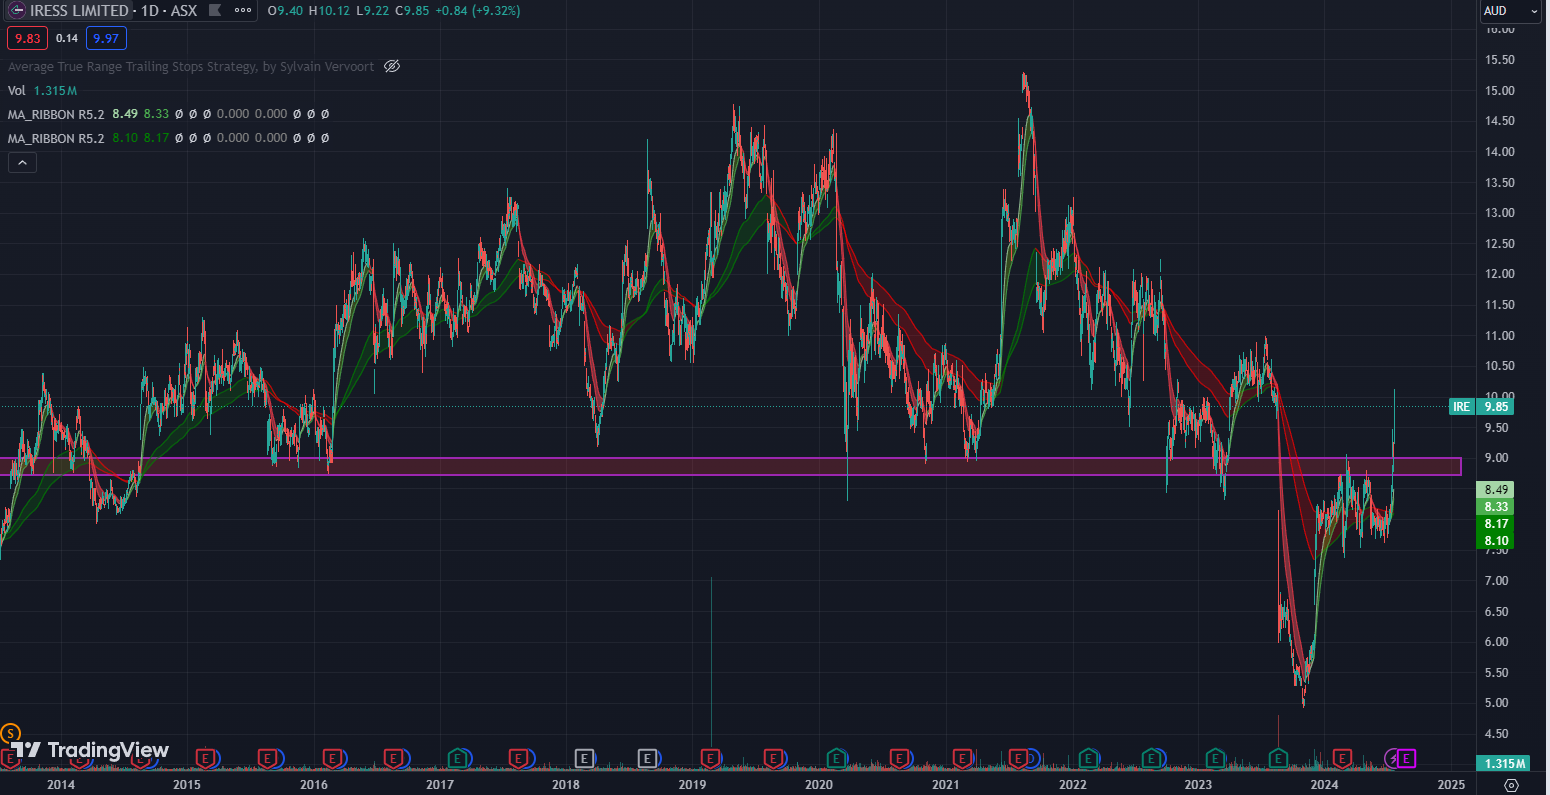
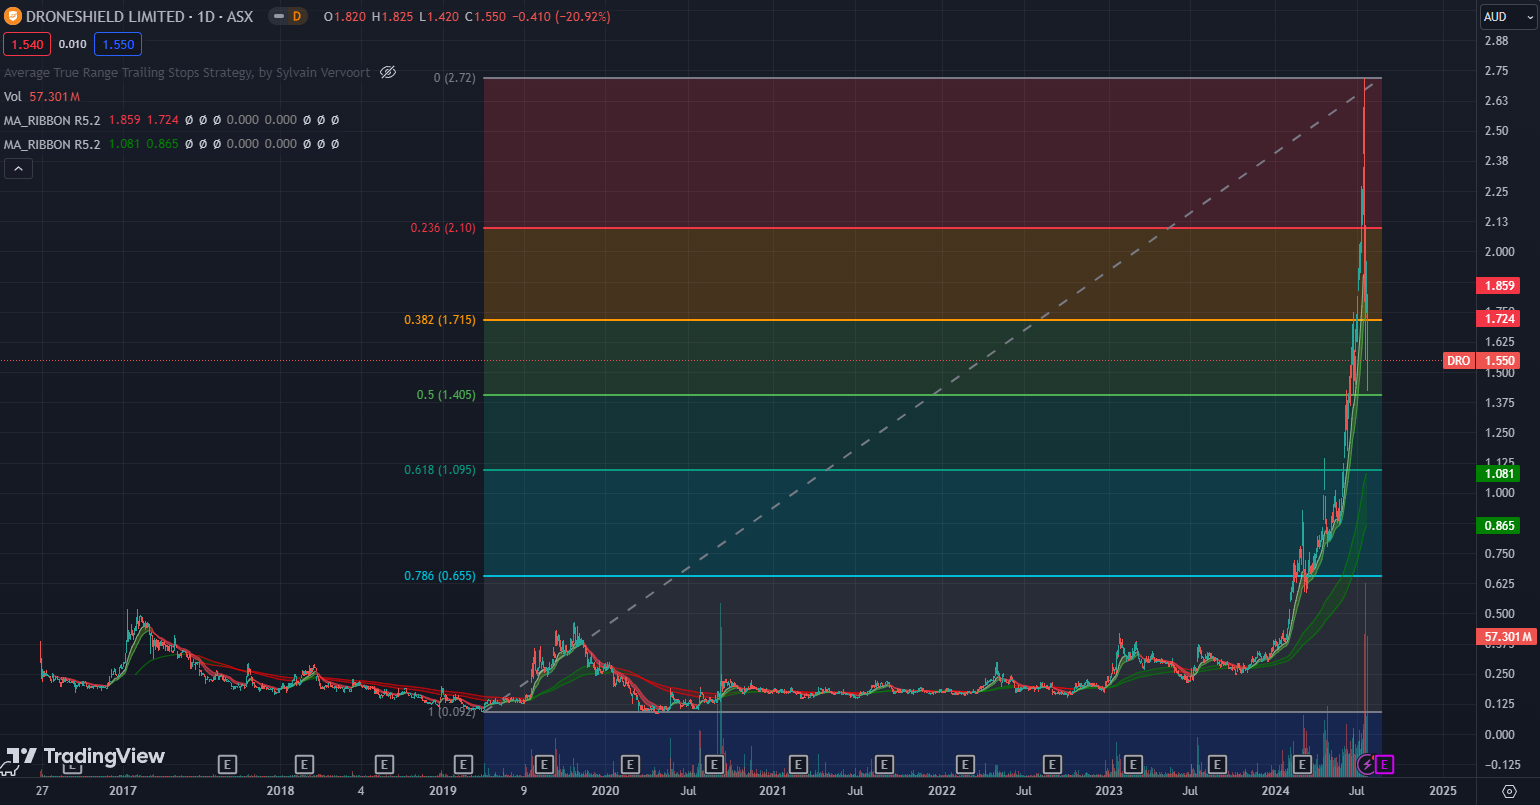
The market likes this result and has pushed the price above the resistance level around $9. The trend may finally have changed for this company which was a disappointing performer in 2022 and 2023.
Neither company has significant short positions with ASX:IRE ranking 231st and ASX:DRO 384th.
There was no announcement today but I thought I’d quickly share an observation about ASX:CBA. You may have heard a lot of commentators talking about ASX:CBA as being expensive based of their Book Value. Book value is simply the equity of the company which is calculated by subtracting total liabilities from the the total assets of the company. This is one method of valuing a company but isn’t always the most appropriate way to do so.
This is how ASX:CBA measures up according to my Book Value valuation model.

Needless to say, this supports the calls that ASX:CBA appears expensive on a price to book measure of valuation.
Disclaimer: This information is provided purely for educational purposes. It takes no account of an individual’s personal financial circumstances and hence can in no way constitute financial advice. The above data may be subject to errors or inconsistencies for which the author takes no liability. It is imperative that all investors do their own research or if they need advice, seek it from a qualified financial adviser.
Announcements July 22
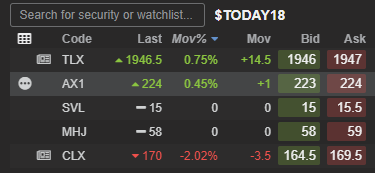
Telix Pharmaceuticals (ASX:TLX) has been quite volatile since their update but today finds itself almost exactly where it was before. Michael Hill ASX:MHJ jumped on the day of its update and has essentially gone sideways since. Silver Mines ASX:SVL is exactly the same price too. CTI Logistics ASX:CLX had a strong day before it announced results and a couple of strong days after. It has managed to hold its gains to date. Accent Group ASX:AX1 has also gone sideways after an initial pop upon its market update.
Let’s have a quick look at some announcements from today.
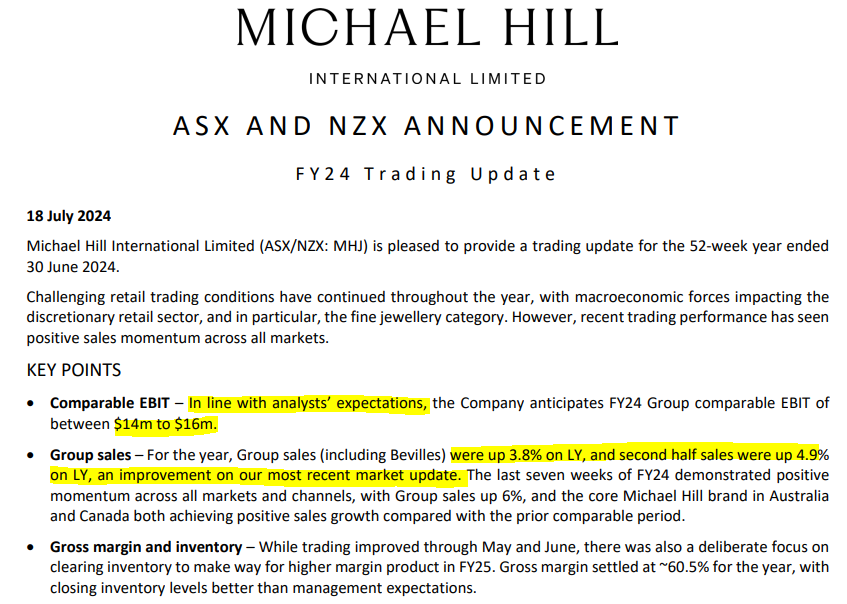
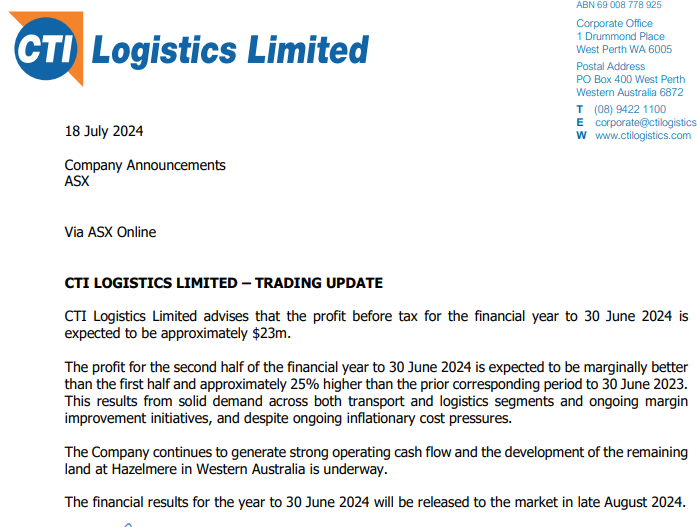
I usually view an announcement after market with scepticism but there doesn’t seem to be anything nasty hidden in this one. Revenue is better than expected while analysts seem to have been expecting EBIT to be around $16M, the company is saying that is the upper range now. It must be noted that EBIT was nearly $59M last year though.
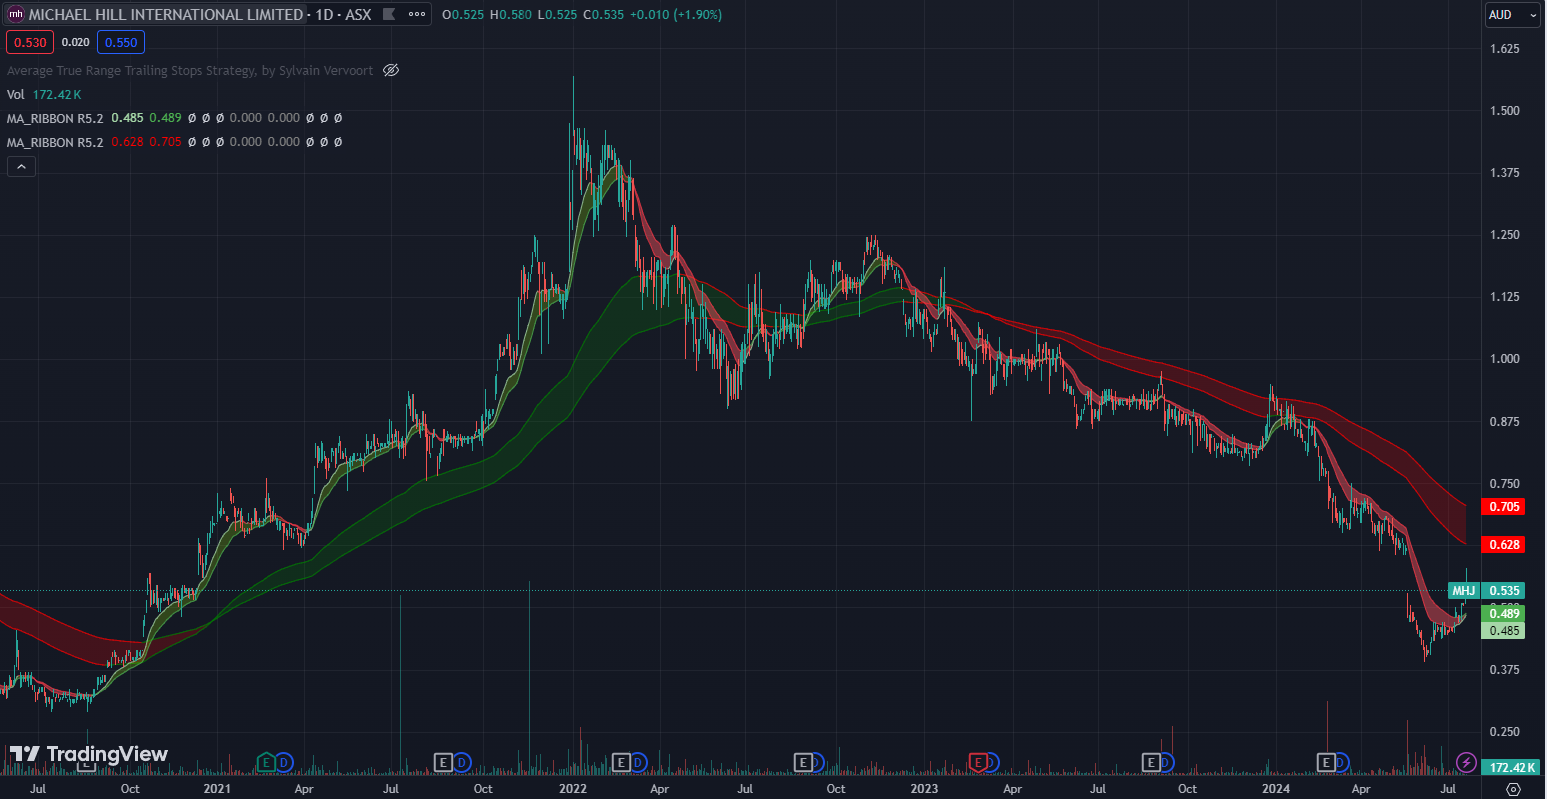
You probably couldn’t find many worse charts than this. Retail is cyclical and no stock demonstrates that better than this one.

You need to look no further than this earnings chart to see why.
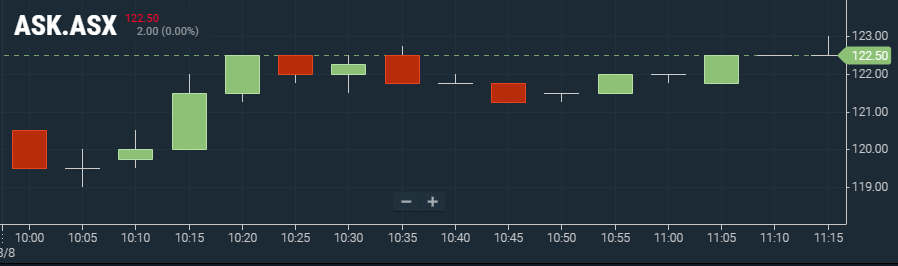
I’m not sure what the market was expecting for this company. With only a $122M market cap, it doesn’t appear to have any analyst coverage.
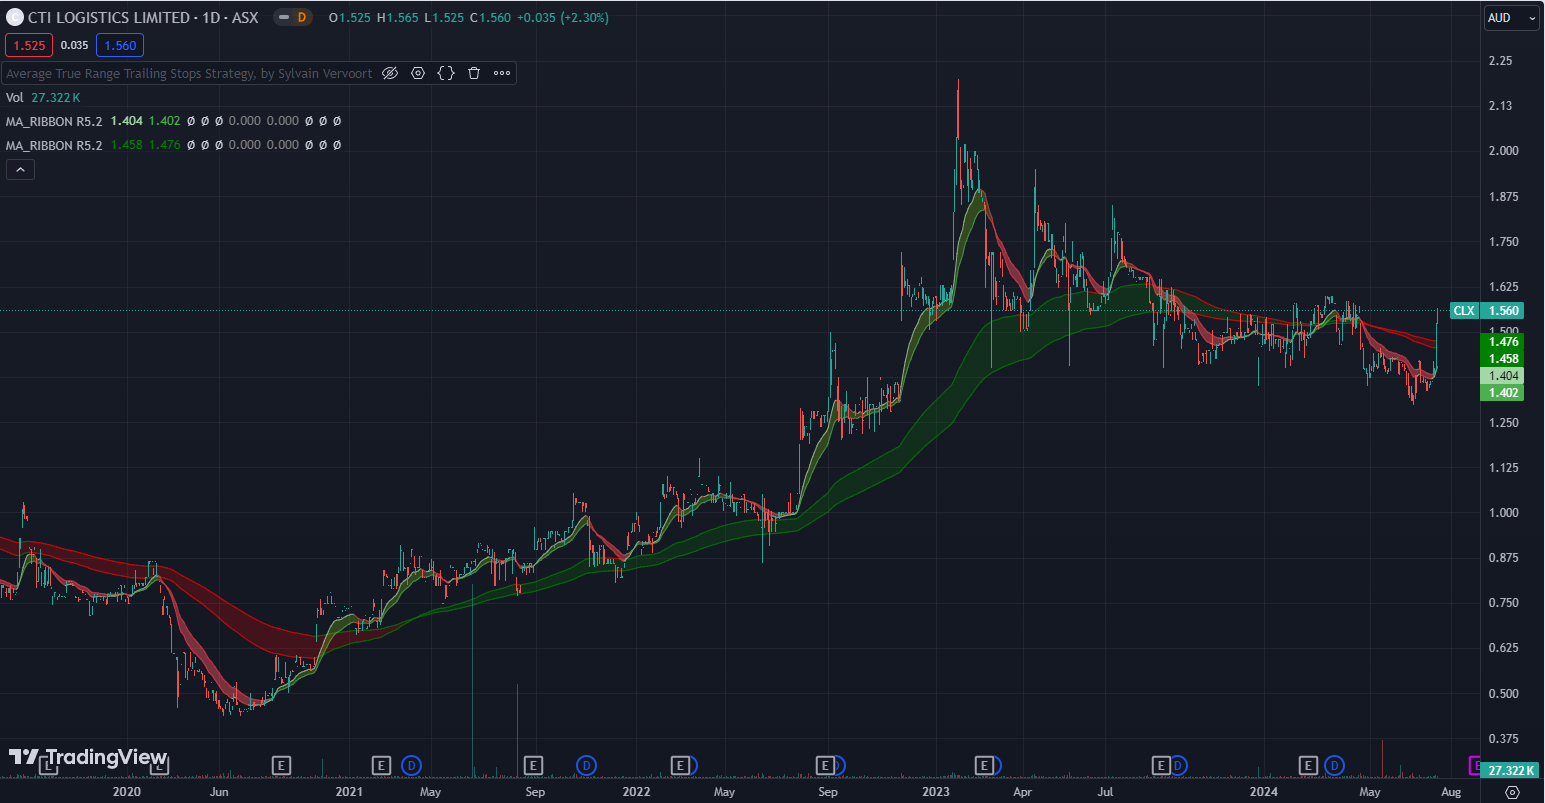
Perhaps this result is better than the market was expecting and few got wind of that before the announcement tonight?
This small silver company has secured some funding which appears to be on reasonable terms. The project has been a long-time in the making so hopefully this is the final raise they need before delivering their DFS. Great terms for the investor with almost no downside and plenty of potential upside and a 10%p.a. income stream in the meantime.

 Sadly for anyone bullish on the silver price, this has been a poor way to play that theme. While Silver (in Australian Dollars) is up 30% in the last 3 years, this company is down 40%. In more recent times, the divergence has been even more glaring.
These guys still find ways to grow in a tough retail environment. The result is a beat excluding the one-off charge ($123.2-125.2 compared to expected $117.18) and hence the shares have had a great day today. Analysts will be lifting their numbers based on this as well as factoring in the removal of the less profitable stores that are to be closed.
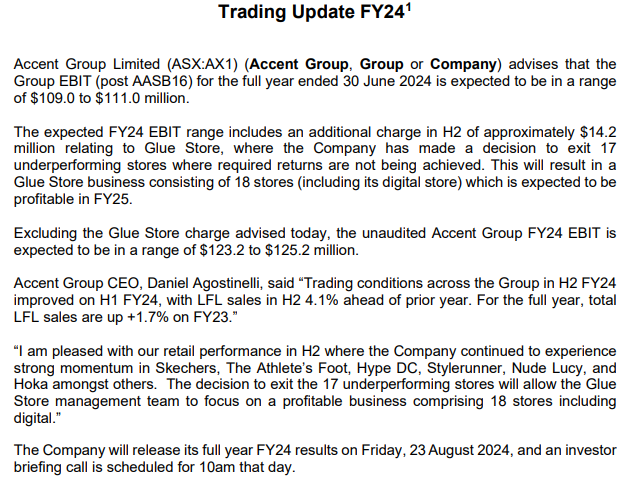
A good result was met with a very positive day of trading today. It will be interesting to see if the shares can start a new uptrend from here. Volume today was huge.
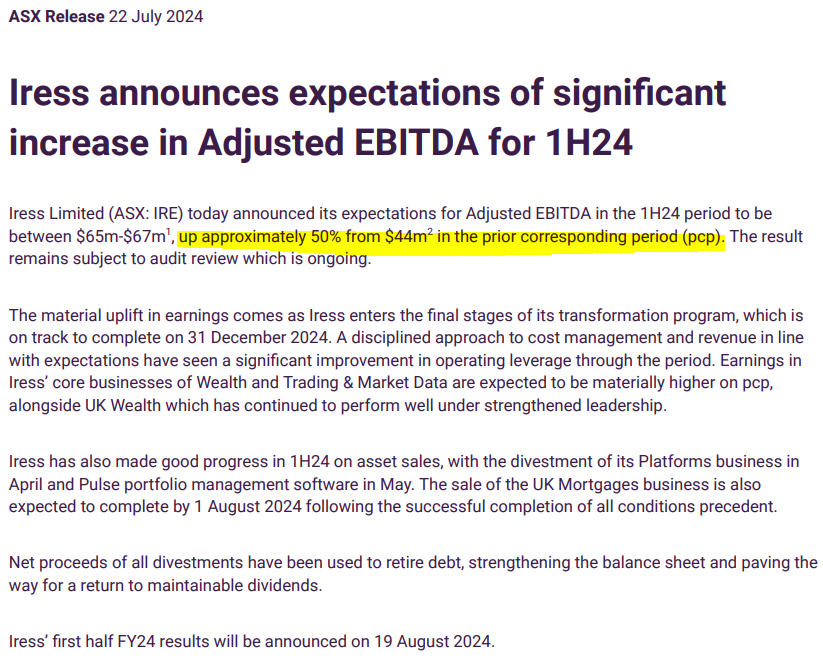
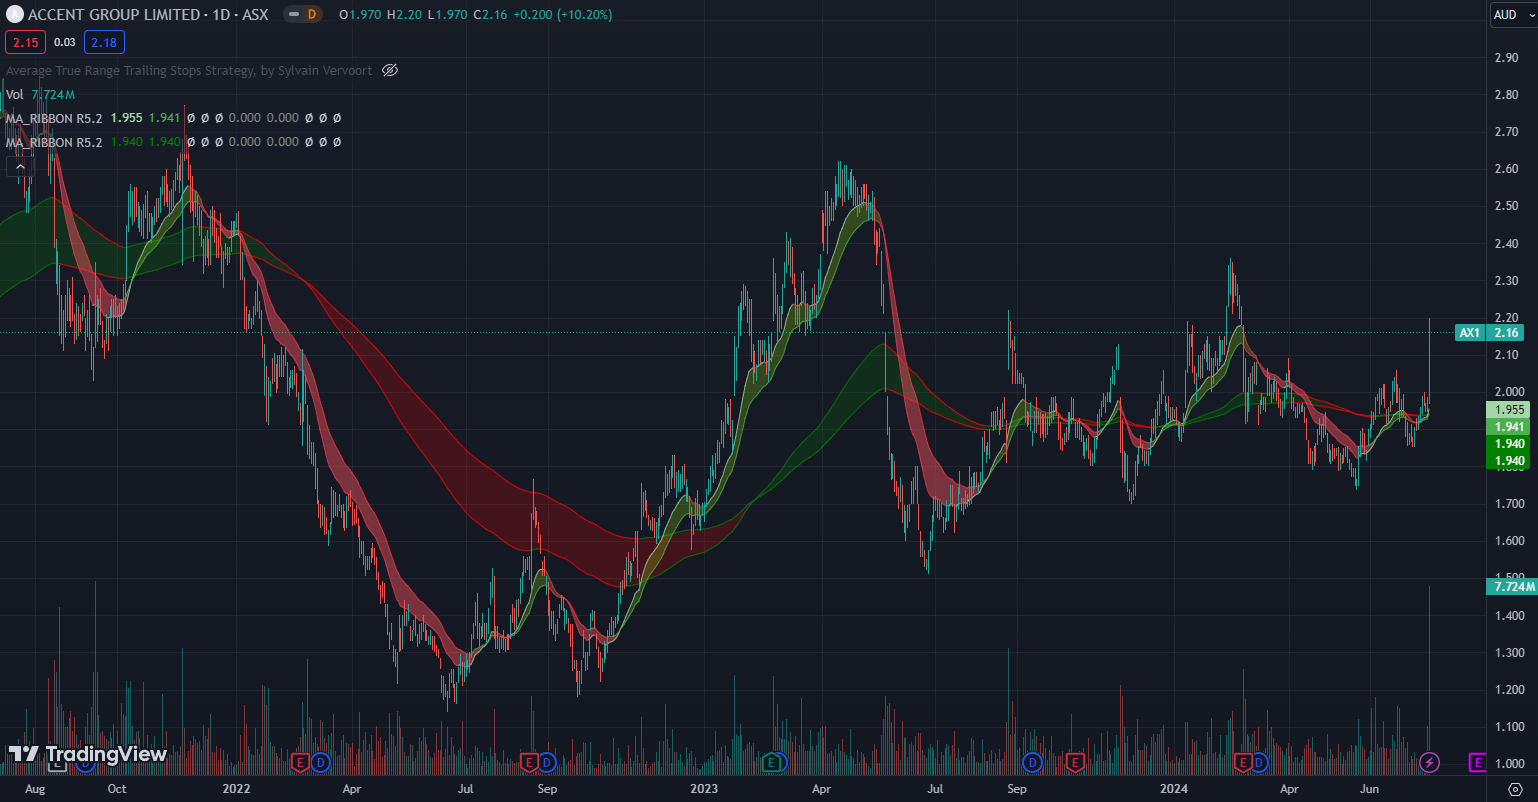
I read this on the train this morning and saw the words “upgraded revenue guidance” and thought this stock would be in for a good day. In the end they finished down 2.65%. I think the reason is that while they have lifted their numbers, the market had already lifted its numbers. Nevertheless, growth of 48-54% on 2023 makes this one of the most exciting growth stocks on the ASX.
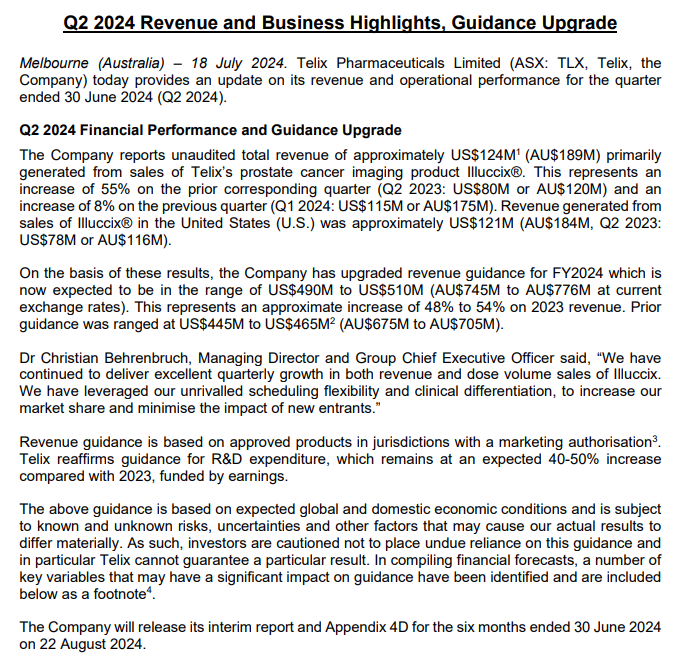

The price chart also gives us clues that the market had been increasing its expectations.
Disclaimer: This information is provided purely for educational purposes. It takes no account of an individual’s personal financial circumstances and hence can in no way constitute financial advice. The above data may be subject to errors or inconsistencies for which the author takes no liability. It is imperative that all investors do their own research or if they need advice, seek it from a qualified financial adviser.
Announcements July 18
CSL Limited (ASX:CSL) is a global biopharmaceutical company based in Melbourne, Australia. Founded in 1916, it develops, manufactures, and markets biotherapies, vaccines, and blood plasma products. The company operates through two main segments: CSL Behring, which focuses on plasma-derived therapies for conditions like hemophilia and immune deficiencies, and Seqirus, which specializes in influenza vaccines. CSL Behring also plays a key role in recombinant protein and monoclonal antibody treatments for chronic and acute conditions. Known for innovation, CSL invests heavily in research and development, expanding its pipeline with gene therapies and novel vaccines. With operations in over 30 countries, it serves global markets, delivering life-saving and life-improving treatments.
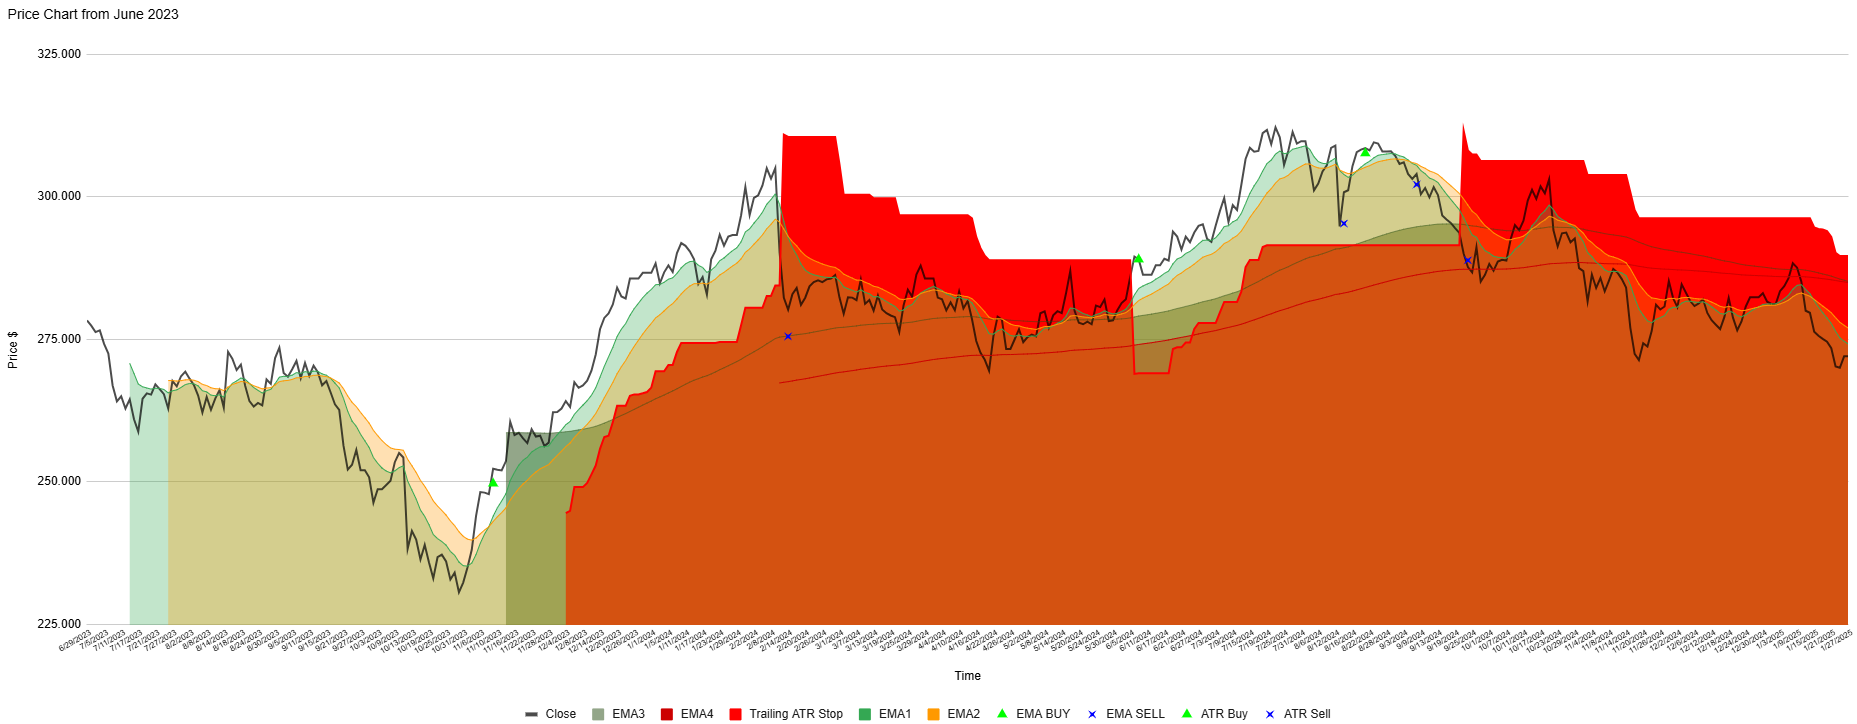
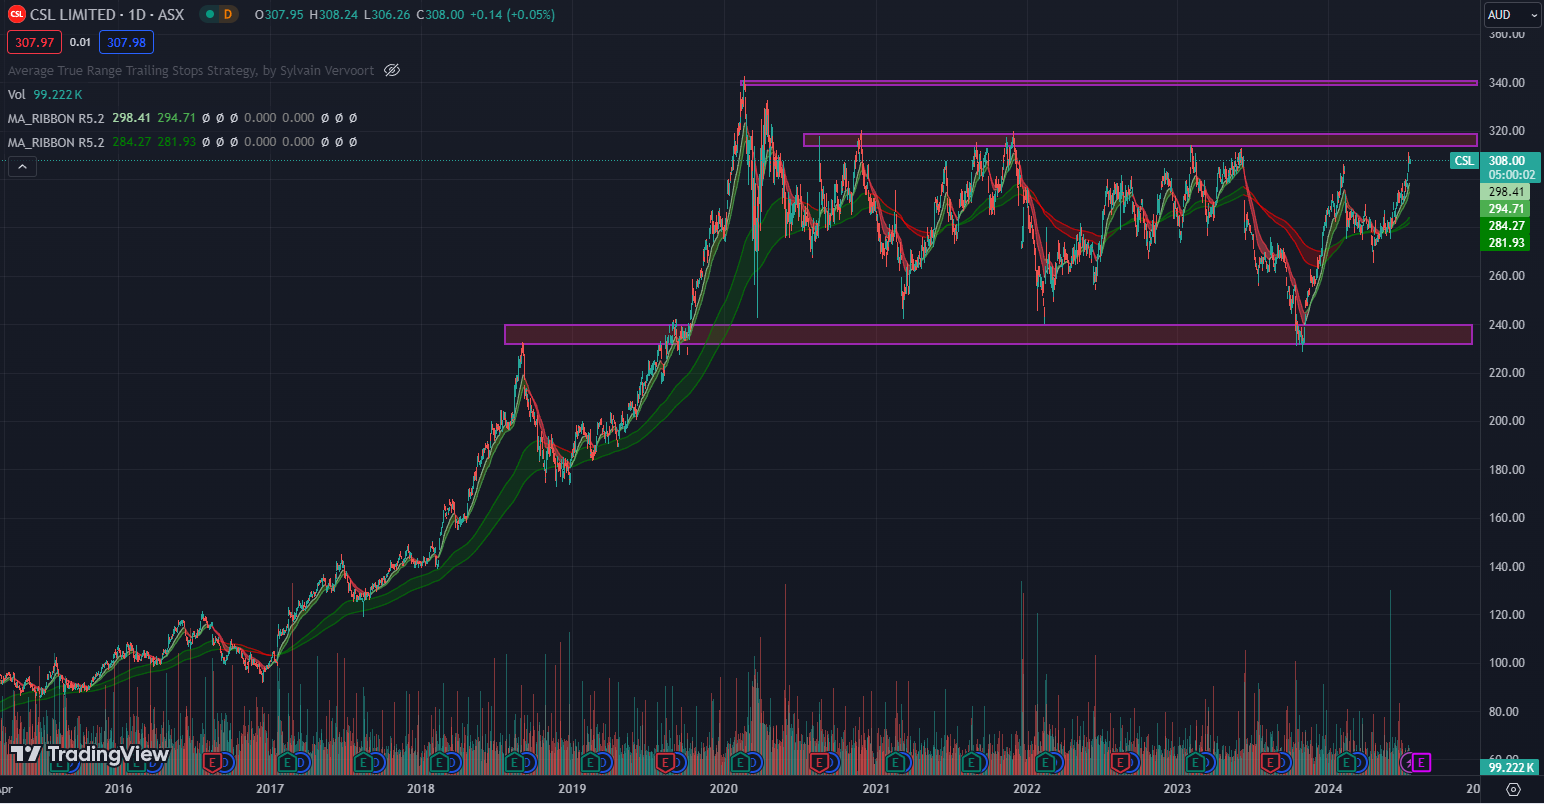
The price chart of CSL today is basically where it was at the start of the chart period. In that time, two profitable short-term trades have been generated by the 3EMA and ATR indicators with one losing trade. There are currently no open trades suggested as the share price is trending lower again.
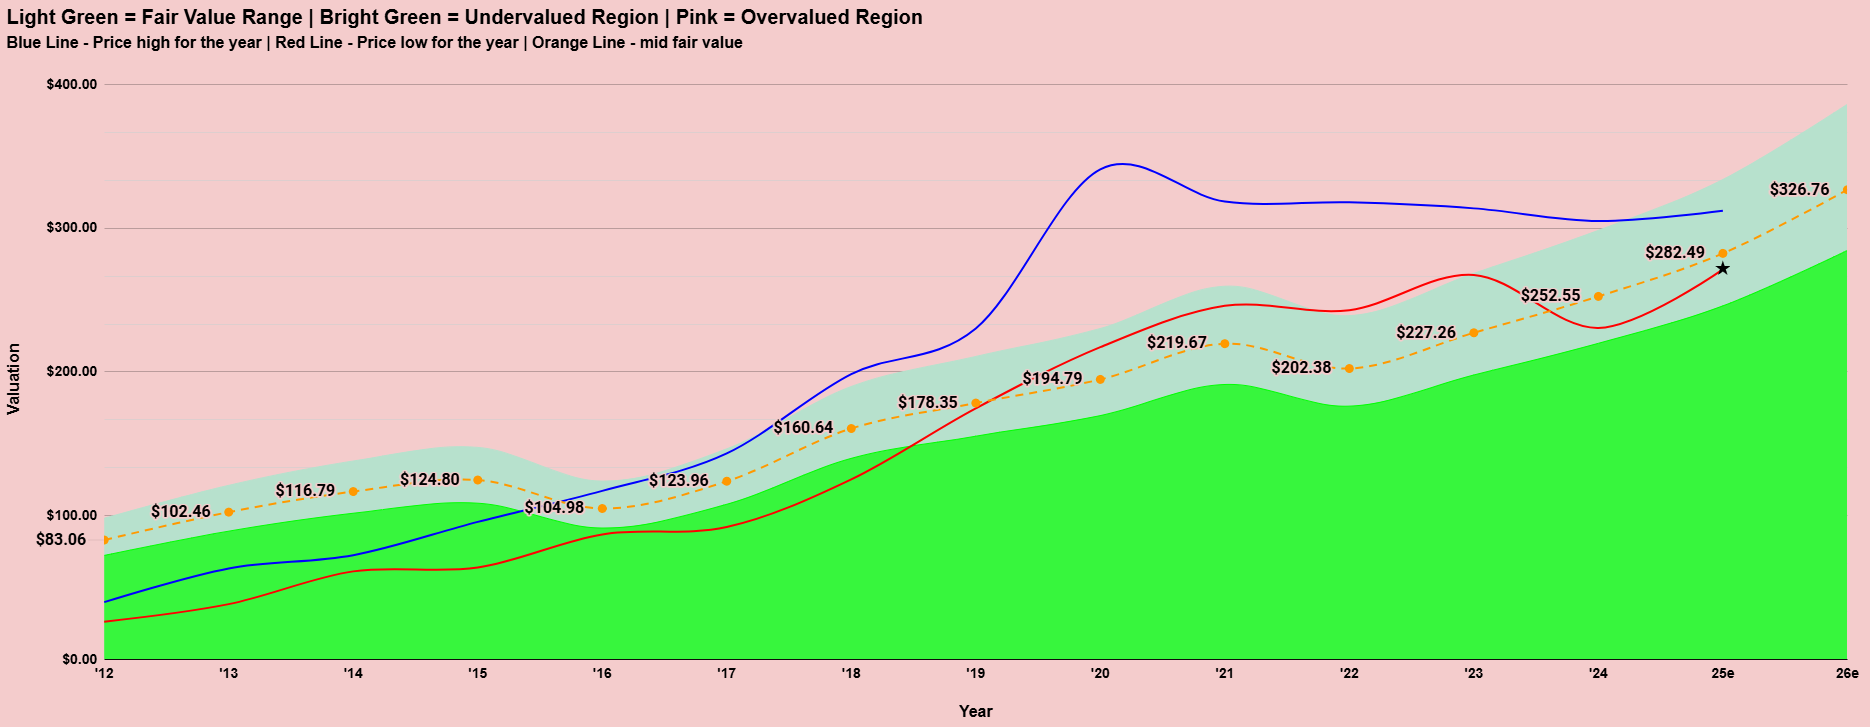
Overall, CSL has actually been in a sideways trading pattern since 2020 as can be seen on the valuation model chart below. In 2020, the valuation was over $100 above the model suggestion for fair value. After 4 solid years of consolidation, earnings have now caught-up and to the point where we now find CSL trading a little below fair value. If CSL can deliver some growth when it next reports around February 11, it might just be ready to start a new uptrend.
*** end update

The latest result was ok but not enough to push CSL up and out of the sideways pattern it has been trading in since 2020. The growth outlook is for lower growth than was expected in 2024. The acquisition from a couple of years ago has not delivered as they had hoped. The rest of the business continues to perform well. If they can get the Vifor acquisition to deliver, that would probably be the catalyst to see them move into an uptrend once again.

For now, there doesn’t appear much value here with a PER in the 40’s and forecast growth of just 14% in EBITDA and a grossed up dividend yield of just 1.4%. The valuation model which is based on how the market has been prepared to value the company in the past, suggests shares are trading close to fair value. The analysts love it though, suggesting the shares should be around 10% higher than they are today.

CSL (ASX:CSL) earns a tick on all 8 initial screening metrics. Revenue and earnings are again expected to have grown when they next report their results on August 13. The share price has recently moved into an uptrend based on the short and medium term moving averages although it remains within a longer term range. This has seen it move above the average broker price target. This is after an extended period of sideways price movement. It pays a small dividend and have a small amount of debt relative to its size.
CSL (ASX:CSL) had been a great performer for investors over a number of years until the share price peaked in February, 2020. Despite the peak coming in 2020, the shares showed continued growth in earnings up until 2022. A fall for a year then saw a return to growth in 2023. Analysts are forecasting further growth in the years ahead.

CSL (ASX:CSL) is a growth stock, albeit there are many growing faster in my database.
CSL (ASX:CSL) is ranked #302 on the ASX Most Shorted Stocks List. 0.4% of its shares are currently short sold. This is insignificant.

Debt and shares on issue were reducing until 2022 when the company made an acquisition. Nevertheless, debt remains at conservative levels. It’s also encouraging to see that CSL has shown the desire to reduce debt in the past.
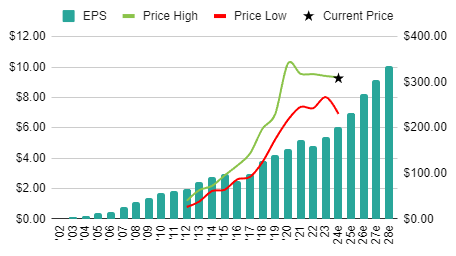
Zooming out, we can see that the company has been an incredible earnings grower for over 20 years. Analysts don’t see any reason why this won’t continue from here.
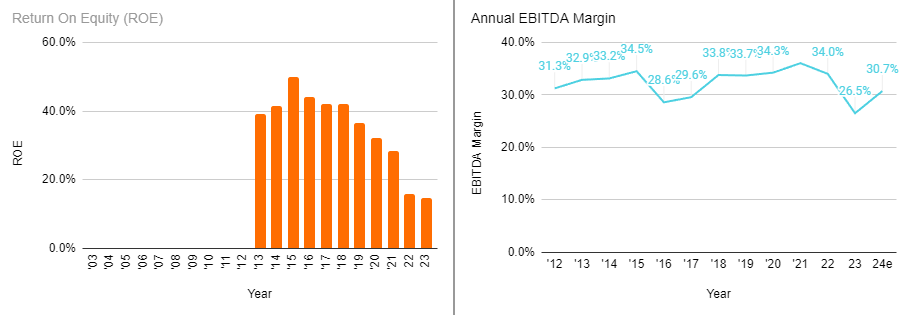
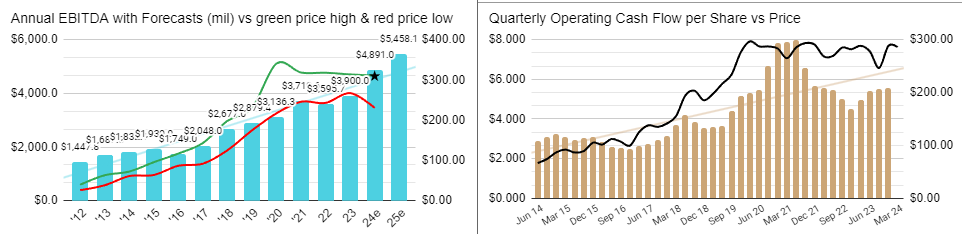
Return on Equity (ROE) has been falling since 2014. This could partially be explained by the declining debt in the company over that time. However, ROE failed to bounce back in 2023 despite the addition of some debt once again. EBITDA margins have hovered roughly between 30 and 35% although they were 26.5% in the last results. The market is forecasting them to bounce back when they next report.

The company reports an increase in earnings 87% of the time. Earnings before tax and excluding abnormal items is less at 67%. Margins of 27% are below historical highs as is the ROE of 15%. Debt is manageable at 65%. As it stands today, CSL (ASX:CSL) can only be considered a medium quality company. In the past it would have been amongst the highest quality companies on the ASX but some key metrics have deteriorated in recent years.
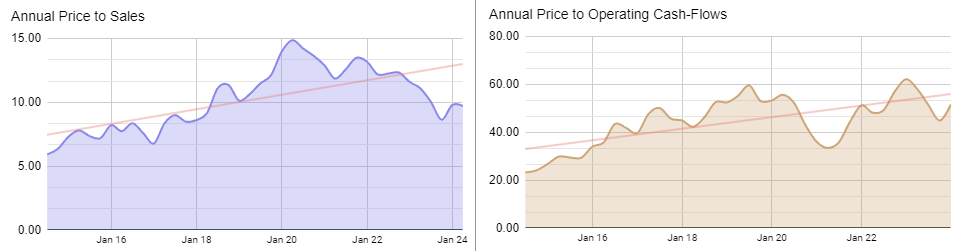
The long-term trend for Price to Sales and OCF to sales has been rising. Currently, the company sits comfortably below trend and certainly below previous highs for these metrics.
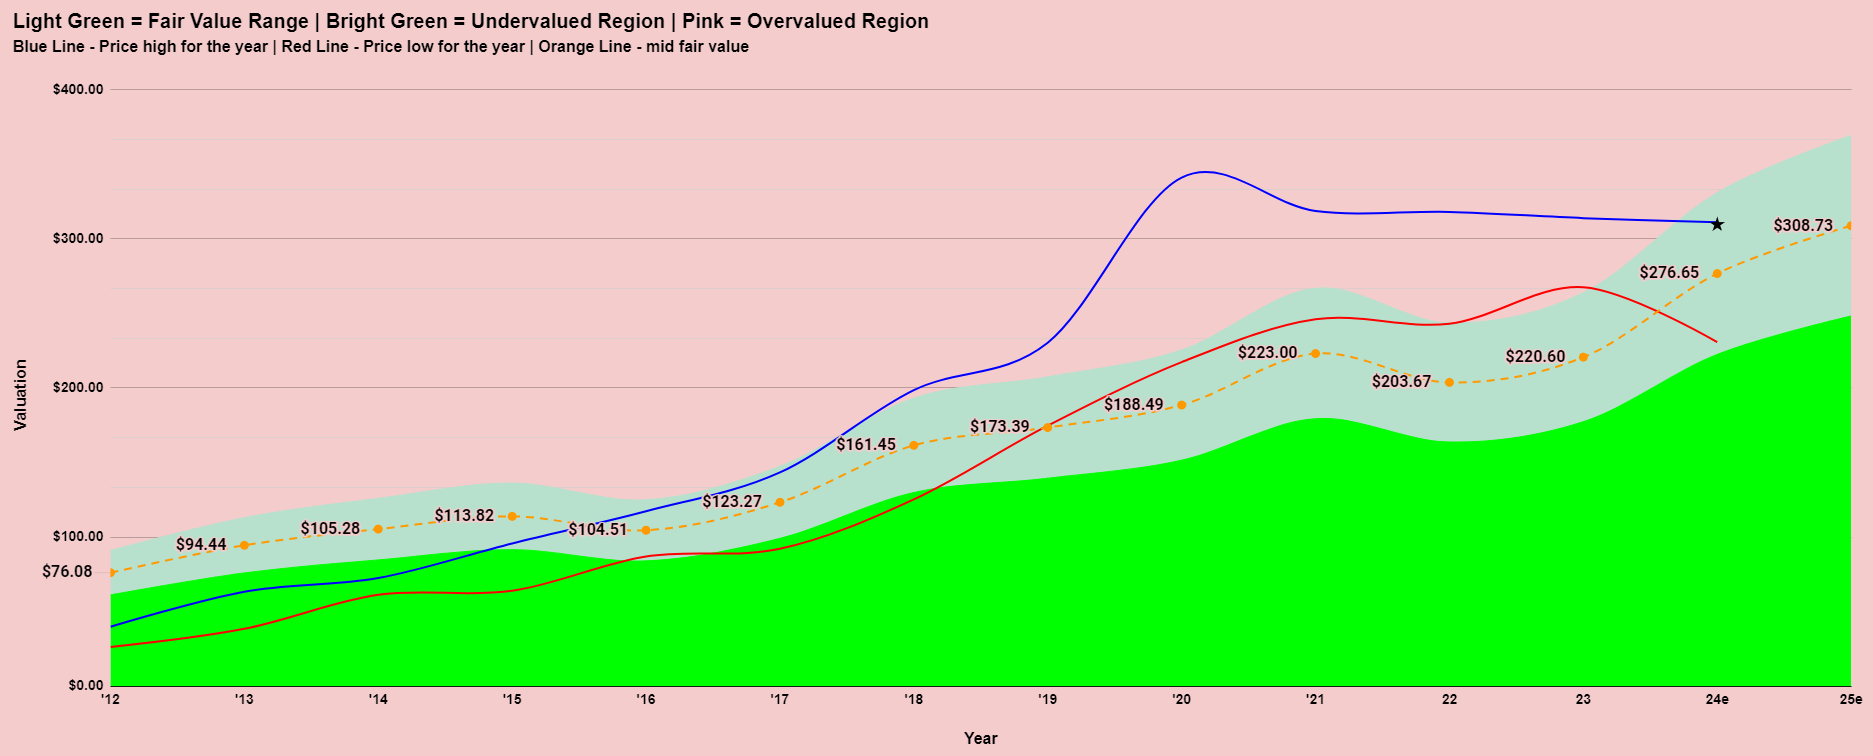
I think the valuation model tells the true story of this company and that is one of a valuation that got WAY ahead of itself. What followed from 2020 until today was an extended period of sideways price action as the market waited for the fundamentals to catch up. This year has seen the share price hovering in the fair value range once again.
As explained above, the share price has essentially been moving sideways after the uptrend ended in 2020. The share price is once again making a move towards the top of the range. The difference this time is that shares are no longer significantly overvalued. Should it be able to show a good result when it next reports it may just be ready to create a new high and start a new uptrend.
There has not been a lot of news coming out of the company. The most recent is a presentation from April.
A lot of focus has been on the acquisition of Vifor. While this is clearly an important step for the company, it would not “break” them if it wasn’t as good as first thought. The CSL Behring division will always be the main driver with it comprising 70% of revenues.

Going back to their half year results presentation in February, we have this Outlook statement which would be assuring for investors if it is achieved.
CSL (ASX:CSL) experienced a period of overvaluation by the market, followed by years of consolidation, eventually bringing its valuation in line with fundamentals. Some quality metrics have declined due to COVID-19 disruptions and a less profitable-than-expected acquisition. However, the potential for the company to regain its former status remains.
Technically the shares have moved to the top of their 4 year range where once again they will attempt to break free and commence a new uptrend. This will need to be supported by fundamentals though. A strong outlook from the company in February could just be the catalyst for a meaningful move higher if achieved, when they report their full year results in August. A miss or a disappointing outlook could see them spend another year gyrating between ~$240 and ~$320.
Disclaimer: This information is provided purely for educational purposes. It takes no account of an individual’s personal financial circumstances and hence can in no way constitute financial advice. The above data may be subject to errors or inconsistencies for which the author takes no liability. It is imperative that all investors do their own research or if they need advice, seek it from a qualified financial adviser.
CSL (ASX:CSL) Analysis

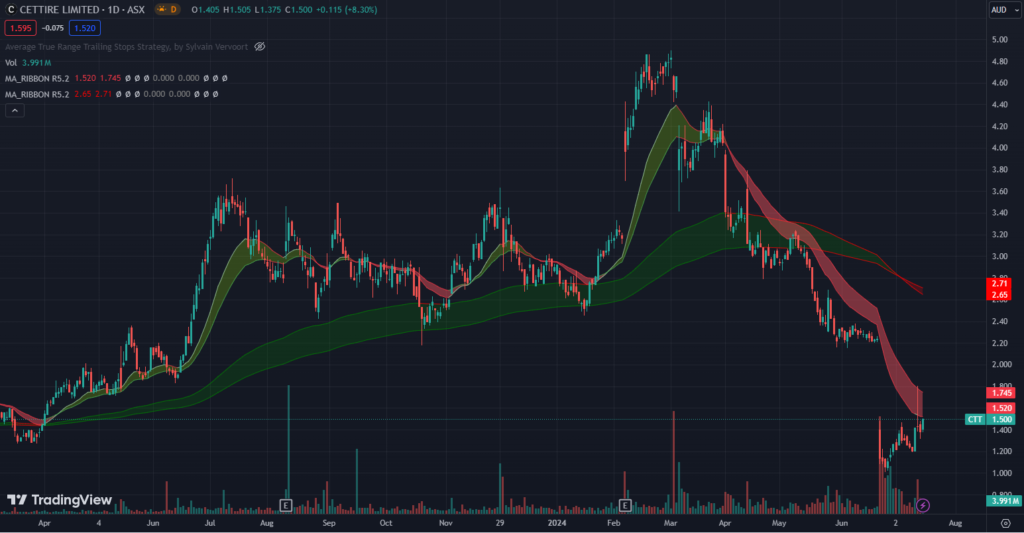
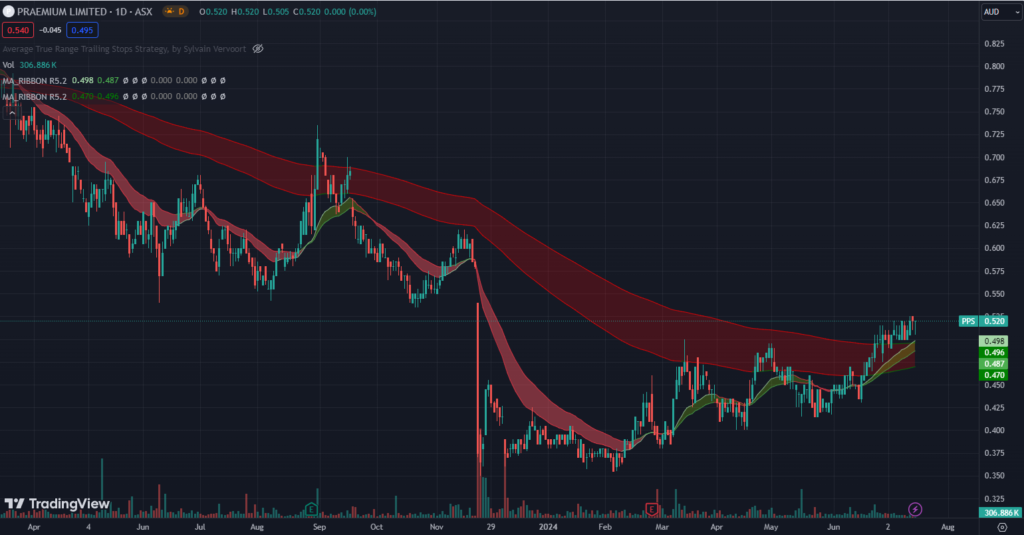
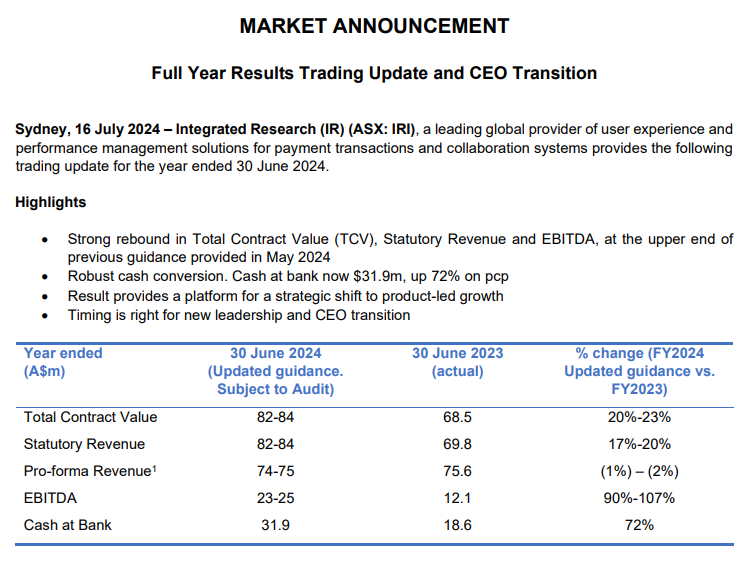
Cettire ASX:CTT has fallen back after the initial enthusiasm of their update. The same can be said for Integrated Research ASX:IRI justifying my belief that it was time to sell them. Global Health ASX:GLH has pushed higher, justifying the initial positive response to their update. Step One ASX:STP has maintained the massive gains it enjoyed on the day. Praemium has grinded around the same levels it fell to after its underwhelming result.

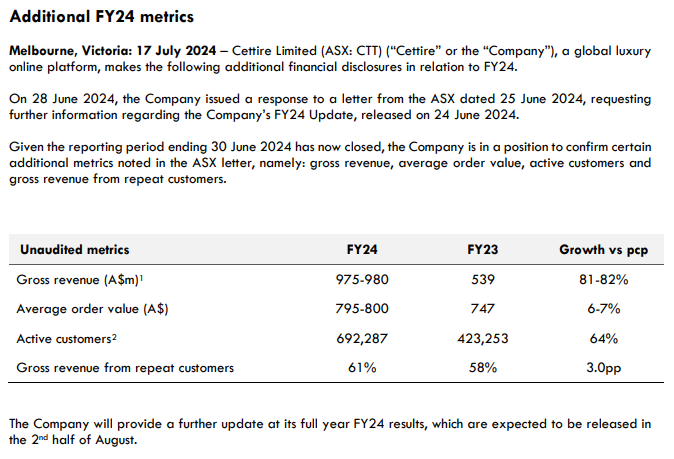
It’s only very early but there’s no surprises here. Clearly the market was looking for more FUM from ASX:PPS. The uncertainty that could be seen in the trading of ASX:IRI has continued today. I had a position in this company from June 2024 which I decided to exit at the open. It was a great result but what comes next looks far more uncertain. The market likes the positive operating cash flows for ASX:GLH. The higher revenues for Cettire ASX:CTT have been received well but as I say it remains to be seen how their profitability is tracking. ASX:STP is the star, with positive momentum continuing in that business.
This appears to be a beat on Revenue (10%) and EBITDA (10%).


This appears to be a beat on Revenue of around 5% although profits are what really matter at this stage for ASX:CTT and as we have learned recently, higher revenues does not necessarily mean they will be higher. The stock has been moving its way up the ASX Short Positions List rankings too which is not a good sign.
Funds under management announcement is out. I won’t post hit here as I don’t know if it is positive or negative. The chart is a good one though so it will be interesting if this latest update can continue to fuel the positive momentum in the share price.

I know nothing about this company but I thought I’d have a quick look at their quarterly. Tiny company with a market cap under $7M. They have had a positive operating cash flow quarter which is a good start. Should they string a few of those together they could be worthy of a closer inspection.

Ugly chart. I doubt one quarter of positive cash flows will be enough to turn that chart around but it certainly shouldn’t see it fall.
This was a good beat but clearly with CEO leaving who has clearly done a good job in recent times leaving, there is some uncertainty for the future. I think that is well demonstrated in the price candle with the shares trading in quite a wide range throughout the day.

Disclaimer: This information is provided purely for educational purposes. It takes no account of an individual’s personal financial circumstances and hence can in no way constitute financial advice. The above data may be subject to errors or inconsistencies for which the author takes no liability. It is imperative that all investors do their own research or if they need advice, seek it from a qualified financial adviser.
Announcements July 17
This is a restricted members post.