This content is restricted to Supporters. Please Sign In.
Not a member? Follow the for a Free 14 Day Trial (no credit card required).
This content is restricted to Supporters. Please Sign In.
Not a member? Follow the for a Free 14 Day Trial (no credit card required).
This content is restricted to Supporters. Please Sign In.
Not a member? Follow the for a Free 14 Day Trial (no credit card required).
This content is restricted to Supporters. Please Sign In.
Not a member? Follow the for a Free 14 Day Trial (no credit card required).
This content is restricted to Supporters. Please Sign In.
Not a member? Follow the for a Free 14 Day Trial (no credit card required).
This content is restricted to Supporters. Please Sign In.
Not a member? Follow the for a Free 14 Day Trial (no credit card required).
Forensic Analysis: Paladin Energy Ltd ASX:PDN
🗓️ May, 2025
🌐 Website: https://www.paladinenergy.com.au
Here is a forensic financial analysis of Paladin Energy Ltd (ASX:PDN), based on its FY2024 Annual Report and 1H FY2025 Interim Report.
| Risk Indicator | Status | Comments |
|---|---|---|
| Goodwill >25% of Assets | ✅ | No goodwill reported; intangibles are minor and mainly software-related. |
| Rising Receivables Days | ✅ | Receivables are modest (US$13.5M) vs revenue; no unusual rise observed. |
| Inventory Growth vs Profit | 🟠 | Inventory rose to US$131.4M with restart phase and production ramp-up. |
| High Borrowings | 🔴 | US$198.8M in borrowings including shareholder loans; increased leverage. |
| Loans to Related Parties | ✅ | No related party loans disclosed. |
| Idle Cash | ✅ | Cash reserves (US$165.8M) are being actively deployed; not idle. |
| Risk Indicator | Status | Comments |
|---|---|---|
| Revenue vs Profit Divergence | 🟠 | FY25 H1 revenue grew to US$77.3M but net loss was US$4.6M; margin pressure. |
| Capitalised R&D/Interest | ✅ | No aggressive capitalisation observed; exploration expensed appropriately. |
| Extraordinary Items | 🟠 | US$92M reversal of ore stockpile impairment in FY24 significantly boosted results. |
| Tax Rate Drop | ✅ | No material benefit; no tax payable due to carried-forward losses. |
| Profit vs Cash Flow | ✅ | Operating cash flow turned positive in H1 FY25; aligns with ramp-up progress. |
| One-Off Gains Boosting Profit | 🟠 | FY24 profit driven by one-off reversal; not recurring. |
| Risk Indicator | Status | Comments |
|---|---|---|
| Auditor Changes | ✅ | No changes; PwC remains auditor. |
| Audit Qualifications | ✅ | Clean opinion; no qualifications. |
| Exec Departures | ✅ | Stable executive team through ramp-up and M&A. |
| Transparency Issues | ✅ | Strong disclosure of risks, Fission deal, LHM restart, and ESG. |
| Board Weakness | ✅ | Independent, diverse board; mix of mining and governance skills. |
| Executive Pay Misalignment | ✅ | Incentives linked to milestones including LHM restart and shareholder returns. |
| Promotional Language | 🟠 | Highly bullish tone; some caution warranted given early-stage ramp-up phase. |
| Risk Indicator | Status | Comments |
|---|---|---|
| Chronic Unprofitability | 🟠 | History of losses; FY24 profit was one-off driven. Losses returned in H1 FY25. |
| Revenue < Capex | 🟠 | High capex (US$96.6M FY24) relative to early revenue. Improving post ramp. |
| Funding Dependency | 🔴 | US$70M debt and shareholder loans suggest external capital reliance. |
| Customer Concentration | ✅ | Diverse contract book across US, EU, and Asia; well structured. |
| Pre-commercial Product Risk | ✅ | LHM is operational; no early-stage tech dependence. |
| Short Cash Runway | ✅ | Cash + investments US$165.8M; runway adequate despite negative earnings. |
| Regulatory/Compliance Exposure | ✅ | High compliance standards, no major issues reported. |
| Leadership Turnover During Expansion | ✅ | CEO and team stable during critical transition. |
| Category | 🔴 Red Flags | 🟠 Amber Flags |
|---|---|---|
| Balance Sheet | 1 | 1 |
| Income Statement | 0 | 3 |
| Governance / Disclosure | 0 | 1 |
| Strategic Risk Factors | 1 | 2 |
🔴 Total Red Flags: 2
🟠 Total Amber Flags: 7
Disclaimer: This report is for educational purposes and does not constitute financial advice. It does not account for personal circumstances. All investors should conduct their own research or consult a qualified adviser before making financial decisions.
Forensic Analysis: Paladin Energy ASX:PDN
This content is restricted to Supporters. Please Sign In.
Not a member? Follow the for a Free 14 Day Trial (no credit card required).
This content is restricted to Supporters. Please Sign In.
Not a member? Follow the for a Free 14 Day Trial (no credit card required).
This content is restricted to Supporters. Please Sign In.
Not a member? Follow the for a Free 14 Day Trial (no credit card required).
This content is restricted to Supporters. Please Sign In.
Not a member? Follow the for a Free 14 Day Trial (no credit card required).
This content is restricted to Supporters. Please Sign In.
Not a member? Follow the for a Free 14 Day Trial (no credit card required).
 May 24, 2025
Uranium stocks experienced a sharp surge in U.S. markets overnight, triggered by a combination of policy momentum, geopolitical developments, and supply constraints—all aligning to reinforce the nuclear energy theme.
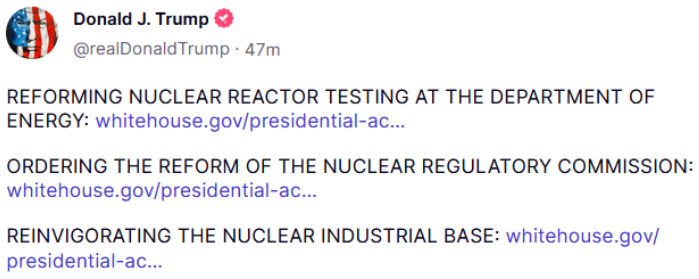
On May 23, President Donald Trump signed a series of executive orders to revitalise the U.S. nuclear sector, with measures that include:
Accelerated permitting for nuclear reactors
Construction of reactors on federal land, including military sites
A mandate for the NRC to issue reactor licenses within 18 months
Strengthening domestic uranium production to reduce reliance on foreign sources, particularly Russia
🧠 Implication: These moves mark a high-level commitment to nuclear energy, with strategic implications for AI infrastructure, defence, and national energy independence.
Kazatomprom, the world’s largest uranium miner, slashed its 2025 production guidance by ~17%, citing:
Sulfuric acid shortages
Delays in new mine development
📉 Impact: With an already tight global supply, this shortfall raises pressure on uranium prices and intensifies the need for alternative sources.
Following the Prohibiting Russian Uranium Imports Act (May 2024), the U.S. has formally banned imports of low-enriched uranium from Russia—a nation that previously supplied ~27% of U.S. enriched uranium needs.
🧭 Strategic Pivot: This forces the U.S. to rapidly build out its enrichment and conversion capacity and forge new trade channels with allies.
The confluence of these factors led to notable gains in uranium-related equities:
Lightbridge Corp (LTBR): +42.68%
Centrus Energy Corp (LEU): +20.46%
Uranium Energy Corp (UEC): +24.42%
Cameco Corp (CCJ): +11.12%
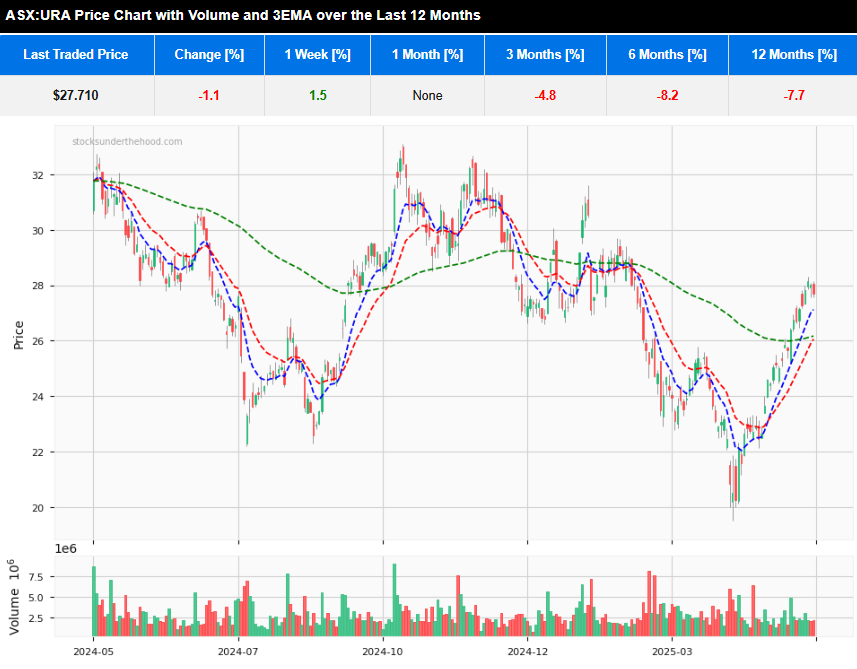
Global X Uranium ETF (URA): +11.62% (accompanied by a surge in volume)
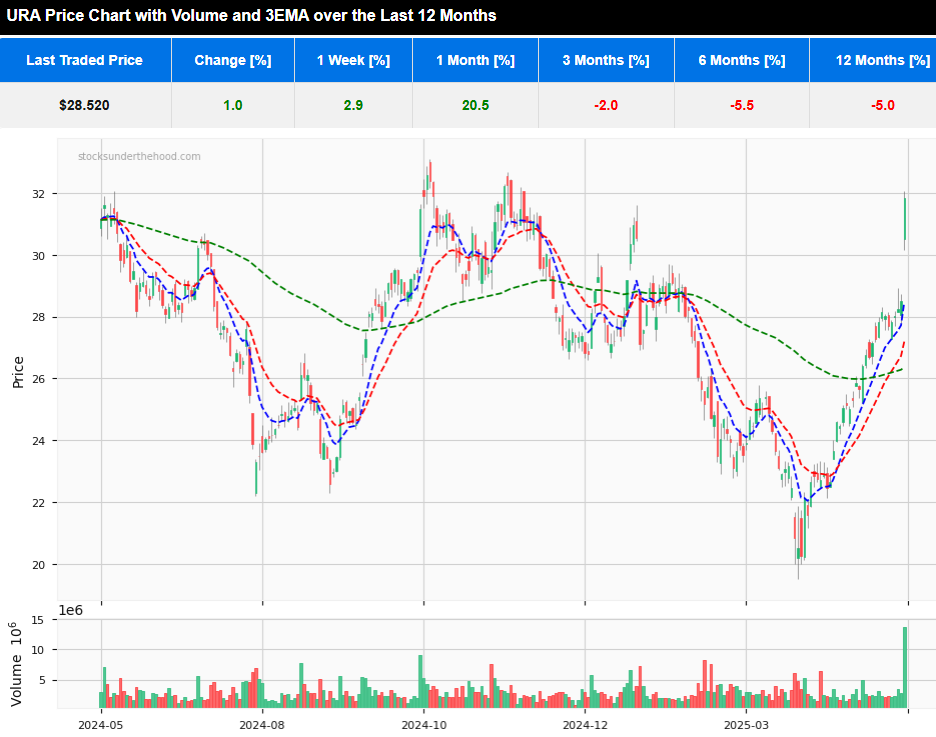
These movements reflect investor optimism about the sector’s prospects amid policy support and supply challenges.
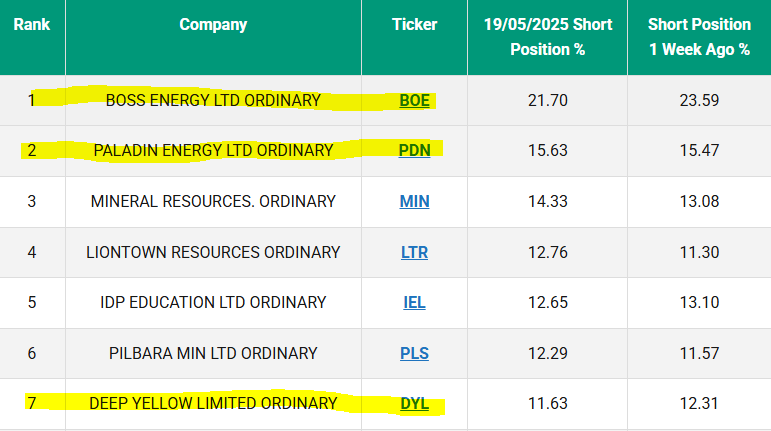
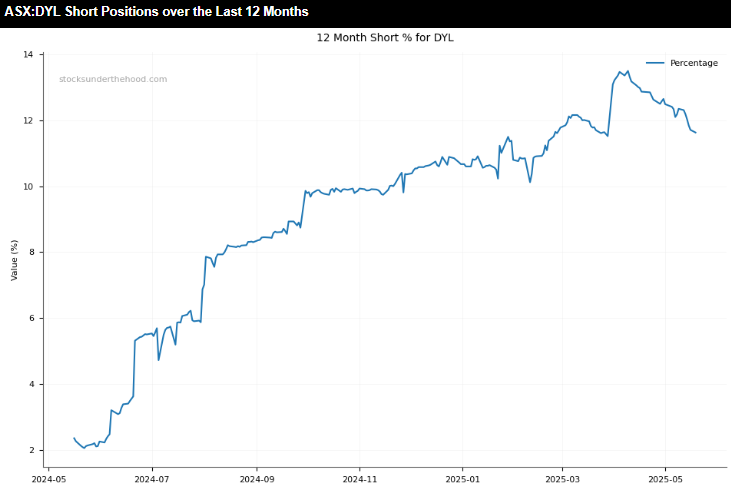
🧠 Observation: While U.S. names are reacting more to policy tailwinds, ASX uranium plays are seeing an overlay of speculative positioning and short interest dynamics.
⚡ Infrastructure & AI Demand
The pivot to AI data centres and defence tech will likely increase baseline electricity demand, making stable nuclear output even more critical.
🌍 Global Energy Transition
As nations pursue decarbonisation, nuclear is re-emerging as a low-emission, baseload power alternative. This secular tailwind is only gaining momentum.
🧪 Enrichment Capacity Bottlenecks
Even with rising uranium output, the Western world’s enrichment capabilities may become the real chokepoint—especially with the Russian supply now inaccessible.
⚠️ Risks to Watch
Delays in regulatory approvals
Project overruns and cost blowouts
Geopolitical flare-ups that disrupt trade
Volatility in spot prices and ETFs
Department of Energy (DOE) updates on uranium procurement
Cameco or Paladin operational guidance revisions
U.S. or EU enrichment facility investments
Next ASIC short position updates (Australia)
Disclaimer: This information is provided purely for educational purposes. It takes no account of an individual’s personal financial circumstances and hence can in no way constitute financial advice. The above data may be subject to errors or inconsistencies for which the author takes no liability. It is imperative that all investors do their own research or if they need advice, seek it from a qualified financial adviser.
Uranium Stocks Surge
📅 May 2025
🌐 Website: www.betmakers.com
Here is the forensic financial analysis of BetMakers Technology Group Ltd (ASX:BET) for FY2024.
📊 Balance Sheet
| Risk Indicator | Status | Comments |
|---|---|---|
| Goodwill >25% of Assets | ✅ No Flag | Goodwill and intangibles totaled $59.1M vs net assets of $111.6M; while high, net tangible assets remain positive. |
| Rising Receivables Days | ✅ No Flag | Receivables analysis not directly disclosed; no abnormal growth trends evident. |
| Inventory Growth vs Profit | ✅ No Flag | Not applicable — company operates a service-based model with no inventory. |
| High Borrowings | ✅ No Flag | Debt levels not highlighted as concerning; no breach of covenants noted. |
| Loans to Related Parties | ✅ No Flag | No related party loans reported. |
| Idle Cash | ✅ No Flag | Company actively investing in technology and acquisitions, no sign of idle cash. |
📈 Income Statement
| Risk Indicator | Status | Comments |
|---|---|---|
| Revenue vs Profit Divergence | 🔴 Red Flag | Revenue flat at $95.2M, yet net loss remains high at $38.7M; profit performance not improving despite cost resets. |
| Capitalised R&D/Interest | 🟠 Amber Flag | $6.3M capitalised for “Next Gen” platform; no capitalisation in FY23, indicating a change in policy. |
| Extraordinary Items | 🟠 Amber Flag | Impairments and valuation gains/losses present but reduced vs prior year. Still material to profit fluctuations. |
| Tax Rate Drop | ✅ No Flag | Deferred tax asset of $20.1M affects result, but not a drop in effective tax rate per se. |
| Profit vs Cash Flow | 🟠 Amber Flag | While EBITDA loss improved (–$7.2M vs –$27.8M), cash flow not explicitly detailed; still operating at a net loss. |
| One-Off Gains Boosting Profit | ✅ No Flag | No clear revenue boosts from asset sales or other one-off gains. |
🏛️ Governance, Disclosure & Audit
| Risk Indicator | Status | Comments |
|---|---|---|
| Auditor Changes | ✅ No Flag | Audit opinion unmodified; no auditor changes. |
| Audit Qualifications | ✅ No Flag | Clean audit opinion issued. |
| Exec Departures | 🔴 Red Flag | CFO Anthony Pullin resigned March 2024; replaced in June by Carl Henschke. |
| Transparency Issues | ✅ No Flag | Disclosures comprehensive and consistent. |
| Board Weakness | ✅ No Flag | Board includes skilled and diverse non-executive directors. |
| Executive Pay Misalignment | 🔴 Red Flag | High share-based payments despite ongoing losses (e.g., $1.42M to Todd Buckingham for rights vesting). |
| Promotional Language | 🟠 Amber Flag | Optimistic tone (“transformation”, “significant progress”) not yet backed by profitability or revenue growth. |
✅ Final Summary
| Category | 🔴 Red Flags | 🟠 Amber Flags |
|---|---|---|
| Balance Sheet | 0 | 0 |
| Income Statement | 1 | 3 |
| Governance / Disclosure | 2 | 1 |
🔴 Total Red Flags: 3
🟠 Total Amber Flags: 4
🟠 Amber & 🔴 Red Flag Overview
Persistent Net Losses: Flat revenue with $38.7M net loss raises questions about scalability and unit economics.
Capitalised Development Costs: Newly adopted capitalisation ($6.3M for “Next Gen”) raises concerns about consistency and comparability.
Executive Remuneration: High equity-based awards granted despite poor shareholder returns and losses.
Management Turnover: Recent CFO change amid restructuring adds to governance risk.
Optimistic Outlook vs Financial Reality: “Turnaround” narrative is not yet substantiated by revenue or profit performance.
Overall, BetMakers presents a high-risk profile typical of turnaround-stage tech firms, with execution risk remaining elevated.
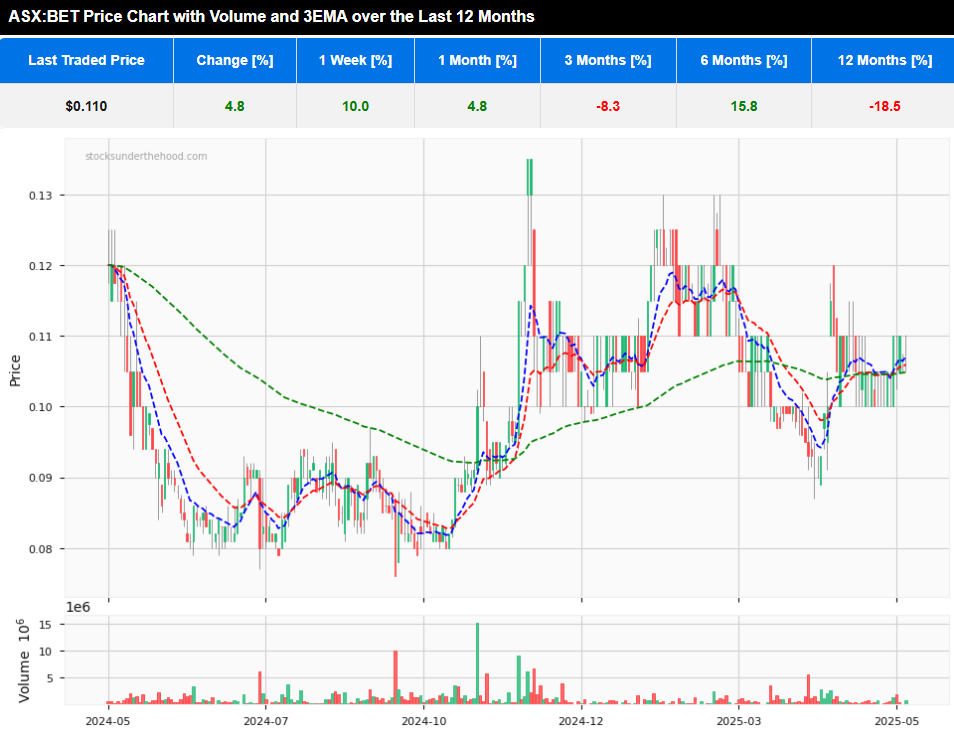
Trend Analysis: BetMakers Technology Group Ltd (ASX:BET): Comparing FY2024 Annual Report with 1H FY2025 Interim Report
📉 Financial Deterioration Indicators
Revenue Decline: Revenue dropped 19.4% to $41.4M in 1H FY25 (vs. $51.4M in 1H FY24), showing weakening top-line momentum and client attrition.
Widening Losses: Net loss widened to $17.1M from $13.5M in pcp — indicating no clear path to profitability yet.
Net Tangible Assets Per Share: Fell sharply from 8.56c (1H FY24) to 3.63c (1H FY25) — reflects significant value erosion.
Cash Burn: Operating cash flow turned negative ($5.4M outflow vs. $2.4M inflow in 1H FY24); cash dropped from $29.3M to $20.9M in just six months.
Related Party Borrowings Introduced: A new $3.2M related party loan at 12% interest — potentially expensive funding reflecting capital strain.
Rising Debt: Borrowings increased from nil to $3.2M, though total liabilities stayed relatively flat.
Accumulated Losses: Increased from $203.5M to $222.0M, pushing net assets down by ~15% in six months.
🔧 Operational Adjustments
Cost Base Reset Continues: Employee costs down significantly ($18.4M vs $24.7M pcp); headcount reduced from 383 to 338.
Adjusted EBITDA: Slight improvement to –$1.3M (vs –$1.4M); still negative, but impact of restructuring and margin control is starting to show.
Capex Focused on Software: $3.8M capitalised into software development in 1H FY25; reflects ongoing reliance on intangible build-up.
Platform Migration: Australian clients transitioned to Apollo (Next Gen) platform — expected cloud savings in 2H FY25.
Segment Pressure: Revenue dropped in both segments: Global Betting Services (–24.6%) and Global Tote (–15.1%).
🔭 Strategic Shifts & Positive Signals
Expansion Initiatives:
Bet365 launched fixed odds racing in NJ & CO — early monetisation of platform IP.
Contract with Sportradar post-period — global distribution leverage of AdVantage platform.
New launches in Asia and ADW upgrade (GTX) on track — should reduce infrastructure costs.
Gross Margin Maintenance: 59.7% gross margin in 1H FY25 (vs. 64.4% in 1H FY24); though lower, still robust given revenue decline.
📌 Conclusion: Position Appears Eroding
Despite structural improvements and platform upgrades, BetMakers’ core financial metrics have deteriorated in 1H FY25. The topline contraction, deepening losses, dilution of tangible equity, and new high-cost related party debt reflect a weaker operational position relative to FY2024.
While some cost efficiencies are evident, the company remains in a vulnerable phase with persistent negative cash flows and a dependence on internally generated intangible assets for future growth. Execution of new strategic partnerships will be critical to stabilise and recover momentum by FY26.
Quarterly Progress Evaluation – Q3 FY2025: Based on: FY2024 Annual Report, 1H FY2025 Interim Report, and April 2025 Quarterly Update Presentation
📊 Performance Improvement Indicators
Revenue Growth Resumed: Q3 FY25 revenue rose 3.7% QoQ, reversing the 19.4% YoY decline noted in 1H FY25.
Gross Margin Recovery: Gross margin improved to 63.9% in Q3 FY25 (vs 59.7% in 1H FY25 and 57.8% in Q1 FY25), signaling cost base leverage from technology upgrades (e.g., Apollo).
Adjusted EBITDA Turned Positive: Achieved $1.2M Adjusted EBITDA in Q3 FY25 — first meaningful positive result after multi-period losses (e.g., –$28M FY23; –$1.3M in 1H FY25).
Positive Operating Cash Flow: Q3 FY25 generated $3.0M in operating cash flow vs a $5.4M outflow in 1H FY25.
Annualised Cost Base Compression: Now $53.9M, down from $65.3M FY24 — supports sustained profitability if revenue stabilises or grows.
⚠️ Remaining Risks and Considerations
Revenue Still Below Prior Year: Even with QoQ growth, revenue remains significantly below prior periods (e.g., $95M in FY23 vs annualised ~$83M now).
Dependence on Capitalised Costs: EBITDA improvement still includes capitalised costs, which masks underlying cash burn if sustained.
Market Confidence Lagging: Despite improving metrics, BET’s market cap and share price remain depressed, reflecting investor caution.
Loan Still Outstanding: Related party loan ($3.2M at 12% interest) remains a risk unless repaid from ongoing positive cash flows.
📌 Conclusion: Trajectory: Improving
The Q3 FY25 results mark a genuine financial inflection point for BetMakers. For the first time in recent periods, the company posted positive adjusted EBITDA and operating cash flow. Gross margin recovery and ongoing cost reductions show that restructuring is yielding results.
However, revenue base needs to grow sustainably to confirm a turnaround, and the business remains exposed to execution risk — particularly in monetising new partnerships (e.g., Sportradar) and launching GTX platform products.
BetMakers is transitioning from erosion to potential recovery, but consistent quarterly delivery is needed to maintain credibility.
Commentary on May 2025 Trading Update: In Context of FY2024, 1H FY2025, Q3 FY2025, and Strategic Developments
📈 Ongoing Positive Momentum
The May 2025 trading update confirms that BetMakers’ turnaround is gaining traction, reinforcing earlier Q3 signals of financial and operational improvement:
April 2025 Performance:
Adjusted EBITDA: $0.88M for April (excluding $0.45M capitalised costs)
Gross Margin: 65.2% — up from 63.9% in Q3 FY25, moving closer to 70% target
Free Cash Flow: Positive — confirms operational cash generation is continuing
Technology Execution:
Apollo Platform Uptake: Monthly bets up 50% and active users up 35% (March–Sept 2025 comparison)
GTX Platform: Pre-launch stage, positioned to replicate Apollo’s margin-enhancing effects in the tote segment
Strategic Partnerships: Deployment success and collaboration with Sky Racing, along with the Sportradar partnership, are beginning to translate into real user growth and market reach.
🔎 Forensic Financial Observations
| Area | Status | Commentary |
|---|---|---|
| Operating Cash Flow | ✅ Positive | April and Q3 both posted positive cash flow, a major reversal from past years. |
| Profitability | 🟢 Improving | Adjusted EBITDA turning positive consistently is a clear shift. |
| Gross Margins | 🟢 Improving | 65.2% in April indicates ongoing margin expansion. |
| Product Maturity | 🟢 Improving | Apollo benefits now visible in financials; GTX nearing monetisation. |
| Balance Sheet | 🟠 Watch | No new details, but earlier risk factors (e.g. related party loan, goodwill) still apply until FY25 report. |
📌 Conclusion: Inflection Confirmed, Trajectory Upward
BetMakers is now showing sustained operational progress, driven by:
Strategic product launches (Apollo, GTX)
Margin discipline and cost base reset
Market validation through usage metrics and partner traction
While the business still carries legacy balance sheet concerns and remains reliant on technology execution, this update reinforces the narrative that BetMakers has exited erosion phase and is now in early-stage recovery with tangible commercial traction.
FY25 results will be pivotal to confirm full-year positive cash flow and profitability trend, but based on current performance, the risk profile is improving.
Here is a released today from Ord Minnett in response to the latest update from BetMakers.
bet-update-ordminnett-23052025
Disclaimer: This information is provided purely for educational purposes. It takes no account of an individual’s personal financial circumstances and hence can in no way constitute financial advice. The above data may be subject to errors or inconsistencies for which the author takes no liability. It is imperative that all investors do their own research or if they need advice, seek it from a qualified financial adviser.
Deep Dive: BetMakers Technology ASX:BET
📅 May 2025
🌐 Website: www.catapultsports.com
Here is the forensic financial analysis of Catapult Group International Ltd (ASX:CAT) for FY2025.
📊 Balance Sheet
| Risk Indicator | Status | Comments |
|---|---|---|
| Goodwill >25% of Assets | 🔴 Red Flag | Goodwill is $51.26m, or ~31% of total assets ($165.89m); exceeds the 25% risk threshold. |
| Rising Receivables Days | ✅ No Flag | Receivables days improved from 44.1 (FY24) to 38.4 (FY25); well below 90-day threshold. |
| Inventory Growth vs Profit | 🟠 Amber Flag | Inventory rose 122% YoY, while net losses declined but not proportionately. |
| High Borrowings | ✅ No Flag | Debt-to-equity ratio is only 0.043; borrowings reduced significantly from prior year. |
| Loans to Related Parties | ✅ No Flag | No related party loans or advances disclosed. |
| Idle Cash | ✅ No Flag | Cash balance ($10.76m) stable and appears actively managed with debt repayments. |
📈 Income Statement
| Risk Indicator | Status | Comments |
|---|---|---|
| Revenue vs Profit Divergence | ✅ No Flag | Revenue grew 16.5% while net loss improved 47%; no divergence. |
| Capitalised R&D/Interest | 🟠 Amber Flag | R&D capitalisation disclosed; justified for SaaS model but warrants ongoing scrutiny. |
| Extraordinary Items | ✅ No Flag | No recurring or significant one-off items noted. |
| Tax Rate Drop | ✅ No Flag | Shift to tax benefit driven by deferred tax and share-based adjustments. |
| Profit vs Cash Flow | ✅ No Flag | Strong operating cash flow ($38.45m) vs. net loss ($8.81m); positive sign. |
| One-Off Gains Boosting Profit | ✅ No Flag | No material asset sales or revaluations influencing earnings. |
🏛️ Governance, Disclosure & Audit
| Risk Indicator | Status | Comments |
|---|---|---|
| Auditor Changes | ✅ No Flag | Ernst & Young remains the auditor; no changes noted. |
| Audit Qualifications | ✅ No Flag | Clean, unqualified audit opinion provided. |
| Exec Departures | ✅ No Flag | No unexpected CEO/CFO resignations. |
| Transparency Issues | ✅ No Flag | Disclosures consistent, with strong detail across all areas. |
| Board Weakness | ✅ No Flag | Board includes experienced professionals with diverse backgrounds. |
| Executive Pay Misalignment | 🔴 Red Flag | Exec comp up 19% despite ongoing losses; indicates misalignment with shareholder value. |
| Promotional Language | ✅ No Flag | Management tone balanced and aligned with performance metrics. |
✅ Final Summary
| Category | 🔴 Red Flags | 🟠 Amber Flags |
|---|---|---|
| Balance Sheet | 1 | 1 |
| Income Statement | 0 | 1 |
| Governance / Disclosure | 1 | 0 |
🔴 Total Red Flags: 2
🟠 Total Amber Flags: 2
🟠 Amber & 🔴 Red Flag Overview
Goodwill Load: At ~31% of assets, goodwill is elevated and may require future impairment scrutiny.
Inventory vs Profit: Inventory rose disproportionately to net profit gains, posing a risk if demand falters.
Capitalisation Practices: While standard for SaaS firms, R&D capitalization should be reviewed for consistency.
Executive Compensation: Compensation increases outpaced financial improvements, raising alignment concerns.
Disclaimer: This information is provided purely for educational purposes. It takes no account of an individual’s personal financial circumstances and hence can in no way constitute financial advice. The above data may be subject to errors or inconsistencies for which the author takes no liability. It is imperative that all investors do their own research or if they need advice, seek it from a qualified financial adviser.
Forensic Analysis: Catapult FY25
This content is restricted to Supporters. Please Sign In.
Not a member? Follow the for a Free 14 Day Trial (no credit card required).
Commonwealth Bank of Australia (CBA), commonly known as CommBank, is a leading Australian multinational bank headquartered in Sydney. Established in 1911, it has grown to become the largest bank in Australia by total assets and market capitalization. CBA offers a comprehensive range of financial services, including retail, business, and institutional banking, as well as wealth management, insurance, and investment services.
CBA’s strategy focuses on:
Customer-Centric Approach: Prioritizing customer needs and experiences to build long-term relationships.
Digital Innovation: Investing in technology to enhance digital banking services and operational efficiency.
Sustainable Growth: Emphasizing responsible lending and investment practices to support long-term financial stability.
Risk Management: Maintaining a strong risk management framework to ensure financial resilience.
This approach aims to deliver consistent shareholder returns while adapting to evolving market conditions.
CBA operates through several key business segments:
Retail Banking Services: Provides personal banking products and services, including home loans, credit cards, and savings accounts.
Business Banking: Offers financial solutions to small and medium-sized enterprises, including lending, deposits, and merchant services.
Institutional Banking and Markets: Caters to large corporate and government clients with services like transaction banking, capital markets, and risk management.
Wealth Management: Includes superannuation, investment, and insurance products.
International Operations: Operates in New Zealand through its subsidiary ASB Bank and has a presence in Asia, the UK, and the US.
While CBA’s primary market is Australia, it has diversified its operations geographically:
New Zealand: Services provided through ASB Bank.
Asia, UK, and US: Offers banking and financial services to support clients with international needs.
Sector-wise, CBA’s diversification spans retail banking, business banking, institutional services, wealth management, and insurance, allowing it to mitigate risks associated with market fluctuations.
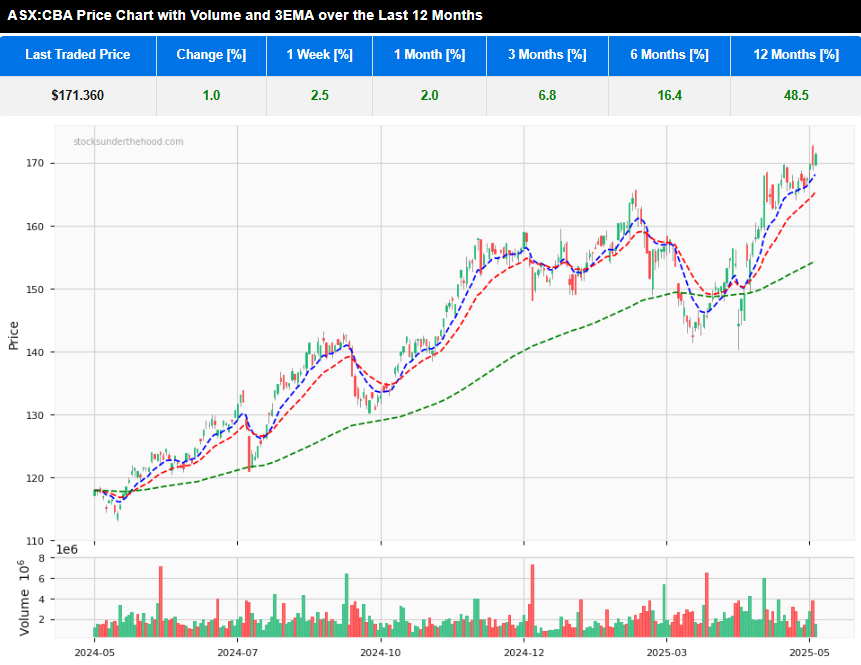
CBA has demonstrated strong financial performance, with a notable increase in share price and solid profitability metrics.
Regulatory Environment: As one of Australia’s “Big Four” banks, CBA operates under stringent regulatory oversight, which can impact operational flexibility.
Economic Conditions: Interest rate fluctuations and economic downturns can affect loan demand and asset quality.
Technological Disruption: The rise of fintech companies presents competitive challenges, necessitating continuous innovation.
Reputation Management: Past controversies require ongoing efforts to maintain and rebuild public trust.
Disclaimer: This information is provided purely for educational purposes. It takes no account of an individual’s personal financial circumstances and hence can in no way constitute financial advice. The above data may be subject to errors or inconsistencies for which the author takes no liability. It is imperative that all investors do their own research or if they need advice, seek it from a qualified financial adviser.
Overview: Commonwealth Bank ASX:CBA
Website: https://www.macquarie.com.au/
Macquarie Group Limited is a diversified global financial services firm headquartered in Sydney, Australia. Established in 1969, Macquarie operates in over 30 markets worldwide, offering services across asset management, banking, advisory, risk, and capital solutions.
Macquarie’s strategy emphasizes:
Diversification: Operating across various financial services sectors to mitigate risk.
Global Reach: Generating approximately two-thirds of its earnings from international markets.
Risk Management: Maintaining a strong balance sheet and conservative risk approach.
Innovation: Investing in infrastructure, renewable energy, and digital banking solutions.
Macquarie operates through four main business segments:
Macquarie Asset Management (MAM): Provides investment solutions across real assets, real estate, credit, equities, and multi-asset strategies.
Banking and Financial Services (BFS): Offers personal banking, wealth management, and business banking services in Australia.
Commodities and Global Markets (CGM): Engages in trading and hedging activities across commodities, fixed income, currencies, and equities.
Macquarie Capital: Specializes in advisory and capital raising services, as well as principal investments.
Macquarie’s operations span:
Geographies: Australia, the Americas, Europe, the Middle East, Africa, and Asia.
Sectors: Financial services, infrastructure, energy, commodities, and technology.
This diversification allows Macquarie to capitalize on global opportunities and mitigate region-specific risks.
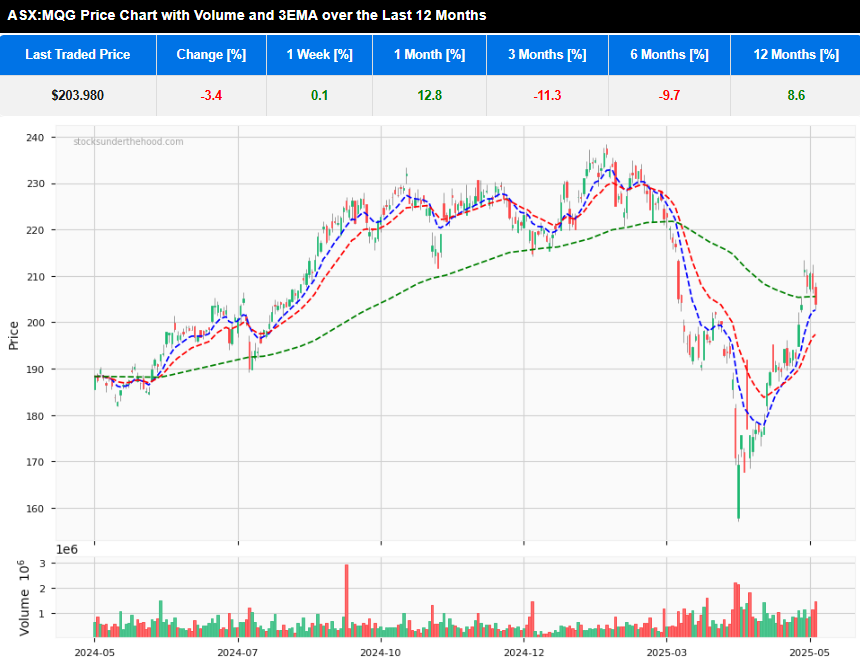
Regulatory Scrutiny: Macquarie faces regulatory challenges, including recent actions by ASIC related to compliance failures in short-selling and derivatives reporting.
Market Volatility: Earnings from market-facing businesses like CGM can be affected by global economic conditions and commodity price fluctuations.
Strategic Divestments: The sale of its North American and European public investments business to Nomura indicates a strategic shift towards focusing on alternative assets and private markets.
In May 2025, ASIC initiated civil proceedings against Macquarie Securities (Australia) Limited (MSAL), alleging the misreporting of up to 1.5 billion short sale transactions over a 14-year period. These discrepancies, attributed to unresolved software errors, potentially distorted short sale volumes by an average of 12%, and in some cases by over 50%, affecting at least 321 securities. Despite self-reporting the issue in late 2022, ASIC criticized Macquarie for its inadequate response and is seeking financial penalties, with estimates suggesting fines could reach up to A$783 million.
In May 2025, ASIC imposed additional conditions on Macquarie Bank’s Australian financial services licence due to significant compliance failures in its futures dealing and over-the-counter (OTC) derivatives trade reporting. These issues included the misreporting of over 375,000 OTC derivative transactions and failures in detecting and preventing suspicious trading activities. ASIC’s intervention requires Macquarie to develop a remediation plan, appoint an independent expert to assess the plan’s adequacy, and ensure the effectiveness of remediation activities to prevent future occurrences.
ASIC Chairman Joe Longo has expressed deep concerns over Macquarie’s repeated compliance failures, describing the firm’s approach as exhibiting “complacency and hubris.” He emphasized that Macquarie’s inadequate remediation of long-standing issues necessitated additional licence conditions and legal action. ASIC’s actions reflect a broader concern about the firm’s risk management culture and its ability to uphold market integrity.
Macquarie has acknowledged the regulatory actions and stated that it has taken steps to address the identified issues, including self-reporting problems and implementing additional controls. The firm has consented to the imposed licence conditions and is cooperating with ASIC’s investigations. Macquarie asserts its commitment to compliance and is investing in programs to strengthen its systems and controls across the group.
These regulatory challenges pose significant reputational and financial risks for Macquarie. Potential fines, increased compliance costs, and the need for systemic reforms could impact the firm’s profitability and operational focus. Investors should closely monitor Macquarie’s remediation efforts and any further regulatory developments that may affect the company’s performance and standing in the financial markets.
Disclaimer: This information is provided purely for educational purposes. It takes no account of an individual’s personal financial circumstances and hence can in no way constitute financial advice. The above data may be subject to errors or inconsistencies for which the author takes no liability. It is imperative that all investors do their own research or if they need advice, seek it from a qualified financial adviser.
Overview: Macquarie Group ASX:MQG
Website: https://www.ltresources.com.au/
Liontown Resources Limited is an Australian-based battery minerals company focused on the exploration, development, and production of lithium assets. The company’s flagship project is the Kathleen Valley Lithium Project in Western Australia, which has recently commenced production.
Liontown aims to become a leading supplier of battery-grade lithium to support the global energy transition. The company’s strategy includes:
Developing Tier-1 Lithium Assets: Focusing on high-quality, long-life lithium projects like Kathleen Valley.
Strategic Partnerships: Securing long-term offtake agreements with major players in the electric vehicle and battery sectors, including LG Energy Solution, Tesla, and Ford.
Downstream Integration: Exploring opportunities to upgrade spodumene concentrate to higher-value lithium products through potential integrated refinery projects.
Liontown’s key assets include:
Kathleen Valley Lithium Project: Located in Western Australia, this project is a significant hard-rock lithium deposit. The company commenced production in July 2024 and has since shipped its first batch of lithium concentrate to China.
Buldania Lithium Project: Also situated in Western Australia, Buldania is an early-stage lithium project with potential for future development.
Liontown’s operations are primarily based in Western Australia, a region known for its rich mineral resources and established mining infrastructure. The company’s focus on lithium positions it within the critical minerals sector, essential for electric vehicles and renewable energy storage solutions.
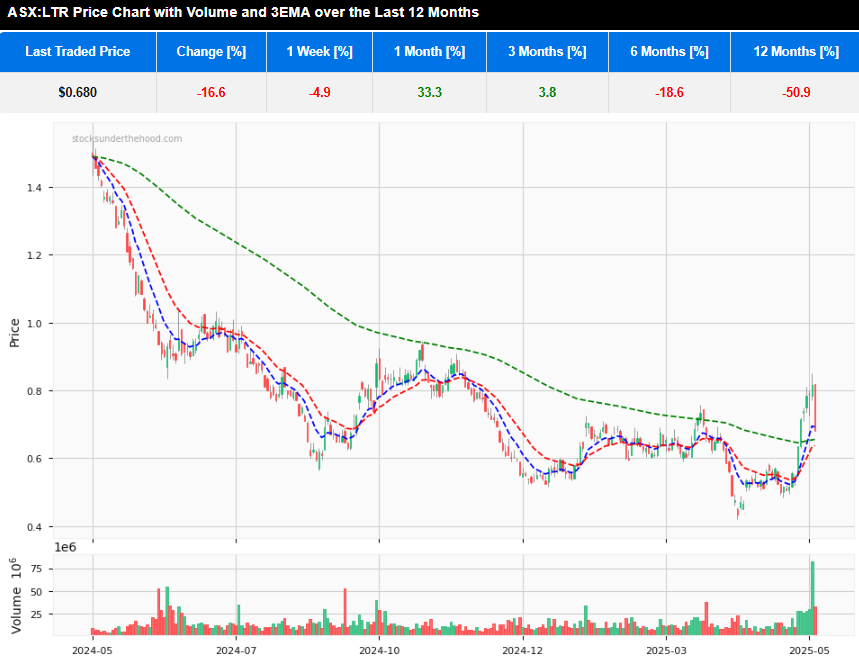
The company has recently achieved significant milestones, including the commencement of underground production and improvements in processing efficiency at Kathleen Valley.
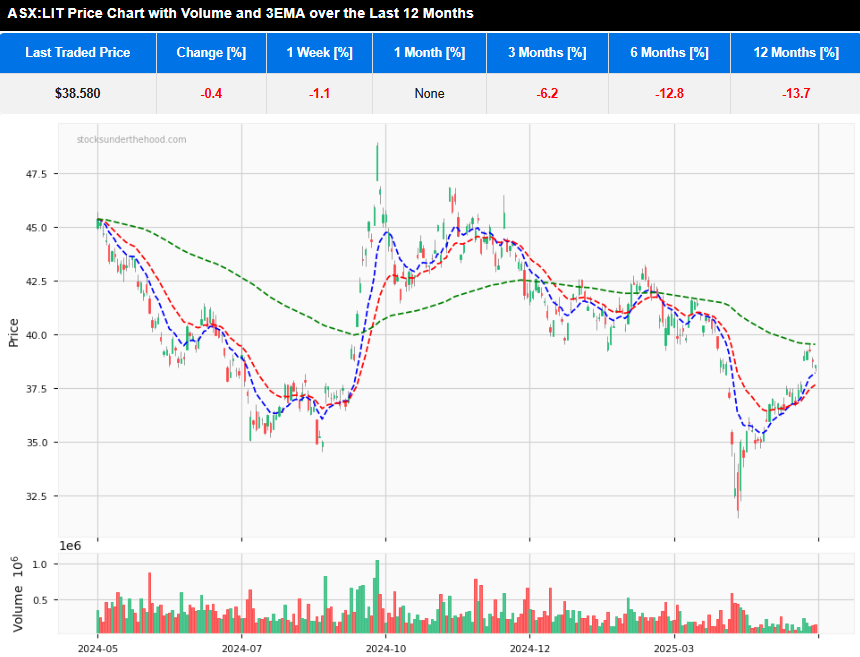
The recent increase in share price for Liontown has corresponded with a broader upward move for the sector as indicated by the Global X Lithium & Battery Tech ETF.
Market Volatility: The lithium market has experienced price fluctuations, which can impact revenue and profitability.
Operational Risks: As a company transitioning from development to production, Liontown faces challenges associated with ramping up operations and achieving consistent output.
Capital Requirements: Ongoing development and expansion efforts may require additional funding, subjecting the company to financing risks.
Disclaimer: This information is provided purely for educational purposes. It takes no account of an individual’s personal financial circumstances and hence can in no way constitute financial advice. The above data may be subject to errors or inconsistencies for which the author takes no liability. It is imperative that all investors do their own research or if they need advice, seek it from a qualified financial adviser.
Overview: Liontown Resources ASX:LTR
This content is restricted to Supporters. Please Sign In.
Not a member? Follow the for a Free 14 Day Trial (no credit card required).
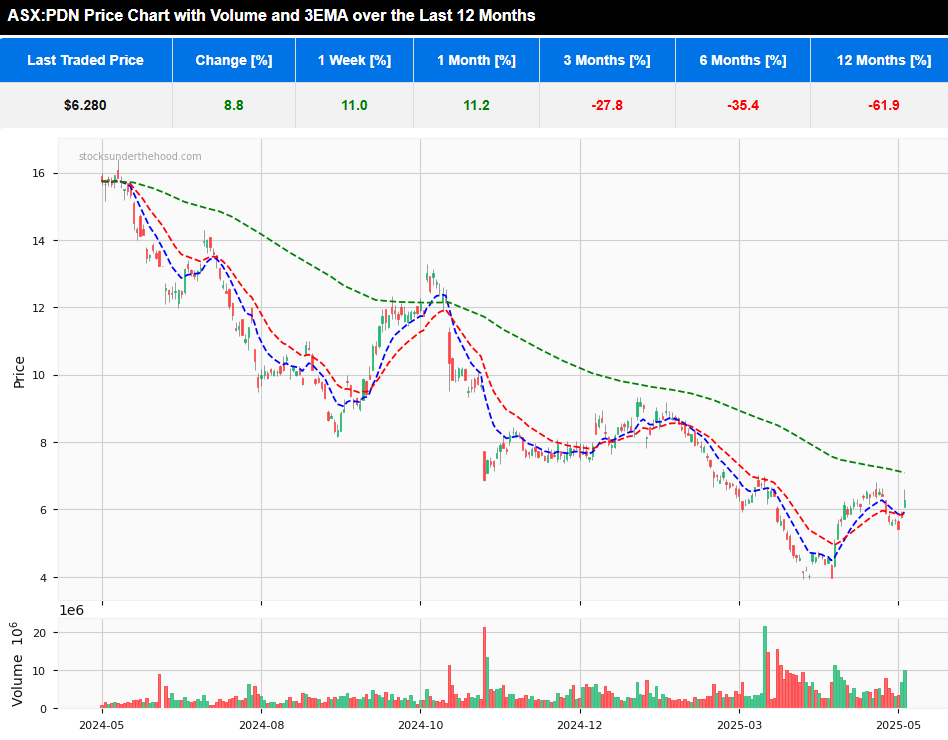
Website: https://www.paladinenergy.com.au/
Paladin Energy Ltd is an Australian-based uranium production and exploration company. The company is primarily known for its 75% stake in the Langer Heinrich Mine (LHM) in Namibia, a significant uranium operation. Paladin also holds a diversified portfolio of uranium exploration and development assets in Australia and Canada.
Paladin’s strategy focuses on:
Restarting and ramping up production at LHM to capitalize on the growing demand for uranium.
Diversifying its asset base through acquisitions, such as the recent purchase of Fission Uranium in Canada, to strengthen its position in key uranium markets.
Maintaining financial flexibility to navigate the cyclical nature of the uranium market.
Paladin’s key assets include:
Langer Heinrich Mine (Namibia): A calcrete-type uranium deposit that resumed production in March 2024. The mine is undergoing a ramp-up phase, with plans to reach nameplate capacity by the end of 2026.
Fission Uranium (Canada): Acquired in a $1.5 billion deal, Fission’s Patterson Lake South project adds significant resources to Paladin’s portfolio. The acquisition was approved by Canadian authorities with conditions to limit Chinese influence.
Australian Projects: Including the Manyingee and Carley Bore projects in Western Australia and several exploration sites in Queensland.
Paladin’s operations span:
Africa: Langer Heinrich Mine in Namibia.
North America: Fission Uranium’s assets in Canada.
Australia: Exploration and development projects in Western Australia and Queensland.
This geographic diversification positions Paladin to supply uranium to various global markets, including North America, Europe, and Asia.
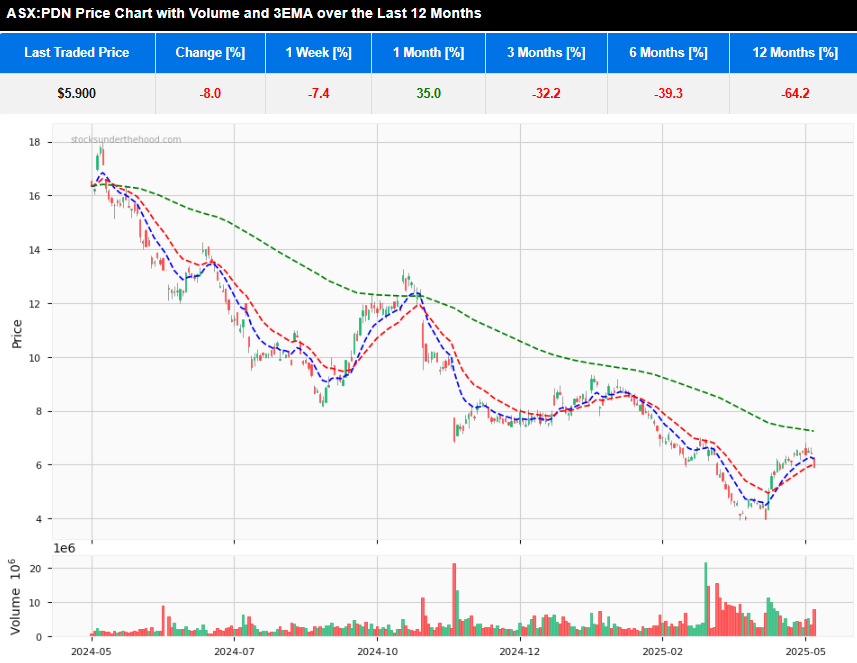
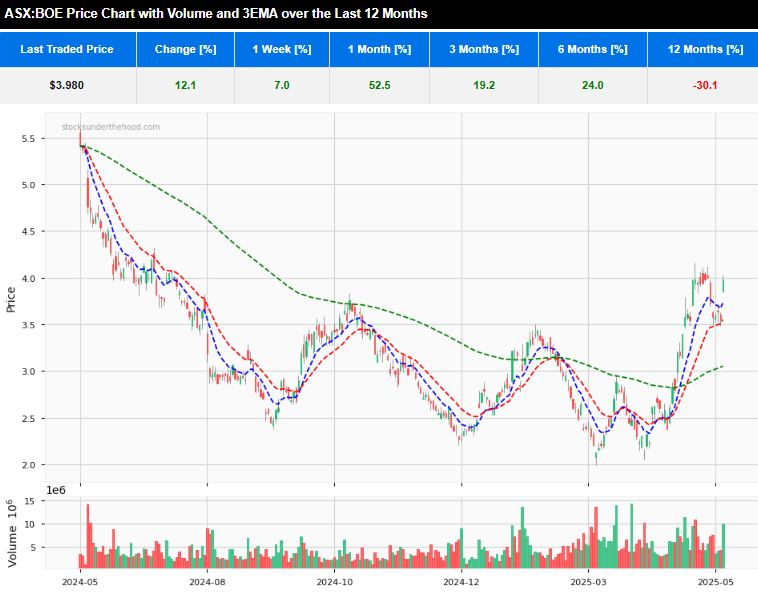
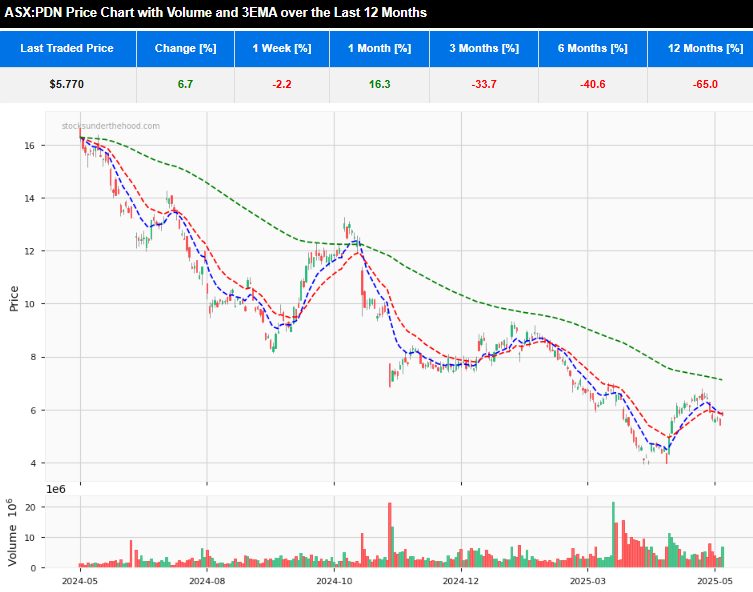
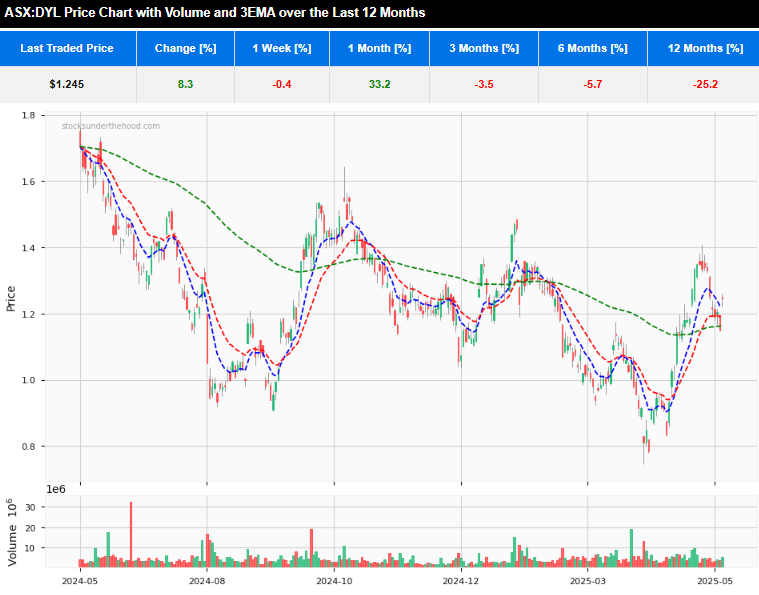
The company has experienced significant share price volatility, influenced by operational updates and broader market dynamics.
Comparing the two charts, it can be seen that Paladin has underperformed the Global X Uranium ETF.
Operational Challenges: The ramp-up at LHM has faced issues, including water supply disruptions and ore grade variability, leading to revised production guidance for FY2025.
Market Volatility: Paladin’s share price has been subject to fluctuations, reflecting both company-specific developments and uranium market trends.
Regulatory Environment: The acquisition of Fission Uranium came with stipulations from Canadian authorities to limit Chinese influence, highlighting the geopolitical sensitivities in the uranium sector.
Disclaimer: This information is provided purely for educational purposes. It takes no account of an individual’s personal financial circumstances and hence can in no way constitute financial advice. The above data may be subject to errors or inconsistencies for which the author takes no liability. It is imperative that all investors do their own research or if they need advice, seek it from a qualified financial adviser.
Overview: Paladin Energy ASX:PDN