Author: Nathan

Current ASX Technical View

Current ASX Technical View – April 26, 2025

Current ASX Technical View: Weekly candlestick chart of the XJO200 (ASX 200) index from Q2 2023 to Q2 2025, showing an upward channel break, a five-wave Elliott pattern peaking at 8514, followed by an ABC corrective decline to 7340. A 3-bar reversal pattern has formed near major support. Key resistance levels at 7910 and 8083 are marked, along with RSI momentum displayed below the price chart.

1. Big Picture Context

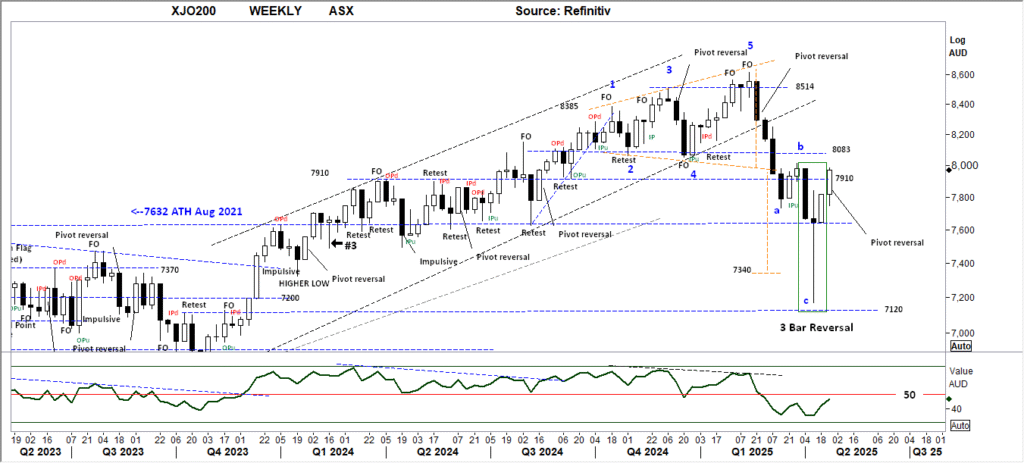
  • Rising Channel: The market was trending within a well-defined upward-sloping channel from Q4 2023 through late 2024, marked by higher highs and higher lows.

  • Completed 5-Wave Structure: There’s a labeled Elliott Wave 5 top at 8514, then a sharp breakdown — classic behavior once a 5-wave sequence matures.

  • Break of Structure: The channel was broken decisively downwardnot a subtle leak, but a fast impulsive break. That’s a major bearish signal.


2. Current Pattern

  • ABC Correction: The chart now shows a pretty clean ABC corrective pattern:

    • a down

    • b bounce (weak)

    • c down (sharp, into the 7340 low)

  • 3 Bar Reversal: After the c wave low, you have a 3 Bar Reversal formation — classic short-term bullish reversal pattern, especially off a major level like this.


3. Key Levels

  • Support:

    • 7340: Big-time support.

    • 7120: If 7340 breaks again, that becomes the next magnet (7120).

  • Resistance:

    • 7910: Immediate cap.

    • 8083: Major test above.

  • ATH Reference: Still far away at 7632 (Aug 2021 ATH) — now intermediate support if the rally continues.


4. Momentum (RSI below)

  • RSI is weak but attempting a bottom:

    • It dipped well below 50 and is trying to hook up.

    • The divergence isn’t massive, but there is a slight positive divergence compared to price — a small bullish tilt.


5. Theoretically, What Should Happen Next?

Based on the textbook setup:

  • After a 3 Bar Reversal post-ABC correction, you typically expect a multi-week bounce.

  • Targets: 7910 first, then 8083 — and if very strong, a retest of 8200-8300.

  • BUT the broader picture has shifted bearish:

    • The uptrend channel is broken.

    • 8514 was a major blow-off top.

    • This bounce is a countertrend rally unless it reclaims the broken channel. That’s important — rallies into resistance should be treated with skepticism unless proven otherwise.


6. Realistic Scenarios

  • Scenario 1 (Most Likely for Now): Rally into 7910-8083 zone → stall → new wave of selling, possibly to retest 7340 or even threaten 7120.

  • Scenario 2 (Less Likely but Possible): A much stronger rally, breaking 8083, grinding higher, but this would need serious momentum and news catalysts (e.g., rate cuts, macro tailwinds).


7. Current ASX Technical View Summary:

✅ ABC correction complete
✅ 3-bar reversal signals tactical rally
✅ 7910-8083 major resistance
⚠️ Big-picture trend broken — rallies are guilty until proven otherwise
⚠️ Failure to reclaim 7910 convincingly risks a re-test of 7340, even 7120


Disclaimer: This information is provided purely for educational purposes. It takes no account of an individual’s personal financial circumstances and hence can in no way constitute financial advice. The above data may be subject to errors or inconsistencies for which the author takes no liability. It is imperative that all investors do their own research or if they need advice, seek it from a qualified financial adviser.

Current ASX Technical View

Q3FY25 ASX:PPS

Praemium Limited – Q3 FY2025 Update Summary

Website: https://www.praemium.com.au

Overall Report Tone

The Q3 FY2025 update from Praemium Limited highlights continued growth in Funds Under Administration (FUA), led by strong performance in its newer Spectrum platform. While headline growth remains robust, platform-specific flows reveal areas of softness and adviser attrition challenges.


📊 Financial Results Summary (Per Share Metrics Not Disclosed)

Metric Q3 FY2025 Q2 FY2025 Q3 FY2024 Change (YoY)
Total FUA $62.3 billion $62.1 billion $53.3 billion +17%
Platform FUA $30.0 billion $30.1 billion $24.3 billion +24%
Net Inflows $364 million $371 million Not disclosed ↓ $7 million QoQ
Spectrum FUA $513 million $72 million Nil +615% QoQ
Adjusted EBITDA, EBT, EPS Not disclosed
Dividend Not disclosed

🟢 Positive Surprises or Potential Concerns

  • 📈 Strong growth in Spectrum with net inflows of $440 million, indicating rapid uptake of the IDPS solution.

  • 💸 Total FUA reached a record $62.3 billion, up 17% YoY, demonstrating broad-based resilience.

  • ⚠️ Powerwrap and OneVue reported net outflows of $66 million and $130 million respectively, raising questions about adviser retention.

  • 🧮 Negative market movement of $451 million impacted overall FUA growth.


📉 Result vs Market Expectations

  • 📌 Platform FUA growth of 24% YoY exceeds typical industry benchmarks.

  • 🔄 SMA net inflows of $120 million were down significantly from the previous quarter ($261 million), possibly below investor expectations.

  • 🛑 Powerwrap’s continuing outflows—driven by departed advisers—may weigh on sentiment despite broader growth.

  • 🆕 The inclusion of OneVue’s $4.1b FUA provides a one-off lift, but the net outflows suggest integration frictions.


🔮 Outlook and Guidance Statements

  • 🧪 CEO highlights strong pipeline for Spectrum in private wealth, suggesting momentum into FY2026.

  • 🔄 OneVue integration is on track, with synergies expected by FY-end—a key area to monitor.

  • 🧠 Investments in AI-driven quality assurance and administration automation to improve service delivery.

  • 🤝 New adviser onboarding processes and expanding in-house administration signal a strategic pivot toward service control.


Analysts Likely to Increase Forecasts for FY25–26

Reasoning:

  1. Strong Revenue Momentum

    • H1 FY25 revenue: $52.3M (↑33% YoY)​

    • Driven by OneVue acquisition ($6M), SMA repricing, and organic FUA growth.

  2. Solid EBITDA Margin Resilience

    • Underlying EBITDA H1 FY25: $12.9M (↑43% YoY)​

    • EBITDA margin improved to 25% vs 23% prior period.

  3. Positive Net Profit Before Tax

    • $7.52M in H1 FY25 vs $5.54M in H1 FY24 → +36% YoY

  4. Record FUA

    • Total FUA: $62.3B at Q3 FY25 (↑17% YoY)​

    • Platform FUA: $30.0B (↑24%)

    • Strong net inflows: $364M for Q3

  5. Growing Contribution from Spectrum

    • Spectrum net inflows: $440M in Q3 FY25, up from $69M in Q2​


📊 Updated Metric Forecasts (FY ending 30 June)

Metric Analyst FY25 Estimate Updated Estimate Rationale
Revenue $104.68M $108M – $112M 33% YoY growth in H1 implies beat likely
EBITDA $26.65M $28M – $30M Strong H1 margin + cost control
EBT (adj.) $19.34M $20.5M – $21.5M 36% YoY lift in H1 EBT already

ASX:PPS 1 year daily Price chart with 3 EMA and volume

Disclaimer:
This information is provided purely for educational purposes. It takes no account of an individual’s personal financial circumstances and hence can in no way constitute financial advice. The above data may be subject to errors or inconsistencies for which the author takes no liability. It is imperative that all investors do their own research or if they need advice, seek it from a qualified financial adviser.

Q3FY25 ASX:PPS

ZIP Co (ASX:ZIP) Q3FY25 Update

Zip Co Limited – 3Q FY25 Trading Update Summary

Website: www.zip.co

Overall Report Tone

Zip Co continues to build momentum across its core markets, showing accelerated growth and disciplined execution, particularly in the United States. The company has delivered its largest-ever quarterly cash earnings, resulting in an upgraded FY25 earnings guidance and strong indications of profitable scalability.


📊 Financial Summary (Per Share Metrics Not Disclosed)

Metric 3Q FY25 2Q FY25 1H FY25 YoY Change (3Q vs 3Q24)
Revenue $278.9m $271.5m $514.0m (1H) ▲ 26.5%
TTV $3.3b $3.43b $6.2b (1H) ▲ 35.7%
Cash EBTDA $46.0m $21.0m (approx) $67.0m (1H) ▲ 219.4%

🟢 Positive Surprises or Potential Concerns

  • 💰 Cash EBTDA hit a record $46.0m, up 219% YoY, and Zip upgraded FY25 guidance to at least $153m, up from $147m.

  • 🚀 US market strength continues, with TTV up 40.2% YoY and revenue up 44.1%, showing strong repeat customer engagement.

  • 📉 Revenue margin slightly declined to 8.6% (from 9.2%) due to higher proportion of lower-margin US volume.

  • ⚠️ Slight QoQ declines in ANZ TTV and active customer numbers, but still showing solid YoY improvement.


📈 Result vs Market Expectations

  • Exceeded expectations for EBTDA, driven by robust US growth and operational leverage.

  • Strong cost management, with opex growth contained to ~10%, contributing to operating margin lift to 16.5% in Q3 (vs 13.0% in Q2).

  • ⚠️ ANZ revenue fell 1.3% YoY, suggesting competitive pressures or maturing growth.

  • Credit quality remains strong, with net bad debts steady at ~1.6%, within or below management’s 1.5–2.0% target range.


🔮 Outlook and Guidance

  • 🔼 FY25 cash EBTDA guidance upgraded to at least $153m from $147m.

  • 🧱 Continued investment in ANZ and US product innovation, with strong performance from new offerings like Zip Plus and Pay-in-8.

  • 💳 $50m share buyback announced, showing confidence in capital position and outlook.

  • 📊 Zip reiterated its FY25 two-year strategic targets, suggesting no change to long-term goals despite macro uncertainties.


🧠 Deep Dive on What’s New in 3Q FY25 Compared to 1H FY25

  • New FY25 guidance upgrade: Cash EBTDA now expected to exceed $153m, up from $147m (set in February).

  • GameStop partnership expanded to online, and new US merchants like Temu and Tire Agent added—indicating deeper retail channel penetration.

  • Cash and liquidity increased to $204.5m, up from $195.5m at 1H end.

  • Portfolio yield in AU ticked up to 18.7%, indicating ongoing margin expansion.

  • Operating margin hit 16.5% in 3Q25, up significantly from 13.0% in 2Q25—suggesting effective cost discipline and scale.


Disclaimer:
This information is provided purely for educational purposes. It takes no account of an individual’s personal financial circumstances and hence can in no way constitute financial advice. The above data may be subject to errors or inconsistencies for which the author takes no liability. It is imperative that all investors do their own research or if they need advice, seek it from a qualified financial adviser.

ZIP Co (ASX:ZIP) Q3FY25 Update

Select Harvests (ASX:SHV) April Update

Select Harvests has released an update to the market today (Wednesday April 16). It included a downgrade to production with an upgrade to almond pricing. The market has responded negatively to the news in early trade. Let’s try and determine if this initial market reaction is appropriate.

Select Harvests (ASX:SHV) Price Chart

🥜 Select Harvests – April 2025 Business Update Summary

Website: www.selectharvests.com.au

📢 Overall Report Tone

Select Harvests has issued a constructive update amidst a challenging crop year. Despite a lower-than-expected almond production, the strong pricing environment and strategic execution are expected to offset volume headwinds, reinforcing management’s confidence in delivering long-term value.


📊 Key Financial and Operational Metrics (Per Share Where Possible)

Metric FY24 (AGM) March 2025 Briefing April 2025 Update
Revenue $337m Confirmed Not updated
Almond Price (forecast) $7.69/kg $9.20/kg ↑ $10.35/kg
Crop Volume Forecast 29,527MT (actual FY24) 27,500–29,000MT (March) ↓ 24,000–26,500MT
Exchange Rate Hedge Not disclosed 86% of 2025 crop hedged at 0.648 Confirmed

✅ Positive Surprises or Potential Positives

  • 📈 Almond pricing upgraded to A$10.35/kg, up from A$9.20/kg in March and A$7.69/kg in FY24. This represents a +35% YoY price increase and supports profitability despite lower volumes.

  • 🌐 Strong global demand, particularly from China and India, is sustaining price strength.

  • 🏭 Processing capacity expansion continues at Carina West, helping to scale efficiently into future years.

  • 💵 86% of 2025 crop is hedged, reducing FX risk in volatile markets.


⚠️ Potential Concerns or Headwinds

  • 🌾 Crop downgrade from 27,500–29,000MT to 24,000–26,500MT, driven by poor bloom strength, large hulls, and frost damage (~500MT).

  • 🌿 The Nonpareil variety’s crack-out rates are lower, impacting kernel yields.

  • 🌧️ Continued weather volatility in NSW presents a risk for future crop consistency.

  • 🧪 Strategy benefits expected from 2026 onwards, indicating muted near-term uplift from transformation efforts.


📊 Results vs Market Expectations

  • 🔼 Analysts were previously modelling A$9.20/kg pricing, so A$10.35/kg represents a beat.

  • 🔽 However, volumes are materially lower, likely dragging revenue and EBITDA forecasts down despite price support.

  • 📊 Analysts will likely need to trim volume forecasts but increase realised price assumptions, creating a mixed revision outlook.


🔮 Outlook and Guidance

  1. 🌎 Almond macro tailwinds remain intact, including rising demand, constrained US supply, and low global inventories.

  2. 🏗️ Strategy remains unchanged – scale-up, cost management, customer expansion, and margin capture.

  3. 🌱 New horticultural strategy should show tangible results from 2026, with full benefits expected in 2027.

  4. 🔁 Despite lower 2025 crop, management sees no ongoing structural impact on future crops.


🔍 Analyst Forecast Revisions

🔻 Crop Downgrade

  • Previous FY25 Crop Forecast: 27,500 – 29,000 MT

  • Updated Forecast: 24,000 – 26,500 MT

  • This ~10% downgrade in volume reflects weaker bloom and low crack-out rates (particularly from Nonpareil), plus 500MT frost losses. This will likely pressure revenue and EBITDA forecasts downward, all else equal.

🔺 Pricing Upgrade

  • Previous FY25 Price Forecast: A$9.20/kg

  • Updated Forecast: A$10.35/kg (~12.5% increase)

  • Higher almond pricing, driven by global supply tightening (especially California) and strong demand from China and India, more than offsets the crop downgrade on a dollar basis, likely lifting margin expectations and partially or fully offsetting the crop volume impact on EBITDA.

🎯 Forecast Implication:

  • Revenue: Likely to remain flat to slightly up, as higher price offsets volume loss.

  • Adjusted EBITDA: Likely to be revised up slightly, particularly if hedging gains and cost discipline continue.

  • EBT (Earnings Before Tax): Should benefit from pricing tailwinds and lower production costs — mild upward revision likely.


📌Conclusion

Despite a crop downgrade, higher almond prices and favourable hedging are expected to offset volume losses, leading to stable or slightly higher revenue forecasts. Adjusted EBITDA and EBT are likely to be revised upward due to improved pricing, cost efficiencies, and operational execution. Overall, the outlook remains positive with strong momentum into FY25.


Disclaimer: This information is provided purely for educational purposes. It takes no account of an individual’s personal financial circumstances and hence can in no way constitute financial advice. The above data may be subject to errors or inconsistencies for which the author takes no liability. It is imperative that all investors do their own research or if they need advice, seek it from a qualified financial adviser.

Select Harvests (ASX:SHV) April Update

Quick Take: FY2024 ASX:VGL

Vista Group International – 2024 Full Year Results Summary

Website: vistagroup.co.nz


Overall Report Tone

Vista Group International (NZX & ASX: VGL) reported strong momentum in 2024, achieving record revenue, positive free cash flow, and increased long-term EBITDA margin aspirations. The transition to cloud-based solutions is accelerating, reinforcing the company’s strategic shift to SaaS.


Financial Results (NZD, unless stated otherwise)

Metric 2024 2023 Change YoY
Revenue $150.0m $143.0m +5%
Recurring Revenue $134.6m $124.0m +9%
SaaS Revenue $55.7m $45.9m +21%
Annual Recurring Revenue (ARR) $145.6m $126.3m +15%
EBITDA $21.6m $13.3m +62%
Operating Cash Flow $16.8m $9.0m +87%
Net Profit Before Tax (NPBT) $1.8m ($17.5m) +110%
Dividend No dividend declared N/A N/A

Key Insights & New Developments

💰 Positive free cash flow achieved in 2H24, ahead of 4Q24 guidance.
☁️ Strong transition to cloud – 17 new clients signed, 683 sites live, representing 15% of enterprise client sites.
📈 EBITDA margin aspirations increased to 33-37% (from 25-30%) over the long term.
📊 Vista Cloud adoption accelerating – major new signings include Cine Colombia, Cinema West, and Silky Otter.
🎥 Industry performance boosted by blockbuster releases such as Inside Out 2 (US$1.7b box office) and Deadpool & Wolverine.


Positive Surprises & Potential Concerns

Positive Surprises:

  • Record revenue and accelerating cloud adoption, validating SaaS transition.
  • Free cash flow positive earlier than expected, boosting financial stability.
  • EBITDA margin expansion of 15.5%, exceeding previous guidance.

⚠️ Potential Concerns:

  • Non-recurring revenue fell 19% YoY, reflecting reduced on-premise licensing and hardware sales.
  • No dividend announced, despite improved cash flow position.
  • Box office uncertainty, as 2024 global box office was 7% below 2023 due to fewer major film releases.

Results vs Market Expectations

📈 Above Expectations:

  • Revenue growth of 5% YoY was in line with forecasts.
  • EBITDA margin of 15.5% (excluding FX losses) exceeded guidance of 13-14%.
  • Cloud transition ahead of schedule, strengthening long-term recurring revenue outlook.

📉 Below Expectations:

  • No dividend despite strong financial turnaround, which may disappoint some investors.
  • Film segment growth of only 5% was softer than anticipated, partly due to industry-wide challenges.

Outlook & Guidance for 2025

📊 Financial Guidance:

  • Total Revenue: $167m-$173m
  • Recurring Revenue: $152m-$158m
  • EBITDA Margin: 16-18%
  • Non-Recurring Revenue: ~$15m

🚀 Strategic Priorities:

  • Continue Vista Cloud expansion with new and existing clients.
  • Drive higher SaaS adoption, increasing recurring revenue streams.
  • Expand data analytics and AI capabilities, enhancing customer insights.
  • Maintain cost efficiency focus while scaling cloud operations.

Market Positioning

The share price of Vista Group had been trending higher into this result.

Quick Take: FY2024 ASX:VGL 12 month daily price chart with 3 EMA and volume

Analyst Positioning

Revenue guidance suggests no major revisions should be needed by analysts. Strong EBITDA performance may see slight revisions higher.


Disclaimer: This information is provided purely for educational purposes. It takes no account of an individual’s personal financial circumstances and hence can in no way constitute financial advice. The above data may be subject to errors or inconsistencies for which the author takes no liability. It is imperative that all investors do their own research or, if they need advice, seek it from a qualified financial adviser.

Quick Take: FY2024 ASX:VGL

Quick Take: H1FY25 ASX:FWD

Fleetwood Limited – H1FY25 Interim Results Summary

Company Website

Overall Report Tone

Fleetwood Limited delivered strong revenue growth (+19%), with significant EBIT improvement (+$12M YoY), driven by Building Solutions and Community Solutions. Despite challenges in RV Solutions, cash flow improved, and the company increased its dividend to 11.5cps, highlighting confidence in future earnings.


Financial Performance Overview

Metric H1FY25 H1FY24 Change ($) Change (%)
Revenue $272.7M $229.9M + $42.8M +19%
EBITDA $25.2M $14.5M + $10.7M +74%
Underlying EBIT $18.3M $6.3M + $12.0M +190%
Net Profit After Tax (NPAT) $4.7M $3.9M + $0.7M +18%
Free Cash Flow $21.6M -$10.6M + $32.2M +300%
Order Book $137M $100M + $37M +37%
Dividend (fully franked) 11.5 cps 2.5 cps +9.0 cps +360%

Key Insights & Business Developments

📈 Revenue Growth & Business Performance

  • Building Solutions: Revenue +17.7% to $202.6M, EBIT up +121.9% to $7.1M, supported by education and housing projects.
  • Community Solutions: EBIT surged +257% to $16.8M, driven by Searipple Village occupancy increasing to 71% (from 34%).
  • RV Solutions: Struggled due to OEM market weakness, posting a $0.7M loss, leading to $6M goodwill impairment and $1.9M restructuring costs.

💰 Profitability & Cash Flow

  • Free Cash Flow of $21.6M (vs. -$10.6M in H1FY24), driven by working capital improvements.
  • Strong balance sheet, closing cash of $57.5M (up $23.5M).
  • Capital management includes a share buyback of $1.1M.

🚀 Strategic Developments

  • Building Solutions: $137M order book, with $200M+ in pending tenders.
  • Community Solutions: Securing long-term contracts for Searipple Village, with 81% occupancy locked in for FY25.
  • RV Solutions: Focus on cost reduction and price adjustments to return to profitability in H2FY25.

Result vs Market Expectations

Revenue and EBIT exceeded expectations, driven by Building & Community Solutions growth.
Cash flow turnaround (+$32.2M YoY) reflects strong working capital management.
⚠️ RV Solutions impairment ($6M) and restructuring costs ($1.9M) highlight ongoing challenges in the caravan market.
Dividend of 11.5 cps significantly higher than 2.5 cps in H1FY24, demonstrating confidence in earnings momentum.


Outlook & Guidance

🔹 Building Solutions:

  • Strong pipeline, with $200M+ in tenders awaiting award.
  • 15% return on capital target expected to be achieved earlier than planned.
  • Continued expansion in education and housing projects.

🔹 Community Solutions:

  • Searipple Village occupancy secured at 81% for FY25 and 73% for FY26.
  • Opportunities in Build to Rent (BTR) and key worker accommodation.

🔹 RV Solutions:

  • Cost-cutting initiatives and pricing adjustments expected to return the segment to profitability in H2FY25.

Market Positioning

Shares in the Fleetwood were strong coming into this result.

Quick Take: H1FY25 ASX:FWD 12 month daily share price chart with 3 EMA and volume

Analyst Positioning

1. Revenue Forecasts:

  • H1FY25 Revenue: $272.7M (up 19% YoY from $229.9M)
  • This suggests that FY25 revenue may exceed the current analyst estimate of $466.05M if this growth rate continues in H2FY25.
  • However, some seasonality effects in Building Solutions (lower activity in H2 due to installations) may moderate full-year growth.
  • Revision Expectation: Analysts may slightly increase their FY25 revenue forecasts, particularly if contract momentum remains strong.

2. EBITDA Forecasts:

  • H1FY25 EBITDA: $25.2M (up $10.7M YoY, or +74%)
  • Analyst expectations for FY25 EBITDA are $52.15M, meaning the company has already delivered nearly 50% of that in H1.
  • Given that EBITDA momentum is strong and cost-saving measures (RV Solutions restructuring) are expected to improve margins further in H2, full-year EBITDA may surpass the current forecast.
  • Revision Expectation: Analysts are likely to increase their FY25 EBITDA forecasts, given the strong H1 performance and ongoing cost optimizations.

Final Takeaway:

  • Revenue: Mild upward revision possible if H2 maintains strong contract execution.
  • EBITDA: Upward revision highly likely due to stronger-than-expected margin expansion and cost efficiencies.

Disclaimer: This information is provided purely for educational purposes. It takes no account of an individual’s personal financial circumstances and hence can in no way constitute financial advice. The above data may be subject to errors or inconsistencies for which the author takes no liability. It is imperative that all investors do their own research or if they need advice, seek it from a qualified financial adviser.

Quick Take: H1FY25 ASX:FWD

Quick Take: H1FY25 ASX:XRG

xReality Group Limited – 2025 Interim Results Summary

Company Website

Overall Report Tone

XReality Group (XRG) interim report reflects strong revenue growth driven by the success of Operator XR, partially offset by weakness in the entertainment segment. While the company remains unprofitable, the net loss has narrowed, and management is focusing on high-margin technology-driven business. The outlook for Operator XR remains positive, with continued growth in customer acquisitions and contract value.

Financial Performance Overview

Metric 31 Dec 2024 31 Dec 2023 Change ($) Change (%)
Revenue $7.42M $5.61M + $1.82M +32%
Adjusted EBITDA $0.9M $0.46M + $0.44M +96%
Operating Cash Flows $1.32M $0.77M + $0.54M +70%
Net Loss After Tax (NLAT) – $0.99M – $1.50M + $0.51M +34%
Normalised EPS (cents) – 0.18 – 0.32 +0.14 +44%
Dividend Nil Nil

Key Insights & Business Developments

📈 Revenue Growth & Business Shift

  • Operator XR contributed $2.1M, up $1.8M from the prior corresponding period (pcp), driving overall revenue growth.
  • The entertainment segment declined (-10%) due to economic conditions and strategic shift.
  • Operator XR has reached 50 customers, expanding significantly across US law enforcement and military agencies.
  • Deferred revenue at $5.8M, with a strong pipeline for the second half.

💰 Profitability & Cash Flow

  • EBITDA nearly doubled (+96% YoY), showing improved operational efficiency.
  • Operating cash flow of $1.32M, up 70%, supporting liquidity.
  • Net tangible assets per share fell to $0.005, reflecting debt burden and intangible asset growth.

📌 Strategic Adjustments & Future Focus

  • XRG is prioritising Operator XR, with plans to streamline or divest entertainment businesses (iFLY & Freak Entertainment).
  • Expansion in Europe & Asia through distributor partnerships.
  • Debt refinancing discussions underway to optimise financial position.

Result vs Market Expectations

Revenue beat expectations, driven by strong Operator XR sales growth.
EBITDA exceeded projections, indicating effective cost control.
⚠️ Net loss remains a concern, although it has narrowed significantly.
⚠️ Entertainment sector underperformance could weigh on future valuation.

Outlook & Guidance

🚀 Operator XR set for continued expansion, targeting new markets in Europe & Asia.
📊 Annual Recurring Revenue (ARR) at $3.6M, with Total Contract Value (TCV) up 80% YoY to $7.4M.
💼 iFLY & Freak Entertainment restructuring planned, with possible exits in FY2025.
🔎 Focus on AI-driven innovations, led by new Chief AI Advisor.

Quick Take: H1FY25 ASX:XRG 12 month daily share price chart with 3 EMA and volume


Disclaimer: This information is provided purely for educational purposes. It takes no account of an individual’s personal financial circumstances and hence can in no way constitute financial advice. The above data may be subject to errors or inconsistencies for which the author takes no liability. It is imperative that all investors do their own research or if they need advice, seek it from a qualified financial adviser.

Quick Take: H1FY25 ASX:XRG

Quick Take: H1FY25 ASX:ANG

Austin Engineering – 2025 Interim Results Summary

Company Website


Overall Report Tone

Austin Engineering (ASX: ANG) has reported strong revenue and earnings growth for FY25 H1, with standout performances in North America and APAC. However, operating cash flow challenges and margin pressures in South America are key considerations. The order book at a multi-year high reinforces confidence in future growth, and the company has reiterated its full-year guidance.

Financial Results Summary

Metric FY25 H1 FY24 H1 Change (%)
Revenue $170.2M $143.6M +18.5%
Underlying EBITDA $25.3M $20.8M +22.0%
Operating Cash Flow $(3.5M) Positive Negative
Adjusted Earnings Before Tax (EBT) $20.0M $15.8M +27.0%
Normalised NPAT $17.4M $15.0M +16.0%
Normalised EPS Not Disclosed Not Disclosed
Dividend (Interim, Fully Franked) 0.6c per share 0.4c per share +50%

Positive Surprises / Strengths

  • 📈 North America revenue surged 52% due to repeat orders and new customer growth, reflecting strong market demand.
  • 🏗️ Order book increased by 22% to $224M, the highest in recent years, providing strong revenue visibility.
  • 💰 Interim dividend up 50% to 0.6c per share, highlighting management confidence in cash flows.
  • 🌍 APAC profitability doubled, with margins expanding to 21% after restructuring efforts in Batam.

Potential Concerns / Risks

  • 💸 Operating cash flow turned negative ($3.5M), mainly due to higher APAC inventory and delayed customer payments.
  • 🏭 South America EBITDA fell to zero as a major multi-year OEM program reorganisation impacted margins.
  • 📊 Higher effective tax rate of 14% (vs. 5% in FY24 H1) due to the tax position of US and Indonesia operations.
  • 💳 Net debt increased to $10.5M, reflecting higher inventory build-up and capital expenditure.

Result vs Market Expectations

  • Revenue growth of 18.5% exceeded expectations, driven by strong order flow in North America and APAC.
  • EBITDA growth of 22% was solid, underpinned by efficiency improvements in Batam and stronger North American margins.
  • ⚠️ South America’s margin collapse was likely a negative surprise, though it is expected to improve in H2.
  • ⚠️ Cash flow deterioration may cause concerns if not reversed in H2.

Outlook and Guidance

  • 📈 FY25 full-year revenue expected at ~$350M, up ~12% from FY24.
  • 💵 FY25 EBIT forecasted at ~$50M, up ~30%, reinforcing earnings growth momentum.
  • 📊 Order book strength provides a clear multi-year growth trajectory.
  • 🏗️ H2 operating cash flow expected to improve, with the unwinding of APAC inventory and delayed customer payments now received.

Quick Take: H1FY25 ASX:ANG 12 month daily share price chart with 3 EMA and volume

Analyst Positioning

Revenue and EBITDA Performance

  • H1 FY25 Revenue: $170.2M (18.5% YoY growth)

  • H1 FY25 Underlying EBITDA: $25.3M (22% YoY growth)

  • Analyst Forecasts:

    • FY25 Revenue: $351.5M
    • FY26 Revenue: $379.4M
    • FY25 EBITDA: $60.3M
    • FY26 EBITDA: $66.4M

Assessment:

  • With H1 FY25 revenue at $170.2M, the company needs a similar H2 performance to meet the $351.5M FY25 forecast.
  • Given EBITDA at $25.3M in H1, the company must improve to achieve the full-year target of $60.3M. The strong order book and expected H2 operational cash flow improvement may support this.


“Disclaimer: This information is provided purely for educational purposes. It takes no account of an individual’s personal financial circumstances and hence can in no way constitute financial advice. The above data may be subject to errors or inconsistencies for which the author takes no liability. It is imperative that all investors do their own research or if they need advice, seek it from a qualified financial adviser.”

Quick Take: H1FY25 ASX:ANG

Quick Take: H1FY25 ASX:ACF

Acrow Limited – 2025 Interim Results Summary

Website: www.acrow.com.au

Overall Report Tone

Acrow Limited reported strong revenue growth but faced profitability pressures due to acquisition-related expenses and changes in revenue mix. Despite a 25% increase in revenue, net profit declined by 24%, reflecting increased acquisition costs, amortization, and a shift toward lower-margin industrial services. The company continues its strategic expansion in industrial services, with further investments in acquisitions and capital expenditures.

Financial Results

Metric 1H25 1H24 % Change
Revenue ($m) 126.6 101.0 Up 25%
Adjusted EBITDA ($m) 39.0 35.2 Up 11%
Operating Cash Flow ($m) 16.9 21.0 Down 19%
Adjusted Earnings Before Tax ($m) 14.98 18.60 Down 19%
Normalised EPS (cents) 5.38 5.87 Down 8%
Dividend Per Share (cents, fully franked) 2.90 3.00 Down 3%

Positive Surprises / Potential Concerns

Revenue increased 25%, driven by strong industrial services performance.

No bad debts were recorded, showcasing strong credit management.

⚠️ Net profit declined by 24%, impacted by $2.7m contingent acquisition costs.

⚠️ EPS fell 8%, due to a higher share count and lower margins from industrial services.

⚠️ Debt increased to $92m (from $68.6m), raising net debt to EBITDA from 1.1x to 1.3x.

Results vs Market Expectations

📉 Net profit decline of 24% may be a concern for investors despite stable underlying profit.

📈 Revenue growth of 25% exceeded expectations, particularly in industrial services.

📉 EBITDA margin declined from 34.8% to 30.8%, due to higher labor costs in industrial services.

📉 Dividend slightly lower at 2.9 cents, which could signal a cautious approach to capital allocation.

Outlook & Guidance

📌 The company is focused on expanding Industrial Access operations, with recent acquisitions reinforcing this strategy.

📌 Expecting improved cash flow as acquisition costs normalize and contract revenues stabilize.

📌 Debt remains within bank covenants, but leverage should be monitored.

📌 New acquisition of Australasian Training & Education Centre aims to support workforce skills development and generate external revenue.

Quick Take: H1FY25 ASX:ACF 12 month daily share price chart with 3 EMA and volume

Analyst Positioning

Based on Acrow Limited’s half-yearly financial report for the period ending 31 December 2024, here is an analysis of its performance compared to analyst forecasts:

1. Revenue Forecast Comparison

  • 1H 2025 Revenue: $126.59M (up 25% YoY from $101.04M)
  • Implied FY 2025 Revenue (Assuming Similar Growth in H2 2025): ~$253M
  • Analyst FY 2025 Revenue Forecast: $271.71M
  • Analyst FY 2026 Revenue Forecast: $290.68M

💡 Analysis: If the second half of FY 2025 experiences similar growth, Acrow will likely fall short of the analyst revenue forecast for FY 2025. However, stronger performance in Industrial Access and acquisitions could help close this gap.

2. EBITDA Forecast Comparison

  • 1H 2025 Underlying EBITDA: $39.03M (up 11% YoY)
  • Implied FY 2025 EBITDA (Assuming Similar Growth in H2 2025): ~$78M
  • Analyst FY 2025 EBITDA Forecast: $85.51M
  • Analyst FY 2026 EBITDA Forecast: $91M

💡 Analysis: Based on current trends, Acrow may underperform relative to the analyst EBITDA forecast unless cost efficiencies or higher-margin revenue streams improve.


Disclaimer: This information is provided purely for educational purposes. It takes no account of an individual’s personal financial circumstances and hence can in no way constitute financial advice. The above data may be subject to errors or inconsistencies for which the author takes no liability. It is imperative that all investors do their own research or, if they need advice, seek it from a qualified financial adviser.

Quick Take: H1FY25 ASX:ACF

Quick Take: H1FY25 ASX:PGC

Paragon Care – 2025 Interim Results Summary

Company Website


Overall Report Tone

Paragon Care (ASX: PGC) reported strong revenue and profit growth for the first half of FY25, largely driven by the acquisition of CH2 Holdings (June 2024) and Oborne (March 2024). The company’s merger integration efforts are progressing, with increased market share in retail pharmacy and improved gross margins due to a shift towards higher-margin products. However, higher finance costs and borrowings indicate an increased reliance on debt for growth.


Financial Performance Summary

Metric 1H FY25 (Dec 2024) 1H FY24 (Dec 2023) Change (%)
Revenue $1,850.4m $1,440.8m +28%
Gross Profit $163.5m $77.4m +111%
Adjusted EBITDA $47.5m $23.4m +103%
Profit Before Tax (PBT) $16.9m $10.3m +64%
Net Profit After Tax (NPAT) $13.2m $7.1m +85.8%
Net Tangible Assets per Share -3.78c -5.14c Improved
Dividend Declared None $4.2m -100%

Key Highlights

📈 Significant Revenue Growth from Acquisitions

  • 28% increase in revenue to $1.85 billion, driven by the CH2 Holdings and Oborne acquisitions​.
  • Stronger retail pharmacy market share contributed to growth​.

💰 EBITDA & Gross Margin Expansion

  • EBITDA more than doubled (+103% YoY) to $47.5m​.
  • Gross margin improved significantly (+111% YoY) due to a shift toward higher-margin sales​.

💳 Higher Borrowings & Interest Costs

  • Borrowings increased to $248.2m, driving a 135% increase in finance costs​.
  • Working capital requirements remain high, but net debt is expected to normalise in 2H FY25​.

🛠 Integration of CH2 Holdings & Oborne Underway

  • Purchase Price Allocation (PPA) finalised, recognising $108.8m in intangible assets & $253.3m in goodwill​.
  • Synergies expected to contribute $5m in FY25 and $12m in FY26​.

Positive Surprises / Potential Concerns

Stronger-than-expected Gross Margin Growth: Despite high finance costs, product mix improvements resulted in better profitability​.
Net Tangible Assets Improved: Although still negative, NTA improved from -5.14c to -3.78c per share​.
⚠️ Rising Debt Levels: Borrowings grew significantly, leading to higher interest expenses (+135% YoY)​.
⚠️ No Dividend Declared: The company chose not to pay a dividend to prioritise debt management and integration costs​.


Results vs. Market Expectations

📊 Revenue & Profitability in Line with AGM Expectations

  • AGM guidance in November 2024 indicated that 1H FY25 performance was tracking in line with expectations​.

📉 Higher-than-expected Finance Costs:

  • Finance costs rose sharply, potentially impacting future profitability if debt levels remain elevated​.

📌 Integration on Track, Synergies Expected in FY26:

  • Merger synergies of $5m in FY25 and $12m in FY26 are expected to improve margins and reduce operating costs​.

Outlook & Guidance

🔮 Second Half Expected to Show Further Improvement

  • Net debt expected to decline as working capital stabilises​.
  • Revenue growth to continue as integration progresses​.

💡 Long-term Expansion in Asia-Pacific

  • The company aims to expand into Singapore, Malaysia & Indonesia in FY26​.

📌 No Dividend Until FY26 Review

  • Dividend policy will be reassessed in FY26, focusing on debt reduction & reinvestment in growth​.

Quick Take: H1FY25 ASX:PGC 12 month daily share price chart with 3 EMA and volume

Analyst Positioning

Comparison with Analyst Revenue and EBITDA Forecasts

Analyst Forecasts:

  • Revenue:
    • 2025: $3,704.9M
    • 2026: $3,902.24M
  • EBITDA:
    • 2025: $98.45M
    • 2026: $109.43M

Company Performance (Half-Year Ended Dec 2024):

  • Revenue: $1,850.42M
  • EBITDA: $47.53M

Projected Full-Year Performance vs. Analyst Estimates

  • If we annualize the H1 2024 revenue and EBITDA figures:
    • Estimated FY2025 Revenue: ~$3,700M (close to analyst forecast).
    • Estimated FY2025 EBITDA: ~$95M (slightly below analyst forecast of $98.45M).

Conclusion:

  • Revenue is tracking close to 2025 expectations.
  • EBITDA is slightly below expectations but could improve in H2 with cost efficiencies and integration benefits.

Disclaimer: This information is provided purely for educational purposes. It takes no account of an individual’s personal financial circumstances and hence can in no way constitute financial advice. The above data may be subject to errors or inconsistencies for which the author takes no liability. It is imperative that all investors do their own research or if they need advice, seek it from a qualified financial adviser.

Quick Take: H1FY25 ASX:PGC

Quick Take: H1FY25 ASX:AHC

Austco Healthcare – 2025 Interim Results Summary

Company Website


Overall Report Tone

Austco Healthcare (ASX: AHC) has reported strong revenue and EBITDA growth for 1H FY25, reflecting the successful integration of Teknocorp and Amentco acquisitions, as well as solid organic growth across Asia and North America. The company exceeded the upper end of its previously provided revenue and EBITDA guidance, highlighting strong operational leverage and unfilled contracted revenue of $50.2 million.


Financial Performance Summary

Metric 1H FY25 (Dec 2024) 1H FY24 (Dec 2023) Change (%)
Revenue $36.9m $22.8m +61.6%
Adjusted EBITDA $5.2m $2.1m +149.9%
Operating Cash Flow $2.2m $1.9m +20.2%
Adjusted EBT $3.9m $1.0m +269.9%
Normalised EPS (Basic) 0.808c 0.402c +101.0%
Dividend Declared None None

Key Highlights

📈 Record Revenue Growth:

  • Revenue increased 61.6% YoY, reaching $36.9 million, at the upper end of the previously forecast $35.8m – $36.9m range​.
  • Acquisitions Teknocorp & Amentco contributed $11.9 million, validating Austco’s growth-through-acquisition strategy​.

🚀 Strong EBITDA Performance:

  • EBITDA surged 150% to $5.2m, exceeding the upper guidance of $4.5m – $5.1m​.
  • Increased revenue contributed significantly, despite a small decline in gross margins (51.1% vs. 51.9%) due to lower-margin acquisitions​.

💰 Cash & Balance Sheet Strength:

  • Cash balance of $14.9m (including $4.7m in term deposits)​.
  • Debt-free status supports future expansion initiatives.

🛠 Software & SMA Growth:

  • Software & Subscription revenue grew 15% YoY to $4.6m, now making up 12.5% of total revenue​.
  • Software & SMA revenues account for 19.4% ($9.7m) of the Unfilled Contracted Revenue (UCR), positioning it as a future growth driver​.

Positive Surprises / Potential Concerns

Exceeding Market Guidance: Revenue and EBITDA exceeded previous ASX guidance​.
Organic Growth Momentum: 19% organic revenue growth, particularly in Asia and North America​.
⚠️ Gross Margin Pressure: Margins slightly decreased due to acquired businesses having lower gross margins​.
⚠️ No Dividend Declared: The company chose not to pay a dividend to fund further organic and inorganic growth​.


Results vs. Market Expectations

📊 Revenue & EBITDA at the Upper End:

  • Both revenue and EBITDA exceeded the top end of prior market guidance, demonstrating operational efficiency​.

📈 Strong Unfilled Contracted Revenue (UCR):

  • UCR remained steady at $50.2 million, showing continuing sales momentum​.

📉 Tax Expense Impact:

  • Compared to previous periods where tax credits were received, the company recorded a $0.9m tax expense, reducing net profit growth​.

Outlook & Guidance

🔮 Continued Growth Expected:

  • Historically, 2H performance has been stronger than 1H, indicating further upside potential​.

💾 Software Expansion Strategy:

  • Software & SMA growth remains a priority, especially as the acquired businesses integrate higher-margin services​.

📌 Acquisition Strategy to Continue:

  • Management remains open to further acquisitions, reinforcing its buy-and-build model​.

💡 Focus on Cash Generation:

  • Despite investment in growth, cash flow generation remains positive, supporting long-term sustainability​.

Quick Take: H1FY25 ASX:AHC 12 month daily share price chart with 3 EMA and volume


Disclaimer: This information is provided purely for educational purposes. It takes no account of an individual’s personal financial circumstances and hence can in no way constitute financial advice. The above data may be subject to errors or inconsistencies for which the author takes no liability. It is imperative that all investors do their own research or if they need advice, seek it from a qualified financial adviser.

Quick Take: H1FY25 ASX:AHC

Quick Take: H1FY25 ASX:HLO

Helloworld Travel Limited – 2025 Interim Results Summary

Website: helloworldlimited.com.au

Overall Report Tone

Helloworld Travel Limited reported a decline in revenue and profitability for the half-year ended 31 December 2024, primarily due to lower transaction volumes and shifting travel preferences. While operational efficiency helped control expenses, EBITDA and net profit fell significantly compared to the previous period. However, the company increased its interim dividend, indicating confidence in future prospects.

Financial Summary (Per Share Where Applicable)

Metric 1H FY25 1H FY24 Change
Total Revenue $103.8M $112.3M -7.6%
Underlying EBITDA $27.2M $34.0M -20.2%
Operating Cash Flow -$42.1M $12.3M Negative swing
Profit Before Tax $17.2M $23.6M -27.1%
Normalised EPS 7.1c 10.1c -29.7%
Interim Dividend 8.0c 5.0c +60%

Positive Surprises / Strengths

Stable revenue margin: Despite a drop in revenue, the revenue margin remained at 4.9%, indicating steady pricing and commissions.

Cost discipline: Expenses declined 1.7%, demonstrating efficient cost control despite rising salary expenses.

Dividend growth: A 60% increase in interim dividend to 8.0c per share reflects management’s confidence in cash flows.

Increased equity profits: Investments in MTA, Phil Hoffmann Travel, and Australiareiser Group saw a 13.6% rise in profits.

Potential Concerns

⚠️ Revenue and transaction volume decline: TTV fell 6.9% to $2.05B, reflecting lower airfares and shifts in travel trends.

⚠️ Weaker profitability: Underlying EBITDA dropped 20.2%, and net profit fell 32.4%, indicating reduced earnings efficiency.

⚠️ Negative operating cash flow: -$42.1M vs. $12.3M positive in 1H24, due to timing of supplier payments and customer receipts.

⚠️ Impairments and restructuring: A $2.95M impairment was recorded due to the planned sale of Entertainment Logistix, a non-core asset.

Outlook & Guidance

📌 Travel Demand Stabilisation: Management anticipates a return to growth in TTV, with ongoing demand for mid-haul destinations like Japan, Bali, and Thailand.

📌 Cost Management Continues: Expect expense controls and selective investments, particularly in digital and network expansion.

📌 Strategic Portfolio Adjustments: Sale of Entertainment Logistix is progressing to streamline operations and focus on core travel businesses.

📌 Continued Dividend Payments: Given the dividend hike, further strong returns to shareholders are anticipated.

Market Positioning

The share price has been in a holding pattern so far in 2025 in the lead-up to these results.

Quick Take: H1FY25 ASX:HLO 12 month daily share price chart with 3 EMA and volume

Analyst Positioning

Revenue Forecasts:

    • Analysts project $234.24M for FY25 and $246.09M for FY26.
    • 1H FY25 revenue was $103.78M, meaning to reach the FY25 forecast, HLO would need to generate at least $130.46M in 2H FY25.
    • Given the 1H YoY decline (-7.6%), unless significant growth occurs in 2H (e.g., seasonal recovery, stronger bookings), the FY25 revenue forecast appears too optimistic. A downward revision may be warranted.
    • If revenue continues declining YoY at a similar rate, FY26 estimates might also need a downward revision.

EBITDA Forecasts:

      • Analysts forecast $44.12M for FY25 and $67.46M for FY26.
      • 1H FY25 EBITDA is $27.17M, meaning HLO would need $16.95M in 2H FY25 to meet the forecast.
      • Given a 20.2% YoY EBITDA decline, this suggests challenges in maintaining margin levels.
      • FY25 EBITDA may need to be revised downwards unless cost efficiencies significantly improve.
      • FY26’s $67.46M EBITDA projection seems highly optimistic, as it implies a major turnaround. A 15-20% downward adjustment may be needed.

Disclaimer: This information is provided purely for educational purposes. It takes no account of an individual’s personal financial circumstances and hence can in no way constitute financial advice. The above data may be subject to errors or inconsistencies for which the author takes no liability. It is imperative that all investors do their own research or if they need advice, seek it from a qualified financial adviser.

Quick Take: H1FY25 ASX:HLO

Quick Take: H1FY25 ASX:WTC

WiseTech Global – 1H25 Financial Report Summary

WiseTech Global Website

Overall Report Tone

WiseTech Global delivered strong revenue and profit growth in 1H25, supported by increased customer adoption of CargoWise, price adjustments, and operational efficiencies. The company continues to execute its ‘3P’ strategy (Product, Penetration, Profitability) while expanding its global trade management capabilities. However, delays in the rollout of breakthrough products have led the company to expect revenue at the lower end of FY25 guidance.

Financial Results (USD, in millions)

Metric 1H25 1H24 % Change
Revenue 381.0 327.0 +17%
Adjusted EBITDA Not disclosed Not disclosed
Operating Profit 149.7 114.5 +31%
Net Profit After Tax (NPAT) 106.4 77.1 +38%
Underlying NPAT 112.1 83.8 +34%
Basic EPS (cents) 32.0 23.3 +37%
Operating Cash Flow 163.2 138.3 +18%
Dividend (cps) 6.7 6.2 +8%

Positive Surprises or Potential Concerns

  • 📈 Revenue up 17%, with 15% organic growth, driven by increased CargoWise adoption and pricing power.
  • 🏆 Gross profit margin improved to 85% (from 83%), reflecting cost efficiencies and scalability.
  • 💰 Operating cash flow up 18%, demonstrating the company’s strong cash-generative business model.
  • ⚠️ Guidance revised lower on revenue, citing delays in the rollout of key breakthrough products.

Results vs Market Expectations

  • Revenue was in line with expectations but now forecasted at the lower end of FY25 guidance.
  • EBITDA margin expected at the higher end of guidance, thanks to successful cost-reduction initiatives.
  • M&A activity contributed positively, including the acquisitions of BSM Global and ImpexDocs.
  • Board and management changes, including the resignation of four non-executive directors, could create short-term uncertainty.

Outlook and Guidance Statements

  • 📉 Revenue now expected at the bottom of the guidance range due to delays in product rollouts.
  • 📊 EBITDA margin expected at the top end of the range, driven by ongoing efficiency programs.
  • 🌍 Continued expansion into global trade management via strategic acquisitions (BSM Global, ImpexDocs).
  • 🔍 Major customer wins, including Nippon Express and LOGISTEED, further strengthening the CargoWise rollout pipeline.

Analyst Positioning

Based on WiseTech Global’s 1H25 financial report, here’s how they are tracking relative to analyst forecasts for 2025 and 2026:

Revenue Tracking

  • 1H25 revenue: $381M, up 17% YoY.
  • If we annualize this, it suggests a full-year 2025 revenue of ~$762M, which is slightly below the analyst forecast of $787.5M.
  • The company also guided that full-year revenue is expected to be at the lower end of their guidance range, implying some softness in H2.
  • Given this, analysts may need to slightly trim their 2025 revenue expectations.
  • 2026 outlook: No explicit 2026 guidance was provided, but continued customer growth and the rollout of new products suggest that the $1.03B forecast for 2026 may still be achievable, but execution risks remain.

EBITDA Tracking

  • 1H25 operating profit: $149.7M, up 31% YoY.
  • EBITDA not explicitly stated, but likely close to ~$192M for 1H25.
  • If we annualize this, it suggests a full-year 2025 EBITDA of ~$384M, which is slightly below the $399.55M analyst forecast.
  • The company noted that its EBITDA margin will be at the top end of guidance due to cost efficiencies, which may help them get closer to analyst expectations.
  • 2026 outlook: If cost efficiencies continue and revenue growth picks up, the $548.95M EBITDA target for 2026 remains plausible, but risks exist depending on the pace of product rollouts.

Quick Take: H1FY25 ASX:WTC 12 month daily share price chart with 3 EMA and volume

Quick Take: H1FY25 ASX:WTC daily price chart with fib retracement levels


Disclaimer: This information is provided purely for educational purposes. It takes no account of an individual’s personal financial circumstances and hence can in no way constitute financial advice. The above data may be subject to errors or inconsistencies for which the author takes no liability. It is imperative that all investors do their own research or if they need advice, seek it from a qualified financial adviser.

Quick Take: H1FY25 ASX:WTC

Quick Take: H1FY25 ASX:SDR

SiteMinder Limited – 2025 Interim Results Summary

Company Website

Overall Report Tone

SiteMinder Limited reported revenue growth of 14% year-over-year, driven by robust subscription and transaction revenue increases. While the company remains loss-making, underlying EBITDA turned positive compared to a loss in the prior period. The company continues executing its Smart Platform strategy, which is expected to drive further revenue and margin expansion.

Financial Summary

Metric HY24 (Dec 2024) HY23 (Dec 2023) Change
Revenue $104.5m $91.7m +14%
Reported EBITDA $0.3m $(2.2m) +116%
Underlying EBITDA $5.3m $(1.2m) +533%
Net Loss After Tax (NPAT) $(13.9m) $(14.9m) +7%
Annualised Recurring Revenue (ARR) $216.2m $182.5m +18%
Operating Cash Flow $5.8m $1.5m +287%
Net Tangible Assets Per Share 3.47c 8.16c -57%
Dividend Declared None None N/A

Pro-Forma Adjustments & Impact

  • Annualised Recurring Revenue (ARR) growth of 18% highlights continued momentum in subscription and transaction revenue.
  • Positive underlying EBITDA of $5.3m vs. a prior period loss indicates operating leverage improvements.
  • Growth in high-value customers, with the number of rooms added exceeding 50%.
  • LTV/CAC ratio improved from 5.3x to 6.1x, reflecting stronger customer economics.

Positive Surprises / Potential Concerns

Revenue growth is tracking ahead of historical trends, but not fast enough to meet analyst expectations.
EBITDA is improving, though concerns remain about the pace of profitability expansion.

⚠️ Net loss remains significant at $13.9m, though improved from the prior period.
⚠️ Higher restructuring and technology investments could weigh on short-term margins.

Outlook & Guidance

Targeting 30% organic revenue growth in the medium term with continued Smart Platform execution.
Expecting to be EBITDA and free cash flow positive in FY25, reinforcing financial sustainability.

⚠️ Macro uncertainty in the travel sector remains a potential headwind.
⚠️ Scaling transaction products is key to achieving medium-term margin expansion.

Analyst Positioning

📊 2025 analyst forecasts: Revenue of $237.39m and EBITDA of $17.95m.
📊 2026 analyst forecasts: Revenue of $304.64m and EBITDA of $39.28m.

🔻 Revenue growth trajectory lags analyst expectations – While revenue grew 14%, it falls short of the pace required to meet analyst forecasts of $237.39m in 2025 and $304.64m in 2026.

🔻 EBITDA expansion is slower than required – With a current underlying EBITDA of $5.3m, SiteMinder will need substantial acceleration to reach $17.95m in 2025 and $39.28m in 2026.

🔻 No full-year guidance provided, leading to uncertainty about achieving medium-term growth targets.

🔻 Margin pressures persist, as restructuring and technology investments continue to weigh on profitability.

Quick Take: H1FY25 ASX:SDR 12 month share price chart with 3 EMA and volume


Disclaimer: This information is provided purely for educational purposes. It takes no account of an individual’s personal financial circumstances and hence can in no way constitute financial advice. The above data may be subject to errors or inconsistencies for which the author takes no liability. It is imperative that all investors do their own research or if they need advice, seek it from a qualified financial adviser.

Quick Take: H1FY25 ASX:SDR

Quick Take: H1FY25 ASX:CTT

Cettire Limited – 2025 Interim Results Summary

Company Website

Overall Report Tone

Cettire Limited delivered solid revenue growth of 11% year-over-year, despite challenging conditions in the global luxury market. However, net profit declined by 63%, primarily due to margin compression and sector-wide discounting. The company’s balance sheet remains strong, with cash increasing to $101.1 million and no financial debt.

Financial Summary

Metric HY24 (Dec 2024) HY23 (Dec 2023) Change
Revenue $393.98m $354.26m +11%
Gross Profit $70.81m $82.18m -14%
Net Profit After Tax (NPAT) $4.75m $12.81m -63%
Operating Cash Flow $29.8m $65.0m -54%
Net Tangible Assets Per Share 2.7c 5.9c -54%
Dividend Declared None None N/A

Pro-Forma Adjustments & Impact

  • Revenue growth of 11% was supported by a 21% increase in active customers and a 4% rise in average order value.
  • Gross profit margin declined, reflecting higher discounting activity across the sector.
  • Lower advertising spend (-10%) helped mitigate some margin pressure.
  • Cash position strengthened to $101.1m, providing flexibility for future growth initiatives.

Positive Surprises / Potential Concerns

Revenue growth of 11% despite headwinds in the luxury retail sector.
Strong customer engagement, with 67% of revenue from repeat customers.
⚠️ Net profit down 63%, reflecting margin pressures and softer industry demand.
⚠️ Operating cash flow down 54%, although the company remains cash-rich.

Results vs Market Expectations

Revenue growth met expectations, underpinned by higher order values and customer retention.
Cost control in marketing and advertising helped protect margins.
⚠️ Weaker gross profit margins were slightly below expectations, likely due to aggressive sector-wide discounting.
⚠️ Lower earnings may raise concerns about long-term profitability trends.

Outlook & Guidance

Customer acquisition strategy remains strong, supporting continued growth.
Solid cash balance enables investment in technology and fulfilment improvements.
⚠️ Luxury sector demand remains uncertain, with continued price sensitivity.
⚠️ No formal earnings guidance provided, leaving some uncertainty for investors.

Quick Take: H1FY25 ASX:CTT 12 month daily share price chart with 3 EMA and volume


Disclaimer: This information is provided purely for educational purposes. It takes no account of an individual’s personal financial circumstances and hence can in no way constitute financial advice. The above data may be subject to errors or inconsistencies for which the author takes no liability. It is imperative that all investors do their own research or if they need advice, seek it from a qualified financial adviser.

Quick Take: H1FY25 ASX:CTT