Cuscal Limited – 2025 Interim Results Summary
Overall Report Tone
Cuscal Limited delivered steady revenue growth of 9% year-over-year, supported by higher transaction volumes and net operating income. Pro-forma profitability was strong, with pro-forma NPAT up 42%, reflecting solid business performance when adjusting for IPO-related costs. The company’s IPO listing on 25 November 2024 incurred one-off expenses, which impacted statutory results but should not be viewed as a recurring issue.
Financial Summary
| Metric | HY24 (Dec 2024) (Pro-Forma) | HY23 (Dec 2023) (Pro-Forma) | Change |
|---|---|---|---|
| Revenue | $249.0m | $229.2m | +9% |
| Pro-Forma Profit Before Tax | $30.8m | $23.5m | +31% |
| Pro-Forma Net Profit After Tax | $21.5m | $15.1m | +42% |
| Pro-Forma EBITDA | $35.6m | $29.5m | +21% |
| Net Tangible Assets Per Share | $1.31 | $1.13 | +16% |
| Dividend Per Share (Final) | 5.0c | N/A | New |
| Special Dividend Per Share | 4.5c | N/A | New |
Pro-Forma Adjustments & Impact
- One-off IPO-related expenses of $13.4m significantly impacted statutory NPAT, but adjusting for these costs, pro-forma NPAT rose by 42%.
- Pro-forma EBITDA margin expanded to 24.3%, reflecting strong operating leverage.
- Regulatory capital remains strong at 27.1%, well above prudential requirements.
Positive Surprises / Potential Concerns
✅ Revenue grew by 9%, supported by strong transaction volumes.
✅ Pro-forma NPAT up 42%, highlighting the strong underlying business performance.
⚠️ IPO-related costs impacted statutory profit, but this is a one-off event.
⚠️ Higher operating expenses, particularly in technology investments and regulatory compliance, are expected to continue.
Results vs Market Expectations
✅ Revenue growth met expectations, driven by higher transaction volumes.
✅ Dividend payments introduced, providing shareholder returns.
✅ Pro-forma profit and margins exceeded expectations, showing strong business fundamentals.
⚠️ Higher technology and compliance costs will remain a focus area for investors.
Outlook & Guidance
✅ Strong transaction volume growth supports future revenue expansion.
✅ Regulatory capital ratios remain strong, providing financial stability.
⚠️ Higher costs from technology and compliance investments are expected to continue.
⚠️ Management expects to modestly exceed FY25 pro-forma profit forecasts.
Disclaimer: This information is provided purely for educational purposes. It takes no account of an individual’s personal financial circumstances and hence can in no way constitute financial advice. The above data may be subject to errors or inconsistencies for which the author takes no liability. It is imperative that all investors do their own research or if they need advice, seek it from a qualified financial adviser.
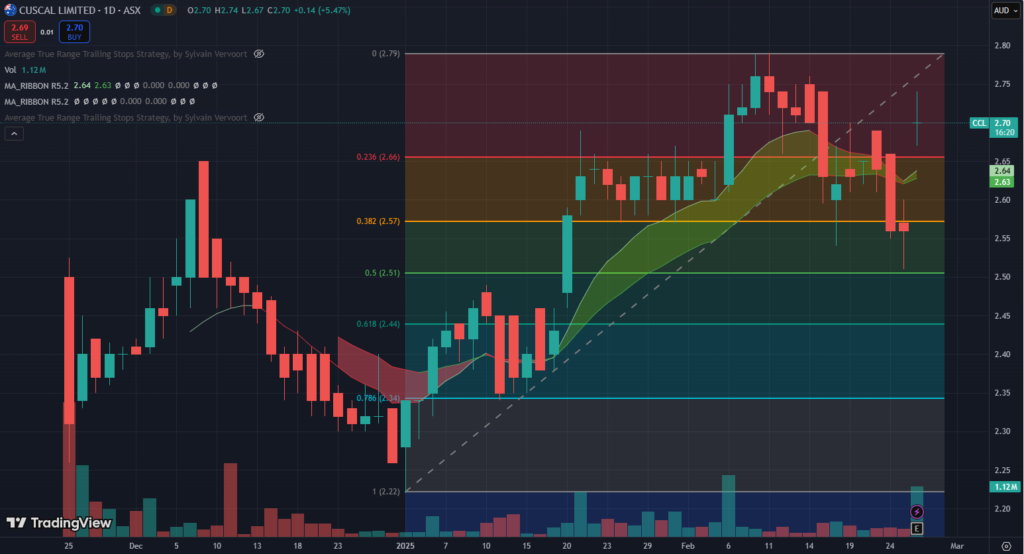
Quick Take: H1FY25 ASX:CCL