Author: Nathan

Quick Take: H1FY25 ASX:SHA

SHAPE Australia – 2025 Interim Results Summary

Website: shape.com.au

Overview

SHAPE Australia Corporation Limited (ASX: SHA) delivered a strong first-half performance, with record revenue growth of 15.4% and a 25.6% increase in net profit after tax (NPAT). The company continues to expand its presence in non-office sectors, new geographic locations, and service offerings, positioning itself for sustained growth.

Financial Performance (Per Share Basis Where Applicable)

Metric 31 Dec 2024 31 Dec 2023 % Change
Revenue ($’000) 478,985 415,201 +15.4%
EBITDA ($’000) 14,789 12,239 +20.8%
Operating Cash Flow ($’000) 31,978 17,557 +82.1%
Earnings Before Tax ($’000) 13,656 10,846 +26.0%
Normalised EPS (cents) 11.36 8.99 +26.4%
Net Tangible Assets per Share (cents) 30.70 24.05 +27.7%

Key Highlights and Concerns

  • Record revenue of $505.6M (including associate revenue), supported by strong project wins of $531.5M.
  • Gross margin remained stable at 9.1%, indicating strong cost control.
  • Significant growth in non-office sectors, particularly Defence, Education, and Healthcare, contributing $168.1M in revenue.
  • Cash and marketable securities increased by 21.5% to $118.9M, enhancing financial flexibility.
  • Challenges in facade remediation projects, with a significant decline in project wins in this segment.

Outlook Commentary

  • SHAPE expects continued revenue growth in 2H FY25, supported by a strong order backlog of $516M.
  • Expansion in Gold Coast, Newcastle, and Tasmania is set to drive geographic growth.
  • The Defence sector rebound presents a strong pipeline of work opportunities.
  • The company is focused on enhancing its modular and design & build services to diversify revenue streams.

Guidance Statements

  • The company declared a fully franked interim dividend of 10.0 cents per share, up from 9.0 cents in the previous period.
  • Management remains optimistic about maintaining margin stability while growing revenue across diversified segments.
  • SHAPE anticipates strong client retention and repeat business, as reflected in its high Net Promoter Score (NPS) of +88.

Result vs. Market Expectations

  • The results were broadly in line with market expectations, with higher-than-expected profit growth.
  • Positive cash flow and increased dividend could support further share price appreciation.
  • Investors will likely focus on continued expansion in non-office sectors and improvement in new business segments.

Market Positioning

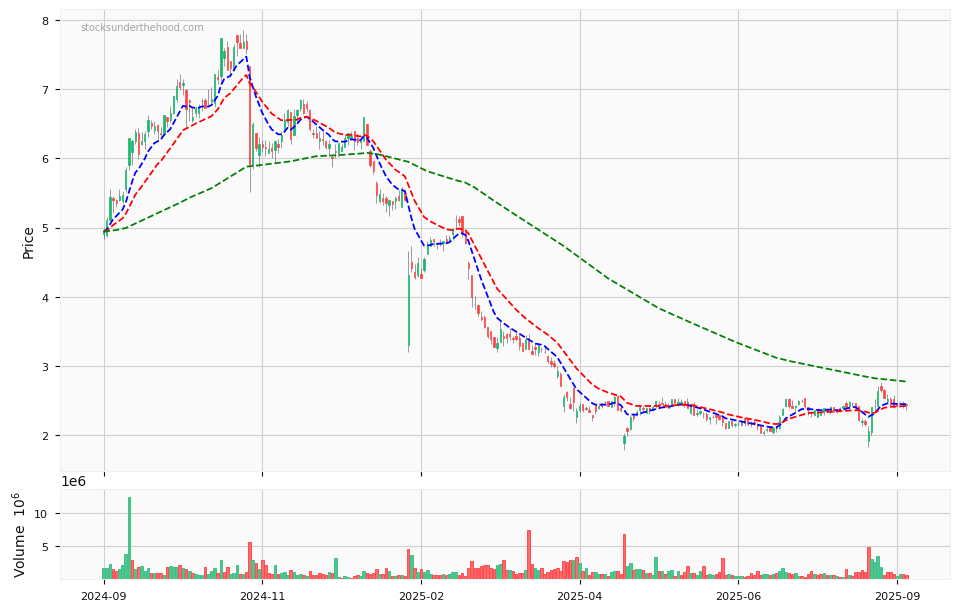
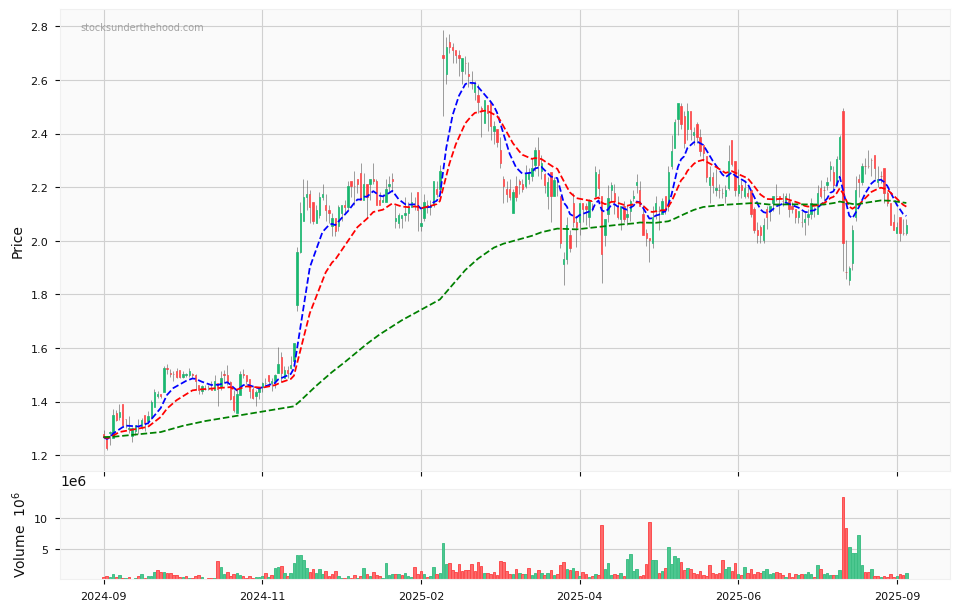
  • SHAPE’s share price heading into the report was steady, with limited volatility.
  • The market will be keen on management’s execution of its geographic and service expansion strategy to drive future earnings growth.

Disclaimer: This information is provided purely for educational purposes. It takes no account of an individual’s personal financial circumstances and hence can in no way constitute financial advice. The above data may be subject to errors or inconsistencies for which the author takes no liability. It is imperative that all investors do their own research or if they need advice, seek it from a qualified financial adviser.

Quick Take: H1FY25 ASX:SHA

Quick Take: H1FY25 ASX:MIN

Mineral Resources Limited – 1H25 Interim Results Summary

www.mineralresources.com.au

Overall Tone

Mineral Resources Limited (MIN) reported a significant net loss for 1H25, largely impacted by lower commodity prices, impairment charges, and foreign exchange losses. Despite these challenges, the Mining Services division delivered record earnings, benefiting from increased activity at Onslow Iron. The company has maintained strong liquidity but chose not to declare an interim dividend, prioritizing balance sheet flexibility.

Financial Summary

Metric 1H25 ($M) 1H24 ($M) % Change
Revenue 2,290 2,515 -9%
Underlying EBITDA 302 675 -55%
Operating Cash Flow (656) 624 N/A
Adjusted Earnings Before Tax (EBT) (1,154) 491 N/A
Normalised EPS (cents) (410.42) 281.98 N/A

Positive Surprises or Potential Concerns

  • Mining Services revenue grew 18% to $1,716M, with EBITDA up 49% to $379M.
  • Onslow Iron ramped up successfully, contributing $54M in EBITDA.
  • Iron ore and lithium segments struggled due to weaker prices and operational adjustments.
  • Bald Hill lithium project placed into care & maintenance (C&M) due to market conditions.
  • $352M in impairment charges and $232M foreign exchange losses weighed on results.

Debt Position

MinRes currently holds a substantial debt load, with total borrowings at $5.8B, including senior unsecured notes and revolving credit facilities. The debt profile consists of long-tenor instruments, with no maturities until mid-2027, providing some financial flexibility. However, foreign exchange losses of $331M have negatively impacted the company’s net debt position, highlighting risks associated with currency fluctuations.

Outlook Commentary

MinRes expects Mining Services to continue expanding, supported by new contract wins and Onslow Iron ramp-up. Iron ore performance depends on price recovery, while lithium operations will be closely managed amid weak market conditions. The company is evaluating the potential sale of Yilgarn Hub assets.

Guidance Statements

The company maintains a cautious outlook, focusing on liquidity preservation as Onslow Iron nears completion. Cost-cutting measures in lithium operations are expected to improve financials in 2H25. Capital expenditures will be heavily weighted toward completing Onslow Iron.

Results vs Market Expectations

The reported loss was significantly below expectations, as analysts anticipated weaker earnings but not to this extent. The market had priced in a challenging environment for lithium and iron ore, but the extent of impairments and foreign exchange losses will likely surprise investors. The decision to not declare an interim dividend may also disappoint some shareholders.

Market Positioning

  • Share price performance leading into the report: Weak, reflecting softer lithium and iron ore prices.
  • 1-week movement: Down, likely in anticipation of a poor earnings result.
  • 52-week high comparison: The stock remains well below its 52-week high, reflecting the challenging commodity market and financial pressures.


Disclaimer: This information is provided purely for educational purposes. It takes no account of an individual’s personal financial circumstances and hence can in no way constitute financial advice. The above data may be subject to errors or inconsistencies for which the author takes no liability. It is imperative that all investors do their own research or, if they need advice, seek it from a qualified financial adviser.

Quick Take: H1FY25 ASX:MIN

Quick Take: H1FY25 ASX:HUM

Humm Group Limited – 2025 Half Year Results Summary

Website: Humm Group

Overall Tone

Humm Group delivered strong financial growth in 1H25, with a significant turnaround in statutory profit and cash profit. The company benefitted from higher net interest income, improved cost efficiency, and reduced credit impairment charges. Despite some restructuring costs and ongoing operational challenges, Humm is well-positioned for further growth in commercial lending and Point of Sale Payment Plans (PosPP).

Financial Results Summary

Metric 1H25 1H24 YoY Change
Revenue (Interest & Fee Income) $336.0M $298.7M +12.5%
Net Interest Income (NII) $130.6M $122.7M +6.4%
Statutory Profit After Tax $27.3M $(6.0)M +555%
Cash Profit After Tax $29.8M $13.6M +119%
Credit Impairment Charge $33.8M $48.0M -30%
Operating Expenses $85.1M $97.4M -13%
ROCE (Return on Cash Equity) 10.9% 4.9% +600bps
Assets Under Management (AUM) $5.32B $4.65B +14%
Interim Dividend Per Share 1.25c 0.75c +67%

Positive Surprises & Potential Concerns

  • Positive: Statutory profit rebounded strongly from a loss in 1H24 to a $27.3M profit.
  • Positive: Credit impairment charges fell 30%, reflecting improved lending quality and lower loss rates.
  • Positive: Cost management initiatives delivered $15.6M in savings, driving a 13% reduction in operating expenses.
  • Concern: Net interest margin (NIM) remained flat at 5.5%, as funding costs increased.
  • Concern: Ongoing restructuring and transformation costs may weigh on future profitability.

Outlook Commentary

  • Commercial lending to remain a key growth driver, supported by strong demand from SMEs in Australia and New Zealand.
  • PosPP expansion into UK, Canada, and Ireland is expected to contribute positively in 2H25.
  • Continued cost efficiency focus to support margin expansion and profitability improvements.

Guidance Statements

  • Revenue Growth: Expected to be driven by volume expansion across core lending and PosPP.
  • Profitability: Margins to remain stable, with cost savings offsetting any increase in funding costs.
  • Dividend Growth: Payout ratio expected to be maintained, reflecting confidence in future earnings.

Result vs. Market Expectations

  • Stronger-than-expected profit turnaround, exceeding analyst forecasts.
  • Revenue growth aligned with expectations, but cost savings and lower impairments outperformed.
  • Dividend increase of 67% was a positive surprise, reflecting confidence in cash flow sustainability.

Market Positioning

  • Share price remained stable leading into results, as investors anticipated a profit rebound.
  • Stock trading near mid-range of 52-week performance, with upside potential if growth initiatives continue delivering.
  • Humm Group is strengthening its position in non-bank lending, with expansion plans supporting long-term growth.
Quick Take: H1FY25 ASX:HUM - 12 month daily price chart with 3 EMA and volume indicators

Disclaimer: This information is provided purely for educational purposes. It takes no account of an individual’s personal financial circumstances and hence can in no way constitute financial advice. The above data may be subject to errors or inconsistencies for which the author takes no liability. It is imperative that all investors do their own research or if they need advice, seek it from a qualified financial adviser.

Quick Take: H1FY25 ASX:HUM

Quick Take: 2024AGM ASX:SHV

Select Harvests Limited – 2024 Annual General Meeting Summary

Website: Select Harvests

Overall Tone

Select Harvests Limited (SHV) reported a significant turnaround in financial performance, achieving a positive net profit after tax (NPAT) of $1.5 million, compared to a substantial loss in the previous year. The company’s record almond crop and improving pricing environment contributed to the recovery. Operational efficiencies and strategic transformation initiatives continue to strengthen the company’s future outlook.

Financial Results Summary

Metric FY24 FY23 YoY Change
Revenue $337M
Net Profit After Tax (NPAT) $1.5M -$114.5M +116M
Operating Cash Flow $21.3M $3.3M +545%
Total Almond Crop 29,527MT 19,771MT +49.3%
Average Almond Price $7.69/kg
Net Debt $162.3M
Gearing Ratio 33.8% 29% (post-capital raise)

Positive Surprises & Potential Concerns

  • Positive: Record almond crop of 29,527MT, exceeding expectations and improving margins.
  • Positive: Debt reduction of $71.3M, significantly strengthening the balance sheet.
  • Concern: Ongoing challenges in NSW operations, with persistent wet seasons affecting yields.
  • Concern: Inflationary cost pressures, particularly in labor, fertilizer, and water management.

Outlook Commentary

  • Strong global almond demand expected to drive further price increases, with forecasts around $9.20/kg.
  • Cost optimization measures to continue, focusing on labor, procurement, and automation initiatives.
  • Investment in processing capacity (Project Optimus) to enhance efficiency and increase third-party processing volumes.

Strategic Transformation Initiatives

  • Yield and Quality Improvements: Investments in better pollination, harvest techniques, and water management.
  • Cost Management: Reducing operational expenses while maintaining productivity.
  • Market Expansion: Increased focus on China and India, capitalizing on premium product demand.
  • Processing Expansion: Project Optimus to increase capacity by 10,000MT by 2026.

Result vs. Market Expectations

  • Stronger-than-expected recovery, with NPAT turning positive after a difficult prior year.
  • Higher-than-expected almond prices, driven by lower US stockpiles and strong global demand.
  • Operational improvements progressing well, with cost reductions exceeding initial targets.

Market Positioning

  • Share price leading into AGM showed positive momentum, reflecting renewed investor confidence.
  • Trading near mid-range of its 52-week performance, with further upside potential tied to higher almond pricing.
  • Strategic focus on cost control and processing efficiency, positioning SHV as a low-cost, high-quality almond producer.

Disclaimer: This information is provided purely for educational purposes. It takes no account of an individual’s personal financial circumstances and hence can in no way constitute financial advice. The above data may be subject to errors or inconsistencies for which the author takes no liability. It is imperative that all investors do their own research or if they need advice, seek it from a qualified financial adviser.

Quick Take: 2024AGM ASX:SHV

Quick Take: H1FY25 ASX:HUB

HUB24 Limited – 2025 Half Year Results Summary

Website: HUB24

Overall Tone

HUB24 Limited reported strong financial results for the first half of FY25, driven by robust platform net inflows and continued expansion in funds under administration (FUA). The company achieved record revenue and profitability, with significant increases in net profit and earnings per share. Strategic acquisitions and product innovations have further strengthened HUB24’s market position in the wealth management technology sector.

Financial Results Summary

Metric Dec-24 Dec-23 YoY Change
Revenue $195.2M $156.7M +25%
Underlying EBITDA $77.6M $55.0M +41%
Net Profit After Tax (NPAT) $36.5M $21.5M +75%
Earnings Per Share (EPS) 40.92c 26.53c +54%
Interim Dividend Per Share 24.0c 18.5c +30%
Net Tangible Assets Per Share $1.09 $0.87 +25%

Positive Surprises & Potential Concerns

  • Positive: Platform net inflows of $9.5B (+31%), boosting total FUA to $120.9B (+33%).
  • Positive: Strong growth in platform revenue (+29%), reflecting increasing adviser adoption.
  • Concern: Higher operating expenses (+16% YoY), mainly due to strategic investments and acquisitions.
  • Concern: No major cost savings initiatives disclosed, which could impact margins in a high-growth environment.

Outlook Commentary

  • Continued growth expected in platform FUA, supported by adviser onboarding and product innovation.
  • Expansion in tech solutions revenue, leveraging Class and HUBconnect platforms.
  • Operational efficiencies and cost control measures to help sustain profit margin improvements.

Guidance Statements

  • Revenue Growth: Expected to remain strong, with double-digit growth anticipated in 2H25.
  • Profitability: Margins expected to improve, benefiting from scale efficiencies and operational leverage.
  • Dividend Policy: Maintaining 40-60% payout ratio, with a focus on sustainable shareholder returns.

Result vs. Market Expectations

  • Revenue and profit exceeded expectations, reflecting higher platform net inflows and strong cost discipline.
  • Dividend increase (24.0c per share) was ahead of analyst estimates, reinforcing HUB24’s confidence in its growth outlook.
  • Some concerns about rising costs, though market reaction remained positive given the overall earnings momentum.

Market Positioning

  • Share price performance leading into results was strong, reflecting positive sentiment around HUB24’s market leadership.
  • Trading near 52-week highs, with investors recognizing scalability and growth potential in the wealth tech sector.
  • Continued investment in technology and acquisitions, positioning HUB24 as a leading provider in the financial services platform space.

This information is provided purely for educational purposes. It takes no account of an individual’s personal financial circumstances and hence can in no way constitute financial advice. The above data may be subject to errors or inconsistencies for which the author takes no liability. It is imperative that all investors do their own research or if they need advice, seek it from a qualified financial adviser.

Quick Take: H1FY25 ASX:HUB

Quick Take: H1FY25 ASX:XRF

XRF Scientific Limited – 2025 Half Year Results Summary

Website: XRF Scientific

Overall Tone

XRF Scientific Limited delivered record half-year results, showcasing strong revenue and profit growth driven by increased sales of consumables and equipment. The company benefitted from global mining sector activity, improved operational efficiencies, and successful acquisitions. Despite a flat revenue performance, profitability improved, underpinned by higher margins and cost efficiencies.

Financial Results Summary

Metric Dec-24 Dec-23 YoY Change
Revenue $28.7M $28.6M +0.3%
Earnings Before Interest & Tax (EBIT) $6.91M $6.31M +9.5%
Net Profit After Tax (NPAT) $5.01M $4.48M +11.8%
Net Tangible Assets Per Share $0.26 $0.25 +4.0%
Earnings Per Share (EPS) 3.6c 3.3c +9.1%
Interim Dividend Per Share Nil Nil

Positive Surprises & Potential Concerns

  • Positive: EBIT and NPAT growth outpaced revenue growth, indicating strong cost control and operational efficiency.
  • Positive: Record sales in consumables division, driven by mining and industrial demand.
  • Concern: Revenue growth was modest, reflecting a mixed performance across business segments.
  • Concern: No interim dividend declared, despite strong earnings growth.

Outlook Commentary

  • Strong demand for consumables and capital equipment expected to drive revenue growth in 2H25.
  • Recent acquisitions of Orbis Mining and Labfit to contribute positively to future earnings.
  • Ongoing investment in product innovation, with new xrTGA instrument expected to be a key revenue driver.

Guidance Statements

  • Revenue Growth: Expected to accelerate in 2H25, led by international expansion and new product sales.
  • Profitability: Margins expected to remain strong, benefiting from cost efficiencies and product mix improvements.
  • Cash Flow Management: Continued focus on maintaining a strong balance sheet and funding growth initiatives.

Result vs. Market Expectations

  • EBIT and NPAT exceeded analyst expectations, driven by higher gross margins and strong consumables demand.
  • Revenue slightly below expectations, as some capital equipment sales were delayed.
  • No interim dividend, which was in line with prior company policy of paying a single annual dividend.

Market Positioning

  • Share price has been stable leading into results, reflecting investor confidence in earnings resilience.
  • Stock is trading near its 52-week high, supported by strong profitability trends and strategic acquisitions.
  • Positioned as a leader in analytical lab solutions, with growing international footprint and strong mining sector exposure.

Disclaimer: This information is provided purely for educational purposes. It takes no account of an individual’s personal financial circumstances and hence can in no way constitute financial advice. The above data may be subject to errors or inconsistencies for which the author takes no liability. It is imperative that all investors do their own research or if they need advice, seek it from a qualified financial adviser.

Quick Take: H1FY25 ASX:XRF

Quick Take: H1FY25 ASX:MLG

MLG Oz Limited – 2025 Half Year Results Summary

Website: MLG Oz

Overall Tone

MLG Oz Limited reported strong revenue growth for the half-year, driven by increased activity in the gold industry and haulage services. However, profitability declined significantly due to lower crushing and screening revenue, higher depreciation from recent capital investments, and delays in new projects. The company remains optimistic about the second half, with new projects expected to improve margins.

Financial Results Summary

Metric Dec-24 Dec-23 YoY Change
Revenue $272.9M $226.4M +20.5%
Net Profit After Tax $4.08M $7.12M -42.7%
EBITDA $29.3M $28.5M +2.8%
Operating Cash Flow $14.7M $24.6M -40.2%
Net Tangible Assets Per Share $1.02 $0.94 +8.5%

Positive Surprises & Potential Concerns

  • Positive: Revenue increased 20.5%, supported by high demand in the gold sector and haulage services.
  • Positive: Pricing adjustments aligned with inflation, ensuring revenue resilience.
  • Concern: Net profit dropped 42.7% due to lower crushing and screening revenue and higher depreciation costs.
  • Concern: Delays in new projects led to underutilization of fleet and operational inefficiencies.

Outlook Commentary

  • New projects in H2 FY25 are expected to boost revenue and improve profit margins.
  • Continued demand in mining services, with expanded scope in haulage and road construction.
  • Operational efficiencies to be optimized, focusing on deploying the fleet effectively and increasing contract coverage for fixed costs.

Guidance Statements

  • Revenue Growth: Expected to remain strong, driven by ongoing contract expansions and new project commencements.
  • Profitability: Margins expected to improve in 2H FY25, supported by fleet deployment and cost controls.
  • Cash Flow Management: Focus on optimizing working capital to sustain healthy cash flow levels.

Result vs. Market Expectations

  • Revenue growth exceeded expectations, reflecting continued strength in haulage and mining services.
  • Net profit below expectations, due to higher costs and project delays.
  • No interim dividend declared, consistent with expectations as MLG prioritizes reinvestment in growth initiatives.

Market Positioning

  • Share price performance leading into results was mixed, reflecting strong revenue growth but margin pressures.
  • Trading within mid-range of its 52-week high, as investors assess profitability concerns against long-term growth potential.
  • Well-positioned for long-term growth, supported by strong industry demand, strategic capital investments, and expanding project pipeline.

Disclaimer: This information is provided purely for educational purposes. It takes no account of an individual’s personal financial circumstances and hence can in no way constitute financial advice. The above data may be subject to errors or inconsistencies for which the author takes no liability. It is imperative that all investors do their own research or if they need advice, seek it from a qualified financial adviser.


Quick Take: H1FY25 ASX:MLG

Quick Take: H1FY25 ASX:ARB

ARB Corporation Limited – 2025 Half Year Results Summary

Website: ARB Corporation

Overall Tone

ARB Corporation reported modest revenue growth for the half-year, driven by strong export sales and strategic acquisitions. However, profitability was slightly lower due to increased expenses related to acquisitions and operational expansions. Despite a challenging economic environment, ARB remains well-positioned with a strong balance sheet and strategic growth initiatives.

Financial Results Summary

Metric Dec-24 Dec-23 YoY Change
Sales Revenue $361.7M $341.5M +5.9%
Total Revenue $366.7M $342.7M +7.0%
Profit Before Tax $70.3M $70.8M -0.7%
Net Profit After Tax $50.95M $51.27M -0.6%
Interim Dividend Per Share 34.0c 34.0c 0.0%
Net Tangible Assets Per Share $8.08 $7.12 +13.5%

Positive Surprises & Potential Concerns

  • Positive: Export sales grew 15.4% YoY, particularly in the U.S. market (+18.7%), benefiting from strong demand and partnerships.
  • Positive: ARB expanded its footprint with two new retail store acquisitions in Toowoomba, QLD, and Christchurch, NZ.
  • Concern: Operating profit declined 4.6% (excl. one-off adjustments), primarily due to acquisition costs and higher operating expenses.
  • Concern: Weaker Australian dollar and inflationary pressures impacted margins, requiring pricing adjustments.

Outlook Commentary

  • Continued growth expected in exports and aftermarket sales, particularly in the U.S. through ARB’s expanded ORW/4WP retail network.
  • Ongoing product innovation with new launches, including the Stealth Bar for Toyota LC70 and enhancements to the Earth Camper.
  • Cost control remains a focus, with efficiency improvements and pricing strategies to offset currency impacts and inflationary pressures.

Guidance Statements

  • Sales Growth: Expected to remain in the mid-single-digit range in 2H FY25.
  • Profitability: Anticipated to improve as acquisition-related costs subside and new investments begin contributing.
  • Cash Flow Management: Prioritizing inventory optimization and cost efficiencies to sustain a strong balance sheet.

Result vs. Market Expectations

  • Revenue growth aligned with market expectations, with export strength offsetting domestic market headwinds.
  • Profit slightly below expectations, largely due to one-time acquisition costs and increased employee expenses.
  • Dividend maintained at 34.0c per share, signaling confidence in long-term financial stability.

Market Positioning

  • Share price remained stable leading into results, reflecting confidence in export growth and strategic investments.
  • Stock trading near mid-range of its 52-week range, as investors weigh short-term cost pressures against long-term growth potential.
  • Long-term growth remains intact, driven by strong product innovation, international expansion, and strategic acquisitions.

Meta Description:


Disclaimer: This information is provided purely for educational purposes. It takes no account of an individual’s personal financial circumstances and hence can in no way constitute financial advice. The above data may be subject to errors or inconsistencies for which the author takes no liability. It is imperative that all investors do their own research or if they need advice, seek it from a qualified financial adviser.


Quick Take: H1FY25 ASX:ARB

Quick Take: H1FY25 ASX:BIO

Biome Australia Limited – 2025 Half Year Results Summary

Website: Biome Australia

Overall Tone

Biome Australia Limited reported a strong half-year performance, achieving maiden net profitability and continued revenue growth. The company recorded two consecutive quarters of positive EBITDA, driven by robust sales in its Activated Probiotics range. With a solid financial position and expanding international presence, Biome is well-positioned for future growth.

Financial Results Summary

Metric Dec-24 Dec-23 YoY Change
Revenue $8.86M $6.02M +47.4%
Statutory Net Profit After Tax $433K -$1.53M +128.4%
Gross Margin 61.0% 60.2% +0.8pp
Operating Cash Outflow -$1.12M -$654K -71%
Net Tangible Assets Per Share 2.00c 1.01c +98%

Positive Surprises & Potential Concerns

  • Positive: Strong revenue growth (+47.4% YoY) driven by Activated Probiotics and international expansion.
  • Positive: First-ever net profit, reflecting improved cost control and stronger gross margins.
  • Concern: Operating cash outflows, mainly due to bonus and long-term incentive (LTI) payments.
  • Concern: Inventory levels increased, potentially reflecting higher stock requirements for growth or a slowdown in demand.

Outlook Commentary

  • Continued growth expected, with expansion into Canada, UK, Ireland, and New Zealand showing early promise.
  • Ongoing investment in distribution footprint, with Australian points of sale increasing from 5,000 to 6,000.
  • Further margin expansion anticipated as economies of scale improve and operational efficiencies are realized.

Guidance Statements

  • Revenue Growth: Expected to maintain strong double-digit growth in upcoming periods.
  • Profitability: Focus on sustained positive EBITDA and net profit, while reinvesting in international expansion.
  • Cash Flow Management: Aiming to reduce operating cash outflows, ensuring financial sustainability.

Result vs. Market Expectations

  • Revenue growth exceeded expectations, reflecting strong demand and effective distribution expansion.
  • Profitability milestone surpassed estimates, highlighting the effectiveness of cost controls and operational efficiencies.
  • No dividends declared, in line with expectations as the company prioritizes reinvestment for growth.

Market Positioning

  • Share price performance leading into results was stable, reflecting confidence in Biome’s growth trajectory.
  • Trading near 52-week highs, supported by strong financial results and expanding market reach.
  • Positioned as a high-growth health and wellness company, with a differentiated product offering and increasing global presence.

Disclaimer: This information is provided purely for educational purposes. It takes no account of an individual’s personal financial circumstances and hence can in no way constitute financial advice. The above data may be subject to errors or inconsistencies for which the author takes no liability. It is imperative that all investors do their own research or if they need advice, seek it from a qualified financial adviser.

Quick Take: H1FY25 ASX:JDO

Judo Capital Holdings – 2025 Half Year Results Summary

Website: Judo Bank

Overall Tone

Judo Capital Holdings delivered solid financial results for the six months ending 31 December 2024, demonstrating continued growth in its SME lending franchise. While statutory profits declined year-over-year due to higher costs and loan impairments, underlying profit before tax increased by 33% due to loan book expansion and prudent cost management. The company remains well-capitalized with strong liquidity and improving efficiency metrics.

Financial Results Summary

Metric Dec-24 Jun-24 Dec-23 HoH Change YoY Change
Revenue (Statutory Operating Income) $201M $201M 0% 0%
Net Interest Income $193.0M $190.8M $195.2M +1% -1%
Statutory Net Profit After Tax $40.9M $24.0M $45.9M +70% -11%
Adjusted EBITDA Not disclosed
Operating Cash Flow $(74.3)M $370.2M $271.9M
Adjusted Earnings Before Tax (EBT) $56.7M $42.7M $67.4M +33% -16%
Normalised EPS 3.7c 2.2c 4.1c +68% -10%
Net Tangible Assets Per Share $1.39 $1.36 +2.2%

Positive Surprises & Potential Concerns

  • Positive: Strong loan book growth (+9% HoH to $11.6B), well above system growth, supported by regional expansion and recruitment of relationship bankers.
  • Positive: Credit impairment expenses decreased significantly (-33% HoH), reflecting better risk management and portfolio performance.
  • Concern: Net Interest Margin (NIM) declined by 4bps to 2.81%, primarily due to the impact of refinancing the Term Funding Facility (TFF).
  • Concern: Cost-to-Income Ratio (CTI) increased to 57.4% (up from 56.3% in Jun-24), driven by higher employee benefits expenses and IT costs.

Outlook Commentary

  • The business lending market remains strong, particularly for SMEs, but some sectors face challenges due to higher interest rates and economic uncertainty.
  • Judo expects to demonstrate clear operating leverage from 2H25, with an improving NIM and controlled expenses.
  • Growth is expected to continue, supported by regional expansion and ongoing investment in customer relationships.

Guidance Statements

  • Loan Book (GLA): Expected to grow to $12.7B – $13.0B by FY25.
  • Net Interest Margin (NIM): Gradual improvement expected in 2H25, targeting 3% by June 2025.
  • Cost-to-Income Ratio (CTI): Expected to remain broadly stable, with an improvement in 2H25.
  • Profitability (PBT/ROE): Targeting 15% growth in PBT compared to FY24, with a low- to mid-teens ROE.

Result vs. Market Expectations

  • Judo’s profit beat expectations due to lower-than-expected impairment expenses and stronger loan growth.
  • The decline in NIM and the increase in CTI were concerns but were largely expected by analysts.
  • No dividends were declared, which was in line with the company’s strategy of reinvesting profits into growth.

Market Positioning

  • Leading up to the results, Judo’s share price showed strength, reflecting investor confidence in its loan book growth and risk management.
  • The stock was trading closer to its 52-week high, indicating positive sentiment despite NIM pressures.
  • The company remains well-capitalized with strong liquidity, positioning it for further growth in the SME banking sector.

Disclaimer: This information is provided purely for educational purposes. It takes no account of an individual’s personal financial circumstances and hence can in no way constitute financial advice. The above data may be subject to errors or inconsistencies for which the author takes no liability. It is imperative that all investors do their own research or if they need advice, seek it from a qualified financial adviser.

Quick Take: H1FY25 ASX:JDO

Quick Take: H1FY25 ASX:MND

Monadelphous – 2025 Half-Year Results Summary

Monadelphous Group Limited

Overall Tone

Monadelphous delivered a solid half-year result, marked by revenue growth and a significant increase in profitability. Strong demand in maintenance and engineering construction services, combined with a well-managed balance sheet and contract wins, positions the company well for continued expansion. The outlook remains positive, driven by a robust project pipeline across resources, energy, and renewables.

Financial Results

Financial Metric 1H 2025 Change vs 1H 2024
Revenue $1.051 billion +4.2%
Adjusted EBITDA $79.8 million +30.2%
Operating Cash Flow $93.1 million Strong cash flow conversion of 145%
Adjusted Earnings Before Tax (EBT) $61.7 million +37.9%
Normalised EPS 43.3 cents
Interim Dividend 33 cents (fully franked)

Outlook Commentary

The resources and energy sectors are expected to remain strong over the long term, supported by sustained global economic growth and decarbonisation efforts. Investment in renewables and energy transition projects is increasing, providing significant future opportunities for Monadelphous. Labour shortages continue to present a challenge, but the company is mitigating this through workforce development and retention initiatives.

Guidance Statements

Monadelphous anticipates high single-digit revenue growth for FY25, supported by a strong backlog of projects. Operating margins are expected to improve as the company focuses on efficiency and risk management. The balance sheet remains strong, providing flexibility for strategic acquisitions and expansions.

Results vs Market Expectations

Monadelphous’ results were in line with market guidance, with revenue growth and profitability exceeding some analysts’ expectations. The strong EBITDA performance, driven by operational improvements and non-operating gains, was a key highlight. Investors reacted positively, particularly to the robust cash flow and dividend declaration.

Market Positioning

Leading up to the results announcement, Monadelphous’ share price showed resilience, reflecting positive sentiment. The stock has seen moderate gains in the past week but remains below its 52-week high. Investors are likely to focus on the company’s execution of its project pipeline and ability to sustain margins amid labour and supply chain constraints.


Disclaimer: This information is provided purely for educational purposes. It takes no account of an individual’s personal financial circumstances and hence can in no way constitute financial advice. The above data may be subject to errors or inconsistencies for which the author takes no liability. It is imperative that all investors do their own research or if they need advice, seek it from a qualified financial adviser.

Quick Take: H1FY25 ASX:MND

Quick Take: H1FY25 ASX:CVL

Civmec Limited – 2024 Half-Year Results Summary

Civmec Limited

Overall Tone

Civmec reported steady revenue growth, but profitability declined due to lower gross margins and increased administrative expenses. The company’s order book remains strong, supported by ongoing projects in the infrastructure, resources, and defence sectors. Liquidity remains robust, despite a notable drop in cash reserves.

Financial Results (per share where applicable)

Metric HY 2024 HY 2023 % Change
Revenue from ordinary activities ($m) 502.9 492.3 +2.1%
Gross Profit ($m) 55.8 60.3 -7.5%
Gross Profit Margin (%) 11.1% 12.2% -1.1pp
Statutory Profit Before Tax ($m) 37.5 45.1 -16.9%
Statutory Profit After Tax ($m) 26.5 31.9 -16.9%
Net Operating Cash Flow ($m) -22.7 99.4 N/A
Basic EPS (cents per share) 5.21 6.29 -17.2%
Interim Dividend (cents per share, franked at 100%) 2.5 2.5 Unchanged

Strategic Initiatives

Civmec continues to expand its presence in the defence sector with progress on the Luerssen Australia acquisition. The company is also focusing on improving efficiency in its shipbuilding and infrastructure divisions. Investments in automation and digital transformation aim to enhance long-term operational resilience.

Outlook Commentary

Civmec expects continued revenue growth driven by strong demand in the resources and infrastructure sectors. The company remains focused on project execution and cost management to mitigate margin pressures. Defence-related projects are expected to be a key driver of future earnings.

Guidance Statements

Management anticipates stable revenue with a focus on operational efficiencies to restore profit margins. Cash flow management remains a priority, and further investment in key growth areas such as shipbuilding and automation is planned. The company is optimistic about securing additional contracts in the coming quarters.

Results vs. Market Expectations

Revenue growth was in line with expectations, but profitability declined more than anticipated due to lower gross margins. The decline in cash flow was notable and may raise concerns among investors. The market may react cautiously until profitability trends improve.

Market Positioning

Civmec’s share price has been relatively stable leading up to the results but remains below its 52-week high. Investor sentiment may be impacted by the decline in profit margins and cash reserves, though the company’s strong order book provides long-term confidence.


Disclaimer: This information is provided purely for educational purposes. It takes no account of an individual’s personal financial circumstances and hence can in no way constitute financial advice. The above data may be subject to errors or inconsistencies for which the author takes no liability. It is imperative that all investors do their own research or if they need advice, seek it from a qualified financial adviser.

Quick Take: H1FY25 ASX:CVL

Quick Take: FY2024 ASX:AVH

AVITA Medical – 2024 Full-Year Results Summary

Website: AVITA Medical

Overall Tone

AVITA Medical delivered strong revenue growth in FY24, reflecting increased adoption of RECELL® technology across multiple treatment areas. While the company reported a larger net loss, key strategic milestones, expanded market approvals, and a revised financial outlook remain positives. The company’s ability to sustain its momentum in regenerative medicine positions it well for future growth.

Financial Results Summary

Metric FY 2024 FY 2023 YoY Change
Revenue from Ordinary Activities ($M) $64.3M $50.1M +28%
Other Income ($M) $0.16M $9.91M -98%
Statutory Net Loss ($M) $(61.8)M $(35.4)M -75%
Total Comprehensive Loss ($M) $(61.9)M $(44.9)M -38%
Net Operating Cash Flow ($M) $(48.9)M $(38.0)M -28.7%
Net Tangible Asset Backing per Share ($) $(0.17) $1.82 N/A
Dividend N/A N/A No dividend declared

Positive Surprises & Potential Concerns

  • Positive: Robust revenue growth (+28%), driven by broader clinical adoption and expanded market penetration.
  • Positive: Regulatory advancements, particularly in full-thickness skin defects and vitiligo indications.
  • Positive: Strengthened financial position, securing amendments to its credit agreement that provide more flexibility for future growth.
  • Concern: Net loss widened, primarily due to higher R&D and commercialization expenses as AVITA scales operations.
  • Concern: Liquidity and cash burn remain areas to watch, though the company asserts it has sufficient funding for the next 12 months.

Outlook Commentary

  • Continued revenue growth expected, fueled by broader U.S. and international adoption of RECELL®.
  • Regulatory progress in new indications (vitiligo, trauma, chronic wounds) expected to unlock additional revenue streams.
  • Operational efficiencies and pricing strategies to improve gross margins over time.

Guidance Statements

  • Revenue: Expected to exceed $73M in Q1 2025, with sequential growth through the year.
  • Cash Management: Continued focus on reducing burn rate, optimizing costs, and securing non-dilutive funding opportunities.
  • Market Expansion: Further penetration in Asia-Pacific and European markets, leveraging new regulatory approvals.

Result vs. Market Expectations

  • Revenue growth met expectations, but the net loss widened significantly, which may disappoint investors.
  • The company’s expansion strategy and increasing market penetration are positive long-term factors, but short-term financial performance remains under scrutiny.

Market Positioning

  • AVITA’s share price has seen volatility leading into the results, reflecting both optimism about revenue growth and concerns over rising losses.
  • The stock remains well below its 52-week high, signalling cautious investor sentiment amid ongoing operational challenges.

Disclaimer: This information is provided purely for educational purposes. It takes no account of an individual’s personal financial circumstances and hence can in no way constitute financial advice. The above data may be subject to errors or inconsistencies for which the author takes no liability. It is imperative that all investors do their own research or if they need advice, seek it from a qualified financial adviser.

Quick Take: FY2024 ASX:AVH

Quick Take: H1FY25 ASX:LGI

LGI – 2025 Half-Year Results Summary

LGI Limited

Overall Tone

LGI delivered solid revenue growth and stable EBITDA, but profitability was impacted by increased borrowing costs. The company continued to expand its biogas capture and renewable energy generation capabilities, reinforcing its market position in carbon abatement and clean energy solutions.

Financial Results (per share where applicable)

Metric HY 2025 HY 2024 % Change
Revenue from ordinary activities ($m) 16.91 15.85 +6.7%
Statutory EBITDA ($m) 7.26 7.05 +3.0%
Statutory Profit Before Tax ($m) 3.22 4.14 -22.2%
Statutory Profit After Tax ($m) 2.40 3.10 -22.0%
Net Operating Cash Flow ($m) 6.26 7.61 -17.7%
Normalised EPS (cents per share) 2.7 3.5 -22.9%
Interim Dividend (cents per share, franked at 25%) 1.2 1.2 Unchanged

Outlook Commentary

LGI remains focused on increasing its biogas capture and renewable energy generation. Expansion efforts, including the Canberra and Eastern Creek power stations, are expected to drive future revenue growth. However, higher financing costs and infrastructure investment may weigh on short-term profitability.

Guidance Statements

LGI anticipates continued growth in biogas capture and carbon credit generation, with an emphasis on infrastructure expansion. While profitability pressures exist, the long-term strategy of enhancing landfill gas recovery and renewable power production remains intact. The company aims to improve cash flow conversion and maintain dividend consistency.

Results vs. Market Expectations

Revenue growth met expectations, but the decline in profit due to higher interest expenses may have disappointed investors. The stability in EBITDA suggests operational resilience, yet market sentiment may be affected by weaker net income figures.

Market Positioning

LGI’s share price has remained relatively stable, trading within a range leading into the results announcement. The stock is positioned moderately below its 52-week high, reflecting both investor confidence in its growth strategy and concerns over profitability headwinds.


Disclaimer: This information is provided purely for educational purposes. It takes no account of an individual’s personal financial circumstances and hence can in no way constitute financial advice. The above data may be subject to errors or inconsistencies for which the author takes no liability. It is imperative that all investors do their own research or if they need advice, seek it from a qualified financial adviser.

Quick Take: H1FY25 ASX:LGI

Quick Take: FY2024 ASX:AMP

AMP – 2024 Full-Year Results Summary

AMP Limited

Overall Tone

AMP reported mixed results for the full year 2024, showing revenue growth but a significant decline in statutory profit. While cost management and capital returns were strong, the company faced challenges in maintaining profitability, particularly in its banking operations.

Financial Results (per share where applicable)

Metric FY 2024 FY 2023 % Change
Revenue from ordinary activities ($m) 2,869 2,732 +5%
Underlying NPAT ($m) 236 205 +15.1%
Statutory NPAT ($m) 150 265 -43%
Adjusted EBITDA ($m) Not explicitly reported
Operating Cash Flows ($m) Not explicitly reported
Adjusted Earnings Before Tax (EBT) ($m) Not explicitly reported
Normalised EPS (cents per share) 9.0 7.2 +25%
Final Dividend (cents per share, franked at 20%) 1.0 2.0 -50%

Outlook Commentary

AMP is positioning itself as a retirement specialist, with strong growth in its wealth management and superannuation businesses. The company remains focused on cost discipline, enhancing its North platform, and leveraging AI and digital banking to drive future growth. The economic environment remains challenging, particularly in the banking sector.

Guidance Statements

AMP expects continued positive momentum in its wealth businesses, with an emphasis on managed portfolios and retirement solutions. Cost control remains a priority, and further investment in digital banking is anticipated to support future revenue growth. The company has completed its capital management program, returning $1.1 billion to shareholders since 2022.

Results vs. Market Expectations

While revenue and underlying profit met expectations, the sharp decline in statutory NPAT and dividend cut may have disappointed some investors. The company’s focus on retirement solutions and digital banking is seen as a long-term growth driver, but the challenging banking environment remains a concern.

Market Positioning

AMP’s share price leading into the results was volatile, ranging from $0.93 to $1.66 during the year. The stock is trading near its 52-week high, reflecting investor confidence in its ongoing transformation and strategic initiatives.


Disclaimer: This information is provided purely for educational purposes. It takes no account of an individual’s personal financial circumstances and hence can in no way constitute financial advice. The above data may be subject to errors or inconsistencies for which the author takes no liability. It is imperative that all investors do their own research or if they need advice, seek it from a qualified financial adviser.

Quick Take: FY2024 ASX:AMP

Quick Take: FY2024 ASX:GQG

GQG Partners – 2024 Preliminary Final Report Summary

GQG Partners

Overall Tone

GQG Partners delivered a strong financial performance for 2024, reporting substantial growth in revenue, net income, and funds under management (FUM). The company remains focused on delivering long-term investment outperformance while strategically expanding its global footprint and private capital solutions business.


Financial Results (Per Share Where Applicable)

Metric 2024 2023 % Change
Revenue $760.4M $517.6M +46.9%
Adjusted EBITDA $577.9M $384.4M +50.4%
Operating Cash Flow Not explicitly stated, but strong growth indicated
Adjusted Earnings Before Tax (EBT) $586.9M $386.9M +51.7%
Normalised EPS $0.15 $0.10 +52.3%

Outlook Commentary

GQG remains optimistic about 2025, citing strong net inflows, ongoing investment in talent and geographic expansion, and continued demand for active investment management. The firm expects further growth in its wholesale and sub-advisory channels, particularly in Australia, Canada, and the Middle East.

Guidance Statements

  • Management remains committed to organic and inorganic growth, leveraging strong investment performance and global distribution capabilities.
  • The company anticipates sustained FUM growth, supported by both market performance and net inflows.
  • The newly established Private Capital Solutions (PCS) business is expected to contribute to long-term diversification, though its near-term impact on financial results will be limited.

Results vs Market Expectations

The 52.8% increase in net income and strong FUM growth exceeded market expectations, reinforcing GQG’s reputation as a high-growth investment boutique. The firm’s ability to generate $20.2 billion in net inflows—nearly double the previous year’s $10.2 billion—was a standout achievement in a competitive asset management industry.

Market Positioning

  • Share Price Performance: Prior to the earnings report, GQG’s share price showed positive momentum, reflecting investor confidence.
  • Recent Trends: Given the strong earnings and inflows, GQG is well-positioned to attract further interest from both institutional and retail investors.

Disclaimer: This information is provided purely for educational purposes. It takes no account of an individual’s personal financial circumstances and hence can in no way constitute financial advice. The above data may be subject to errors or inconsistencies for which the author takes no liability. It is imperative that all investors do their own research or, if they need advice, seek it from a qualified financial adviser.

Quick Take: FY2024 ASX:GQG

Quick Take: 1HFY25 ASX:IMD

IMDEX Limited – 1H25 Interim Results Summary

Website: www.imdexlimited.com

Overall Tone

IMDEX reported a strong rebound in net profit for 1H25 despite a 10% decline in revenue. Profitability surged, driven by lower costs, improved operational efficiencies, and a one-off litigation income. The company continues to maintain a solid balance sheet with positive operating cash flow, but revenue softness may be a concern for investors.


Financial Highlights

Metric 1H25 1H24 % Change
Revenue $211.99M $235.32M -10%
Net Profit After Tax (NPAT) $30.98M $16.80M +84%
Basic EPS (cents) 6.05c 3.31c +83%
Interim Dividend 1.5c 1.5c No Change
Net Tangible Assets per Share 36.8c 26.09c +41%

Outlook Commentary

IMDEX remains focused on cost efficiencies and operational improvements to counterbalance revenue pressures. The company continues to invest in new technologies, particularly in its digital and software segments, to drive long-term growth. The integration of recent acquisitions, including Globaltech, is expected to further strengthen IMDEX’s intellectual property and market positioning.


Guidance Statements

While no formal earnings guidance was provided, IMDEX has emphasized its commitment to maintaining profitability and cash flow strength. The company expects demand for its drilling and mining technology solutions to remain steady, although revenue headwinds could persist in the near term.


Result vs Market Expectations

The market will likely view the sharp profit increase positively, particularly given the impact of cost reductions and operational efficiencies. However, the revenue decline may raise questions about underlying demand trends. Investors will likely focus on management’s commentary regarding future sales momentum.


Market Positioning

  • Share price performance pre-results: IMDEX shares have shown resilience, with some volatility in recent weeks.
  • 52-week high comparison: The stock remains below its 52-week high, reflecting cautious sentiment despite strong profit growth.

Meta Description:

Imdex ASX:IMD - 12 month daily chart with volume and three exponential moving averages to help quickly determine the trend.


Disclaimer:
This information is provided purely for educational purposes. It takes no account of an individual’s personal financial circumstances and hence can in no way constitute financial advice. The above data may be subject to errors or inconsistencies for which the author takes no liability. It is imperative that all investors do their own research or, if they need advice, seek it from a qualified financial adviser.

Quick Take: 1HFY25 ASX:IMD

Quick Take: 1H25Update ASX:NXL

Nuix – 1H25 Results Update

www.nuix.com/investors

Overall Tone

Nuix delivered moderate revenue and ACV growth in 1H25 but faced a decline in statutory EBITDA. While cash flow remains strong and ACV is growing, challenges in contract procurement cycles and a decrease in capitalised R&D spending weighed on earnings. The company is maintaining its FY25 growth targets but acknowledges execution risks.


Financial Highlights

Metric 1H25 Range 1H24 % Change
Annualised Contract Value (ACV) $215M – $217M $199.6M +8% – 9%
Statutory Revenue $104M – $106M $98.4M +6% – 8%
Cash EBITDA $11M – $13M $10.3M +7% – 26%
Underlying EBITDA $26M – $28M $28.4M (1%) – (8%)
Statutory EBITDA $14M – $16M $17.2M (7%) – (19%)
Cash on Hand $30M – $31M $24.0M +25% – 29%

Outlook Commentary

Nuix is targeting approximately 15% ACV growth in constant currency for FY25, but current trends suggest full-year ACV growth will likely be in the range of 11% to 16%. The company is experiencing longer procurement cycles due to larger, more complex contracts and a transition to platform-based sales.


Guidance Statements

Nuix remains on track to meet its FY25 target for revenue growth exceeding operating cost growth (excluding legal expenses). The company continues to fund software development from free cash flow and expects to be cash flow positive for the full year.


Result vs Market Expectations

The update is largely in line with expectations, with ACV growth being a positive sign. However, the decline in statutory EBITDA and the continued impact of legal expenses may raise concerns among investors. The market will likely focus on whether Nuix can execute its growth targets in the second half.


Market Positioning

  • Share price performance pre-results: Nuix has experienced some volatility leading up to the results.
  • 52-week high comparison: The stock remains below its peak, with investor sentiment influenced by legal costs and execution risks.

Nuix ASX:NXL - 12 month daily chart with volume and three exponential moving averages to help quickly determine the trend.


Disclaimer:
This information is provided purely for educational purposes. It takes no account of an individual’s personal financial circumstances and hence can in no way constitute financial advice. The above data may be subject to errors or inconsistencies for which the author takes no liability. It is imperative that all investors do their own research or, if they need advice, seek it from a qualified financial adviser.

Quick Take: 1H25Update ASX:NXL

Quick Take: 1HFY25 ASX:BVS

Bravura Solutions – 2025 Interim Results Summary

www.bravurasolutions.com

Overall Tone

Bravura Solutions delivered a significantly improved financial performance in 1H25, rebounding strongly from the prior period’s losses. The company benefited from a one-off licence sale to Fidelity International, significantly boosting profitability. Underlying performance also improved, with EBITDA and cash flow showing strong growth despite some regional revenue softness.


Financial Results Summary

Metric 1H25 1H24 % Change
Revenue $183.8M $127.0M +44.7%
Revenue (excluding licence sale) $127.5M $127.0M +0.4%
Adjusted EBITDA $23.8M $7.9M +201%
Operating Cash Flow $67.1M $18.8M +257%
Adjusted Earnings Before Tax (EBT) $18.0M -$1.7M N/A
Normalised EPS 2.5c -0.4c N/A

Outlook Commentary

Bravura Solutions remains focused on its strategic growth initiatives, particularly in expanding its software offerings and improving operational efficiencies. The company continues to invest in its Alta and Advice OS platforms, aiming to enhance product functionality and expand its total addressable market.


Guidance Statements

The company has not provided formal earnings guidance but expects continued profitability and cash flow strength. It remains committed to prudent capital allocation, with a focus on maintaining a strong balance sheet and shareholder returns.


Result vs Market Expectations

The strong results, particularly the one-off licence sale impact, exceeded market expectations. The significant profitability rebound has likely reassured investors, although the market will be keen to assess sustainable earnings growth excluding non-recurring items.


Market Positioning

  • Share price performance pre-results: The stock had seen moderate gains in the prior week.
  • 52-week high comparison: The share price remains below its 52-week high, suggesting there is room for further upside if the company maintains its momentum.

Bravura Solutions ASX:BVS - 12 month daily chart with volume and three exponential moving averages to help quickly determine the trend.


Disclaimer:
This information is provided purely for educational purposes. It takes no account of an individual’s personal financial circumstances and hence can in no way constitute financial advice. The above data may be subject to errors or inconsistencies for which the author takes no liability. It is imperative that all investors do their own research or, if they need advice, seek it from a qualified financial adviser.

Quick Take: 1HFY25 ASX:BVS