C79 Technical Analysis
Last updated: September 10, 2025 at 11:48 PM
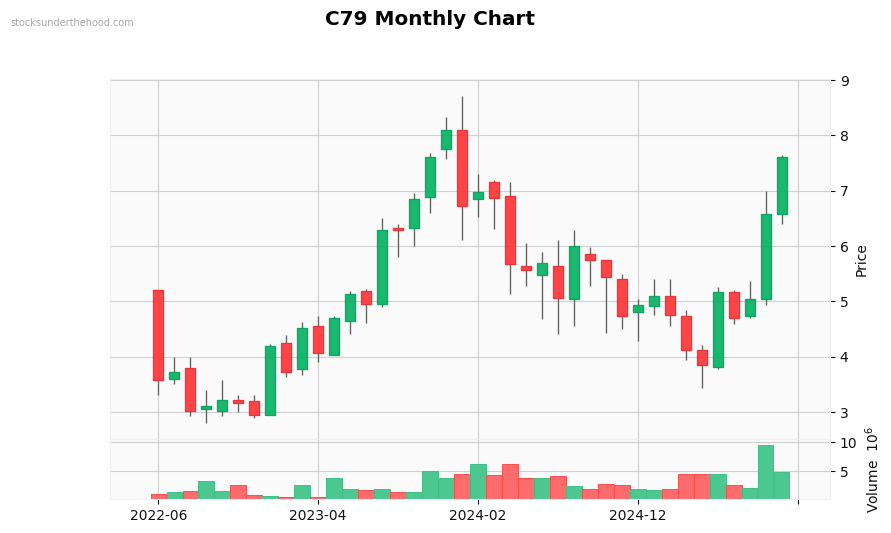
Monthly Observations: Performance: +112.6% (10Y). Volume is significantly above average. with strong buying interest. Recent volume spike detected. Currently in a strong uptrend. Solid long-term gains (+21.0% over 2 years). Moderate volatility. Down 12.7% from highs. Strong 6-month momentum. Price is near recent highs.
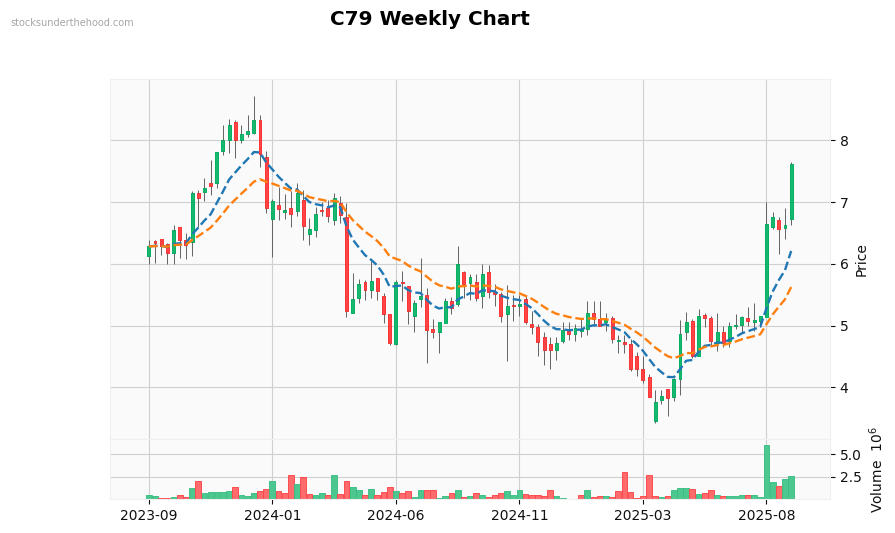
Weekly Observations: Performance: +21.2% (2Y). Volume is significantly above average. with strong buying interest. Recent volume spike detected. Currently in a strong uptrend. Trading above EMA10. Trading above EMA21. Price is above all EMAs (bullish signal). EMAs are stacked bullishly. Price is at recent highs.
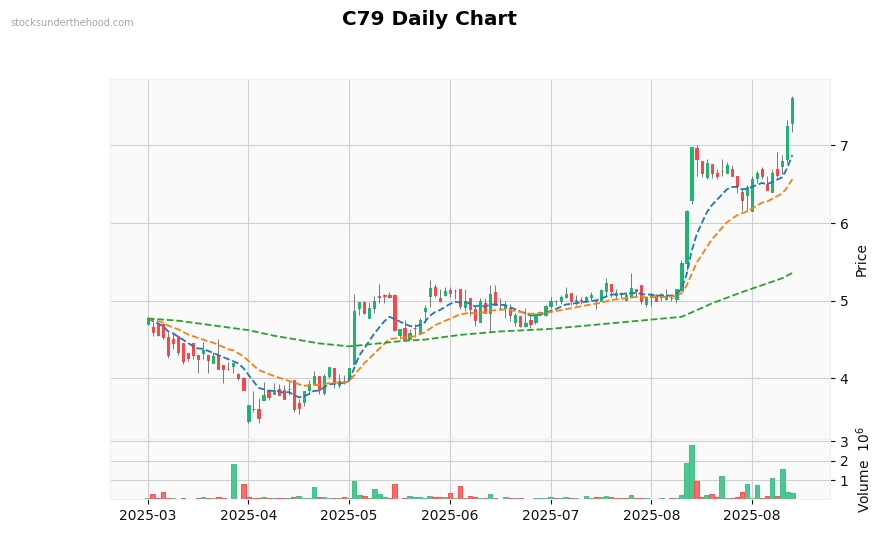
Daily Observations: Performance: +59.5% (6M). Volume is significantly above average. with strong buying interest. Recent volume spike detected. Currently in a strong uptrend. Trading above EMA10. Trading above EMA21. Trading above EMA125. Price is above all EMAs (bullish signal). EMAs are stacked bullishly. Price is at recent highs.