Introduction
Temple and Webster (ASX:TPW) and Cettire (ASX:CTT) have been the two leading retail stocks on the ASX for the past couple of years. I thought it would be interesting to do a side-by-side comparison to see what we can learn and see if one looks better than the other.
Firstly this is how each company describes themselves:
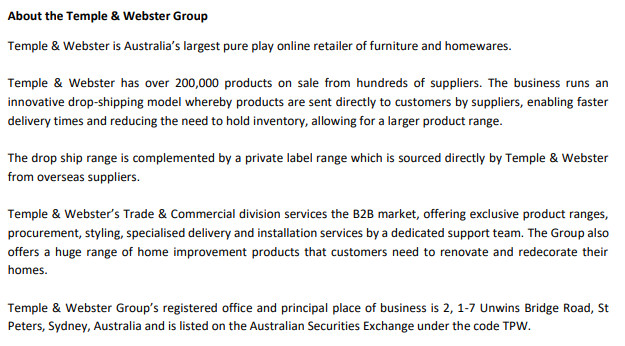
https://www.templeandwebster.com.au/
https://www.cettire.com/au
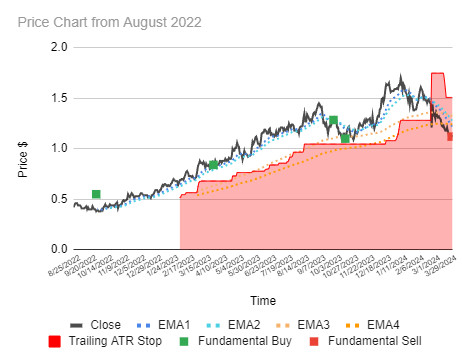
Share price performance
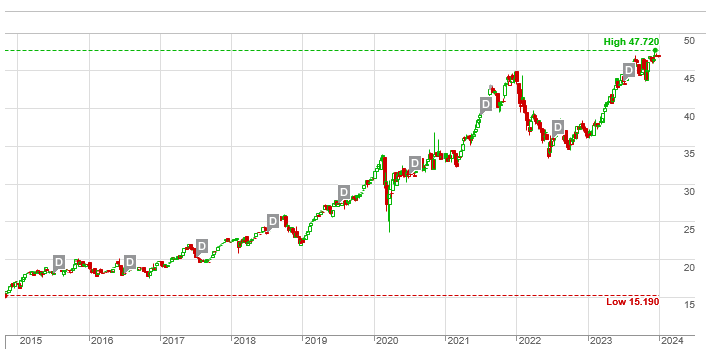
Let’s look at their charts. Both seemed to peak in around October 2022 and now both seem to be returning to test those peaks.
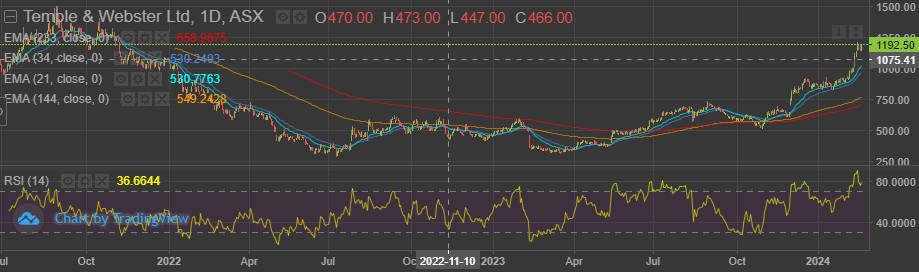
Incredibly similar.
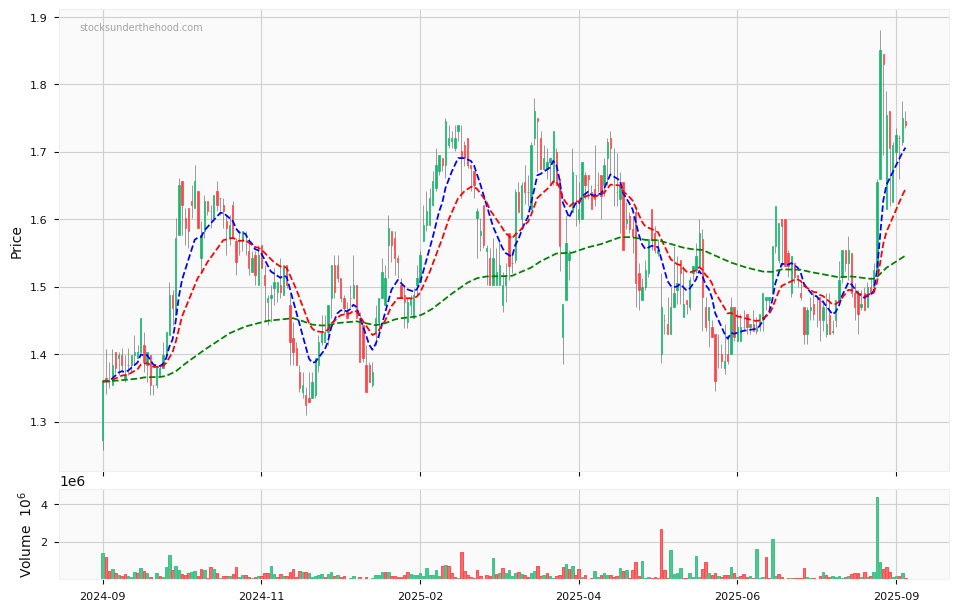
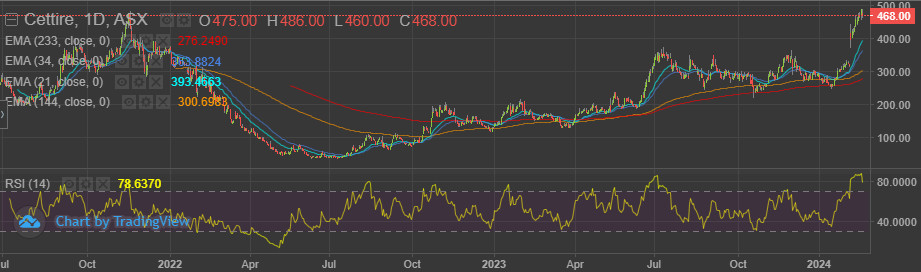
Next let’s look the performance of both over the last 12 months.(Temple and Webster (ASX:TPW) first, Cettire (ASX:CTT) 2nd)![]()
![]()
Again quite similar.
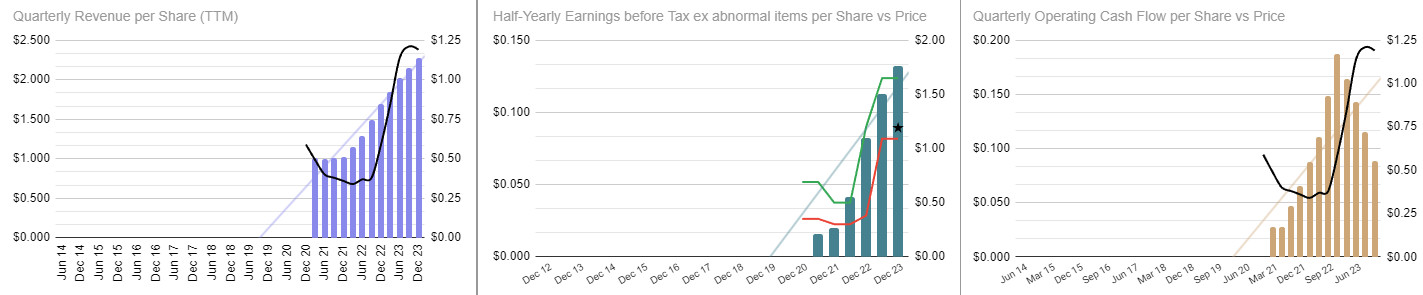
Fundamentals
Let’s look at some other metrics:
| Metric | ASX:TPW | ASX:CTT |
|---|---|---|
| Market Cap | $1.4B | $1.8B |
| Latest Revenue per share on a trailing 12 month basis | $3.63 | $1.53 |
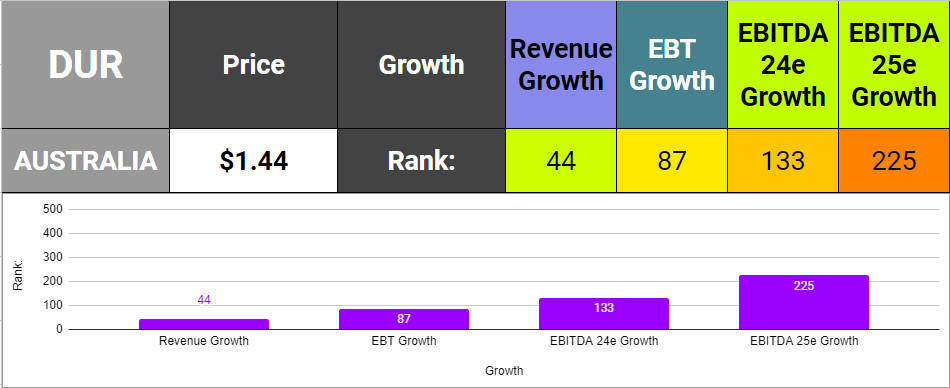
| Latest Revenue per share on a trailing 12 month basis growth | 10% | 40% |
| Operating cash flow per share on a trailing 12 month basis | 33.1c | 17c |
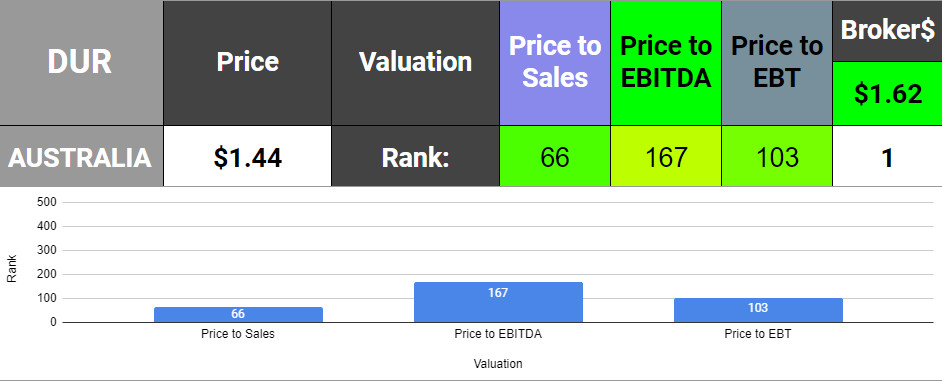
| Price to sales ratio | 3.4 | 3.0 |
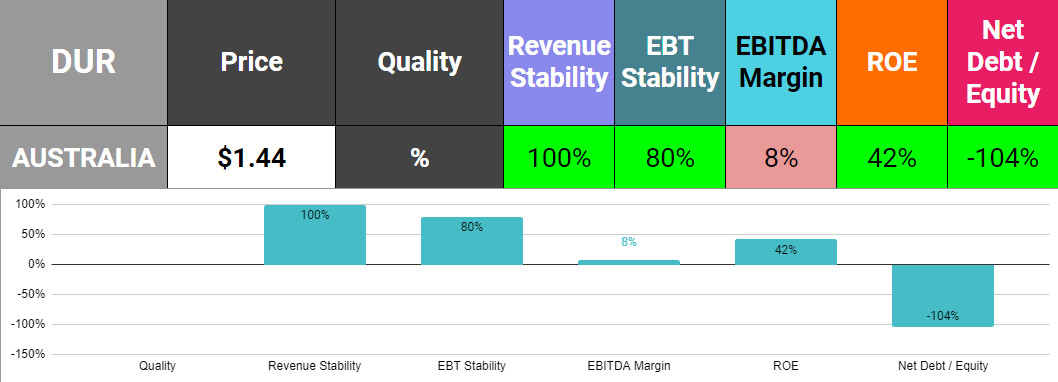
| EBTIDA Margins | 3.7% | 7.0% |
| Forecast EBTIDA Growth in 2024 | -23% | 51% |
| Cash / Debt | $114.2m / $0 | $99.8M / $0 |
Final thoughts: Temple and Webster (ASX:TPW) vs Cettire (ASX:CTT)
It’s remarkable how similar these two companies are. I think it’s safe to say though, on these metrics, if you like Temple and Webster (ASX:TPW) then you should love Cettire (ASX:CTT). Cettire (ASX:CTT) has a slightly lower valuation and is growing faster and forecast to continue doing so.
Disclaimer: This information is provided purely for educational purposes. It takes no account of an individual’s personal financial circumstances and hence can in no way constitute financial advice. The above data may be subject to errors or inconsistencies for which the author takes no liability. It is imperative that all investors do their own research or if they need advice, seek it from a qualified financial adviser.