This content is restricted to Supporters. Please Sign In.
Not a member? Follow the for a Free 14 Day Trial (no credit card required).
This content is restricted to Supporters. Please Sign In.
Not a member? Follow the for a Free 14 Day Trial (no credit card required).
This content is restricted to Supporters. Please Sign In.
Not a member? Follow the for a Free 14 Day Trial (no credit card required).
This content is restricted to Supporters. Please Sign In.
Not a member? Follow the for a Free 14 Day Trial (no credit card required).
This content is restricted to Supporters. Please Sign In.
Not a member? Follow the for a Free 14 Day Trial (no credit card required).
This content is restricted to Supporters. Please Sign In.
Not a member? Follow the for a Free 14 Day Trial (no credit card required).
This content is restricted to Supporters. Please Sign In.
Not a member? Follow the for a Free 14 Day Trial (no credit card required).
This content is restricted to Supporters. Please Sign In.
Not a member? Follow the for a Free 14 Day Trial (no credit card required).
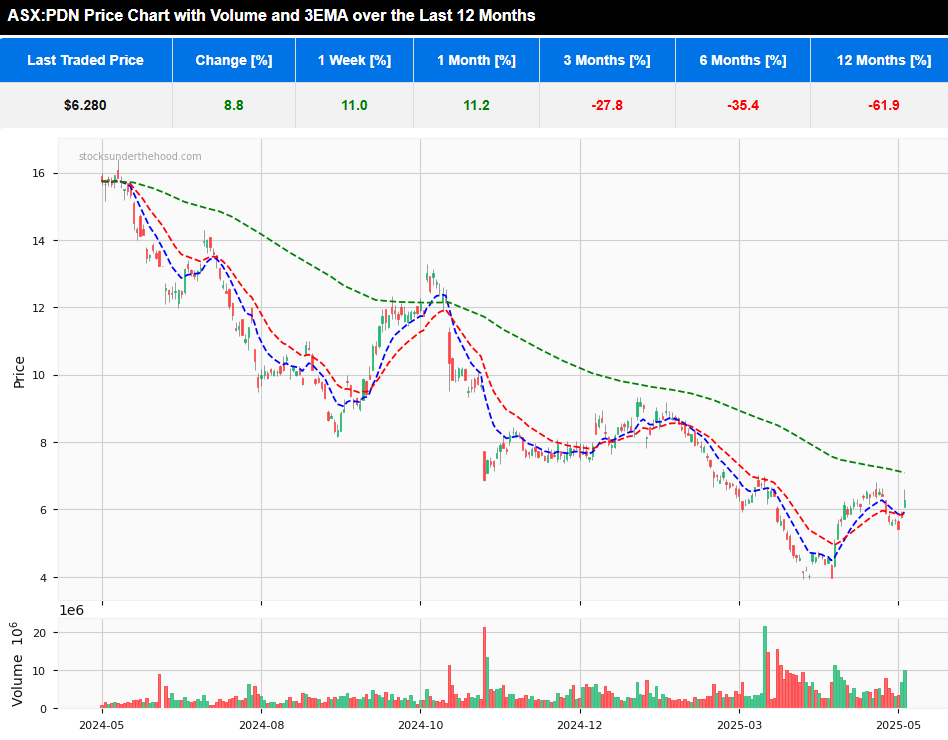
Forensic Analysis: Paladin Energy Ltd ASX:PDN
🗓️ May, 2025
🌐 Website: https://www.paladinenergy.com.au
Here is a forensic financial analysis of Paladin Energy Ltd (ASX:PDN), based on its FY2024 Annual Report and 1H FY2025 Interim Report.
| Risk Indicator | Status | Comments |
|---|---|---|
| Goodwill >25% of Assets | ✅ | No goodwill reported; intangibles are minor and mainly software-related. |
| Rising Receivables Days | ✅ | Receivables are modest (US$13.5M) vs revenue; no unusual rise observed. |
| Inventory Growth vs Profit | 🟠 | Inventory rose to US$131.4M with restart phase and production ramp-up. |
| High Borrowings | 🔴 | US$198.8M in borrowings including shareholder loans; increased leverage. |
| Loans to Related Parties | ✅ | No related party loans disclosed. |
| Idle Cash | ✅ | Cash reserves (US$165.8M) are being actively deployed; not idle. |
| Risk Indicator | Status | Comments |
|---|---|---|
| Revenue vs Profit Divergence | 🟠 | FY25 H1 revenue grew to US$77.3M but net loss was US$4.6M; margin pressure. |
| Capitalised R&D/Interest | ✅ | No aggressive capitalisation observed; exploration expensed appropriately. |
| Extraordinary Items | 🟠 | US$92M reversal of ore stockpile impairment in FY24 significantly boosted results. |
| Tax Rate Drop | ✅ | No material benefit; no tax payable due to carried-forward losses. |
| Profit vs Cash Flow | ✅ | Operating cash flow turned positive in H1 FY25; aligns with ramp-up progress. |
| One-Off Gains Boosting Profit | 🟠 | FY24 profit driven by one-off reversal; not recurring. |
| Risk Indicator | Status | Comments |
|---|---|---|
| Auditor Changes | ✅ | No changes; PwC remains auditor. |
| Audit Qualifications | ✅ | Clean opinion; no qualifications. |
| Exec Departures | ✅ | Stable executive team through ramp-up and M&A. |
| Transparency Issues | ✅ | Strong disclosure of risks, Fission deal, LHM restart, and ESG. |
| Board Weakness | ✅ | Independent, diverse board; mix of mining and governance skills. |
| Executive Pay Misalignment | ✅ | Incentives linked to milestones including LHM restart and shareholder returns. |
| Promotional Language | 🟠 | Highly bullish tone; some caution warranted given early-stage ramp-up phase. |
| Risk Indicator | Status | Comments |
|---|---|---|
| Chronic Unprofitability | 🟠 | History of losses; FY24 profit was one-off driven. Losses returned in H1 FY25. |
| Revenue < Capex | 🟠 | High capex (US$96.6M FY24) relative to early revenue. Improving post ramp. |
| Funding Dependency | 🔴 | US$70M debt and shareholder loans suggest external capital reliance. |
| Customer Concentration | ✅ | Diverse contract book across US, EU, and Asia; well structured. |
| Pre-commercial Product Risk | ✅ | LHM is operational; no early-stage tech dependence. |
| Short Cash Runway | ✅ | Cash + investments US$165.8M; runway adequate despite negative earnings. |
| Regulatory/Compliance Exposure | ✅ | High compliance standards, no major issues reported. |
| Leadership Turnover During Expansion | ✅ | CEO and team stable during critical transition. |
| Category | 🔴 Red Flags | 🟠 Amber Flags |
|---|---|---|
| Balance Sheet | 1 | 1 |
| Income Statement | 0 | 3 |
| Governance / Disclosure | 0 | 1 |
| Strategic Risk Factors | 1 | 2 |
🔴 Total Red Flags: 2
🟠 Total Amber Flags: 7
Disclaimer: This report is for educational purposes and does not constitute financial advice. It does not account for personal circumstances. All investors should conduct their own research or consult a qualified adviser before making financial decisions.
Forensic Analysis: Paladin Energy ASX:PDN
This content is restricted to Supporters. Please Sign In.
Not a member? Follow the for a Free 14 Day Trial (no credit card required).
This content is restricted to Supporters. Please Sign In.
Not a member? Follow the for a Free 14 Day Trial (no credit card required).
This content is restricted to Supporters. Please Sign In.
Not a member? Follow the for a Free 14 Day Trial (no credit card required).
This content is restricted to Supporters. Please Sign In.
Not a member? Follow the for a Free 14 Day Trial (no credit card required).
This content is restricted to Supporters. Please Sign In.
Not a member? Follow the for a Free 14 Day Trial (no credit card required).
📅 May 2025
🌐 Website: www.catapultsports.com
Here is the forensic financial analysis of Catapult Group International Ltd (ASX:CAT) for FY2025.
📊 Balance Sheet
| Risk Indicator | Status | Comments |
|---|---|---|
| Goodwill >25% of Assets | 🔴 Red Flag | Goodwill is $51.26m, or ~31% of total assets ($165.89m); exceeds the 25% risk threshold. |
| Rising Receivables Days | ✅ No Flag | Receivables days improved from 44.1 (FY24) to 38.4 (FY25); well below 90-day threshold. |
| Inventory Growth vs Profit | 🟠 Amber Flag | Inventory rose 122% YoY, while net losses declined but not proportionately. |
| High Borrowings | ✅ No Flag | Debt-to-equity ratio is only 0.043; borrowings reduced significantly from prior year. |
| Loans to Related Parties | ✅ No Flag | No related party loans or advances disclosed. |
| Idle Cash | ✅ No Flag | Cash balance ($10.76m) stable and appears actively managed with debt repayments. |
📈 Income Statement
| Risk Indicator | Status | Comments |
|---|---|---|
| Revenue vs Profit Divergence | ✅ No Flag | Revenue grew 16.5% while net loss improved 47%; no divergence. |
| Capitalised R&D/Interest | 🟠 Amber Flag | R&D capitalisation disclosed; justified for SaaS model but warrants ongoing scrutiny. |
| Extraordinary Items | ✅ No Flag | No recurring or significant one-off items noted. |
| Tax Rate Drop | ✅ No Flag | Shift to tax benefit driven by deferred tax and share-based adjustments. |
| Profit vs Cash Flow | ✅ No Flag | Strong operating cash flow ($38.45m) vs. net loss ($8.81m); positive sign. |
| One-Off Gains Boosting Profit | ✅ No Flag | No material asset sales or revaluations influencing earnings. |
🏛️ Governance, Disclosure & Audit
| Risk Indicator | Status | Comments |
|---|---|---|
| Auditor Changes | ✅ No Flag | Ernst & Young remains the auditor; no changes noted. |
| Audit Qualifications | ✅ No Flag | Clean, unqualified audit opinion provided. |
| Exec Departures | ✅ No Flag | No unexpected CEO/CFO resignations. |
| Transparency Issues | ✅ No Flag | Disclosures consistent, with strong detail across all areas. |
| Board Weakness | ✅ No Flag | Board includes experienced professionals with diverse backgrounds. |
| Executive Pay Misalignment | 🔴 Red Flag | Exec comp up 19% despite ongoing losses; indicates misalignment with shareholder value. |
| Promotional Language | ✅ No Flag | Management tone balanced and aligned with performance metrics. |
✅ Final Summary
| Category | 🔴 Red Flags | 🟠 Amber Flags |
|---|---|---|
| Balance Sheet | 1 | 1 |
| Income Statement | 0 | 1 |
| Governance / Disclosure | 1 | 0 |
🔴 Total Red Flags: 2
🟠 Total Amber Flags: 2
🟠 Amber & 🔴 Red Flag Overview
Goodwill Load: At ~31% of assets, goodwill is elevated and may require future impairment scrutiny.
Inventory vs Profit: Inventory rose disproportionately to net profit gains, posing a risk if demand falters.
Capitalisation Practices: While standard for SaaS firms, R&D capitalization should be reviewed for consistency.
Executive Compensation: Compensation increases outpaced financial improvements, raising alignment concerns.
Disclaimer: This information is provided purely for educational purposes. It takes no account of an individual’s personal financial circumstances and hence can in no way constitute financial advice. The above data may be subject to errors or inconsistencies for which the author takes no liability. It is imperative that all investors do their own research or if they need advice, seek it from a qualified financial adviser.
Forensic Analysis: Catapult FY25
This content is restricted to Supporters. Please Sign In.
Not a member? Follow the for a Free 14 Day Trial (no credit card required).
This content is restricted to Supporters. Please Sign In.
Not a member? Follow the for a Free 14 Day Trial (no credit card required).
This content is restricted to Supporters. Please Sign In.
Not a member? Follow the for a Free 14 Day Trial (no credit card required).
This content is restricted to Supporters. Please Sign In.
Not a member? Follow the for a Free 14 Day Trial (no credit card required).
This content is restricted to Supporters. Please Sign In.
Not a member? Follow the for a Free 14 Day Trial (no credit card required).
This content is restricted to Supporters. Please Sign In.
Not a member? Follow the for a Free 14 Day Trial (no credit card required).