This content is restricted to Supporters. Please Sign In.
Not a member? Follow the for a Free 14 Day Trial (no credit card required).
This content is restricted to Supporters. Please Sign In.
Not a member? Follow the for a Free 14 Day Trial (no credit card required).
This content is restricted to Supporters. Please Sign In.
Not a member? Follow the for a Free 14 Day Trial (no credit card required).
This content is restricted to Supporters. Please Sign In.
Not a member? Follow the for a Free 14 Day Trial (no credit card required).
📅 June, 2025
🌐 Website: https://www.nextdc.com
Here is a forensic financial analysis of NEXTDC Limited (ASX:NXT), based on its FY24 Annual Report, 1H25 Interim Report, and June 2025 Contracted Utilisation Update.
| Risk Indicator | Status | Comments |
|---|---|---|
| Goodwill >25% of Assets | ✅ | NEXTDC has minimal to no goodwill on its balance sheet; most assets are tangible infrastructure. |
| Rising Receivables Days | ✅ | Receivables are proportionate to revenue, no material stretch identified. |
| Inventory Growth vs Profit | Not Applicable | NEXTDC operates infrastructure-based services with immaterial inventory; capital is invested in property and equipment, not working capital. |
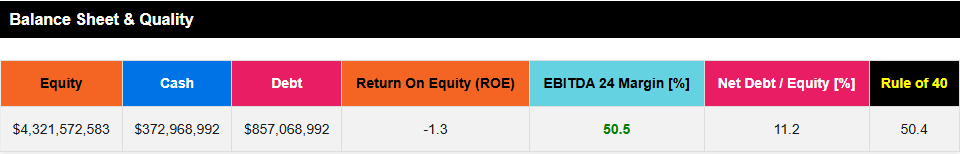
| High Borrowings | 🔴 | Debt facilities expanded to $2.9B in Dec 2024; leverage rising to fund major infrastructure rollout. |
| Loans to Related Parties | ✅ | No such loans identified in FY24 or 1H25 reports. |
| Idle Cash | 🟠 | ~$1.2B in cash as at June 2024; while allocated to growth, specific return metrics or deployment timelines are not fully detailed. |
| Risk Indicator | Status | Comments |
|---|---|---|
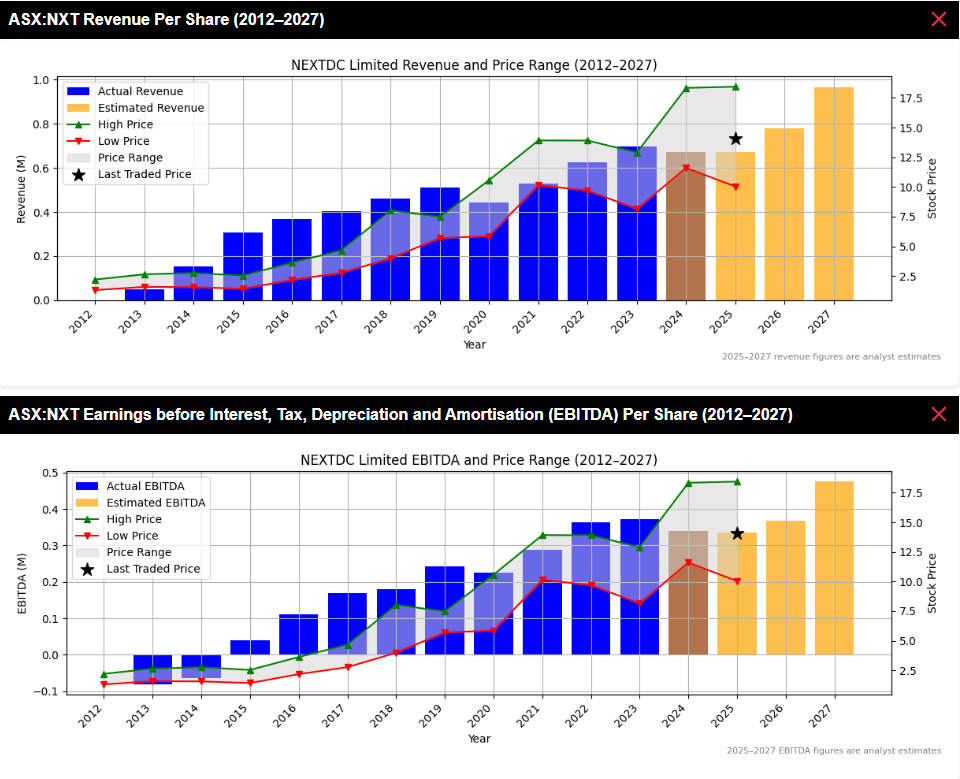
| Revenue vs Profit Divergence | 🔴 | Revenue declined 2% in 1H25 vs pcp, while net loss doubled to $42.7M. |
| Capitalised R&D/Interest | ✅ | Capitalised costs are infrastructure-related; no aggressive accounting detected. |
| Extraordinary Items | 🟠 | Debt refinance in 1H25 triggered $26.5M in write-offs; one-off but material. |
| Tax Rate Drop | ✅ | No unusual tax treatment; losses explain low tax. |
| Profit vs Cash Flow | ✅ | Operating cash flow aligned reasonably with net results considering depreciation-heavy model. |
| One-Off Gains Boosting Profit | ✅ | No evidence of non-operating gains inflating earnings. |
| Risk Indicator | Status | Comments |
|---|---|---|
| Auditor Changes | ✅ | No change or concern noted. |
| Audit Qualifications | ✅ | Clean audit opinions. |
| Exec Departures | ✅ | Executive team has remained stable through major expansion. |
| Transparency Issues | ✅ | Clear and detailed reporting; strong disclosure on ESG and strategy. |
| Board Weakness | ✅ | Board is independent and experienced. |
| Executive Pay Misalignment | ✅ | Incentives linked to long-term metrics; no red flags. |
| Promotional Language | 🟠 | Narrative around “AI revolution”, “industrial era”, and “sovereign infrastructure” leans promotional despite ongoing losses. |
| Risk Indicator | Status | Comments |
|---|---|---|
| Chronic Unprofitability | 🔴 | Multiple years of net losses, with 1H25 loss deepening due to financing structure. |
| Revenue < Capex | 🔴 | Capex consistently exceeds revenue; ~$1B spent in 1H25 alone. |
| Funding Dependency | 🔴 | $1.3B equity raised in FY24; further reliance on $2.9B debt deal confirms dependency. |
| Customer Concentration | ✅ | Broad customer base; no undue concentration. |
| Pre-commercial Product Risk | ✅ | Core platform is operational; KL1 is in development but part of a broader commercialised network. |
| Short Cash Runway | ✅ | Over $2.5B in liquidity (cash + undrawn debt) as at Dec 2024. |
| Regulatory/Compliance Exposure | ✅ | Strong ESG, ISO and compliance footprint. No active breaches noted. |
| Leadership Turnover During Expansion | ✅ | CEO and board consistent through multi-region rollout. |
| Category | 🔴 Red Flags | 🟠 Amber Flags |
|---|---|---|
| Balance Sheet | 1 | 1 |
| Income Statement | 2 | 1 |
| Governance / Disclosure | 0 | 1 |
| Strategic Risk Factors | 3 | 0 |
🔴 Total Red Flags: 6
🟠 Total Amber Flags: 3
🔴 High Borrowings: Significant expansion of debt facilities in late 2024 increases leverage risk.
🔴 Revenue vs Profit Divergence: Net losses widened despite stable revenue due to non-operating items.
🔴 Chronic Unprofitability: Losses persist multiple years with no clear path to net profitability.
🔴 Revenue < Capex: Capex outpaces revenue by a large margin, driven by international build-outs.
🔴 Funding Dependency: Equity raise and new debt package confirm reliance on external funding.
🟠 Idle Cash: Significant cash on balance sheet with limited clarity on ROI deployment plan.
🟠 Extraordinary Items: Material refinancing costs in 1H25 skewed profitability.
🟠 Promotional Language: Heavy emphasis on AI positioning may overstate near-term fundamentals.
Disclaimer: This information is provided purely for educational purposes. It takes no account of an individual’s personal financial circumstances and hence can in no way constitute financial advice. The above data may be subject to errors or inconsistencies for which the author takes no liability. It is imperative that all investors do their own research or if they need advice, seek it from a qualified financial adviser.
Forensic Analysis: NextDC ASX:NXT
This content is restricted to Supporters. Please Sign In.
Not a member? Follow the for a Free 14 Day Trial (no credit card required).
This content is restricted to Supporters. Please Sign In.
Not a member? Follow the for a Free 14 Day Trial (no credit card required).
This content is restricted to Supporters. Please Sign In.
Not a member? Follow the for a Free 14 Day Trial (no credit card required).
This content is restricted to Supporters. Please Sign In.
Not a member? Follow the for a Free 14 Day Trial (no credit card required).
This content is restricted to Supporters. Please Sign In.
Not a member? Follow the for a Free 14 Day Trial (no credit card required).
This content is restricted to Supporters. Please Sign In.
Not a member? Follow the for a Free 14 Day Trial (no credit card required).
This is a restricted members post.
Website: https://www.praemium.com.au
The Q3 FY2025 update from Praemium Limited highlights continued growth in Funds Under Administration (FUA), led by strong performance in its newer Spectrum platform. While headline growth remains robust, platform-specific flows reveal areas of softness and adviser attrition challenges.
| Metric | Q3 FY2025 | Q2 FY2025 | Q3 FY2024 | Change (YoY) |
|---|---|---|---|---|
| Total FUA | $62.3 billion | $62.1 billion | $53.3 billion | +17% |
| Platform FUA | $30.0 billion | $30.1 billion | $24.3 billion | +24% |
| Net Inflows | $364 million | $371 million | Not disclosed | ↓ $7 million QoQ |
| Spectrum FUA | $513 million | $72 million | Nil | +615% QoQ |
| Adjusted EBITDA, EBT, EPS | Not disclosed | |||
| Dividend | Not disclosed |
📈 Strong growth in Spectrum with net inflows of $440 million, indicating rapid uptake of the IDPS solution.
💸 Total FUA reached a record $62.3 billion, up 17% YoY, demonstrating broad-based resilience.
⚠️ Powerwrap and OneVue reported net outflows of $66 million and $130 million respectively, raising questions about adviser retention.
🧮 Negative market movement of $451 million impacted overall FUA growth.
📌 Platform FUA growth of 24% YoY exceeds typical industry benchmarks.
🔄 SMA net inflows of $120 million were down significantly from the previous quarter ($261 million), possibly below investor expectations.
🛑 Powerwrap’s continuing outflows—driven by departed advisers—may weigh on sentiment despite broader growth.
🆕 The inclusion of OneVue’s $4.1b FUA provides a one-off lift, but the net outflows suggest integration frictions.
🧪 CEO highlights strong pipeline for Spectrum in private wealth, suggesting momentum into FY2026.
🔄 OneVue integration is on track, with synergies expected by FY-end—a key area to monitor.
🧠 Investments in AI-driven quality assurance and administration automation to improve service delivery.
🤝 New adviser onboarding processes and expanding in-house administration signal a strategic pivot toward service control.
Strong Revenue Momentum
H1 FY25 revenue: $52.3M (↑33% YoY)
Driven by OneVue acquisition ($6M), SMA repricing, and organic FUA growth.
Solid EBITDA Margin Resilience
Underlying EBITDA H1 FY25: $12.9M (↑43% YoY)
EBITDA margin improved to 25% vs 23% prior period.
Positive Net Profit Before Tax
$7.52M in H1 FY25 vs $5.54M in H1 FY24 → +36% YoY
Record FUA
Total FUA: $62.3B at Q3 FY25 (↑17% YoY)
Platform FUA: $30.0B (↑24%)
Strong net inflows: $364M for Q3
Growing Contribution from Spectrum
Spectrum net inflows: $440M in Q3 FY25, up from $69M in Q2
| Metric | Analyst FY25 Estimate | Updated Estimate | Rationale |
|---|---|---|---|
| Revenue | $104.68M | $108M – $112M | 33% YoY growth in H1 implies beat likely |
| EBITDA | $26.65M | $28M – $30M | Strong H1 margin + cost control |
| EBT (adj.) | $19.34M | $20.5M – $21.5M | 36% YoY lift in H1 EBT already |
Disclaimer:
This information is provided purely for educational purposes. It takes no account of an individual’s personal financial circumstances and hence can in no way constitute financial advice. The above data may be subject to errors or inconsistencies for which the author takes no liability. It is imperative that all investors do their own research or if they need advice, seek it from a qualified financial adviser.
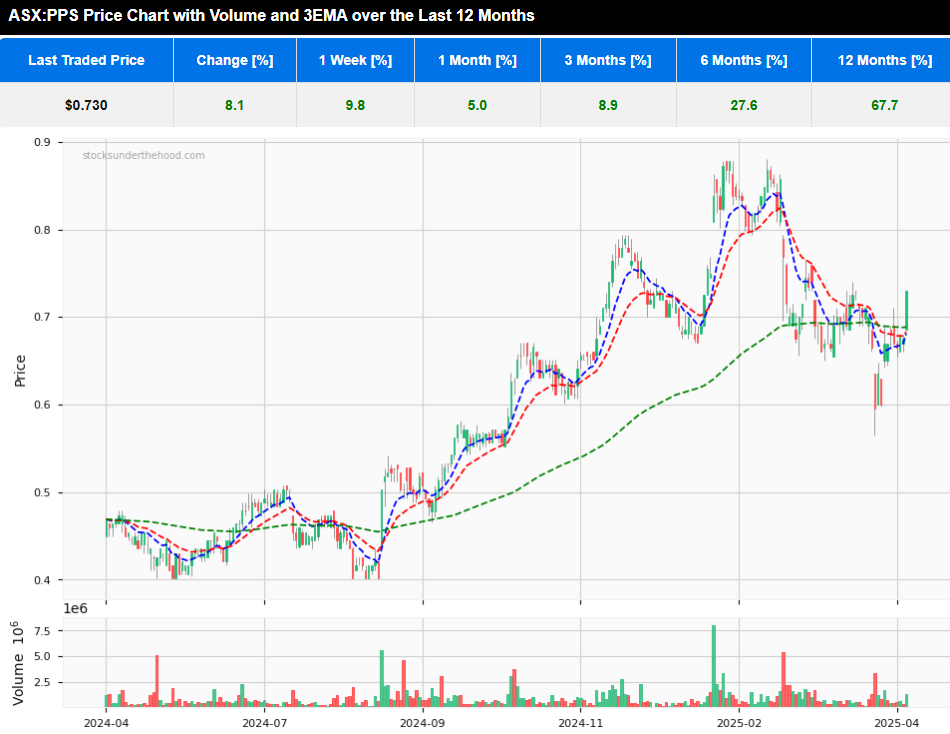
Q3FY25 ASX:PPS
Website: www.zip.co
Zip Co continues to build momentum across its core markets, showing accelerated growth and disciplined execution, particularly in the United States. The company has delivered its largest-ever quarterly cash earnings, resulting in an upgraded FY25 earnings guidance and strong indications of profitable scalability.
| Metric | 3Q FY25 | 2Q FY25 | 1H FY25 | YoY Change (3Q vs 3Q24) |
|---|---|---|---|---|
| Revenue | $278.9m | $271.5m | $514.0m (1H) | ▲ 26.5% |
| TTV | $3.3b | $3.43b | $6.2b (1H) | ▲ 35.7% |
| Cash EBTDA | $46.0m | $21.0m (approx) | $67.0m (1H) | ▲ 219.4% |
💰 Cash EBTDA hit a record $46.0m, up 219% YoY, and Zip upgraded FY25 guidance to at least $153m, up from $147m.
🚀 US market strength continues, with TTV up 40.2% YoY and revenue up 44.1%, showing strong repeat customer engagement.
📉 Revenue margin slightly declined to 8.6% (from 9.2%) due to higher proportion of lower-margin US volume.
⚠️ Slight QoQ declines in ANZ TTV and active customer numbers, but still showing solid YoY improvement.
✅ Exceeded expectations for EBTDA, driven by robust US growth and operational leverage.
✅ Strong cost management, with opex growth contained to ~10%, contributing to operating margin lift to 16.5% in Q3 (vs 13.0% in Q2).
⚠️ ANZ revenue fell 1.3% YoY, suggesting competitive pressures or maturing growth.
✅ Credit quality remains strong, with net bad debts steady at ~1.6%, within or below management’s 1.5–2.0% target range.
🔼 FY25 cash EBTDA guidance upgraded to at least $153m from $147m.
🧱 Continued investment in ANZ and US product innovation, with strong performance from new offerings like Zip Plus and Pay-in-8.
💳 $50m share buyback announced, showing confidence in capital position and outlook.
📊 Zip reiterated its FY25 two-year strategic targets, suggesting no change to long-term goals despite macro uncertainties.
New FY25 guidance upgrade: Cash EBTDA now expected to exceed $153m, up from $147m (set in February).
GameStop partnership expanded to online, and new US merchants like Temu and Tire Agent added—indicating deeper retail channel penetration.
Cash and liquidity increased to $204.5m, up from $195.5m at 1H end.
Portfolio yield in AU ticked up to 18.7%, indicating ongoing margin expansion.
Operating margin hit 16.5% in 3Q25, up significantly from 13.0% in 2Q25—suggesting effective cost discipline and scale.
Disclaimer:
This information is provided purely for educational purposes. It takes no account of an individual’s personal financial circumstances and hence can in no way constitute financial advice. The above data may be subject to errors or inconsistencies for which the author takes no liability. It is imperative that all investors do their own research or if they need advice, seek it from a qualified financial adviser.
ZIP Co (ASX:ZIP) Q3FY25 Update
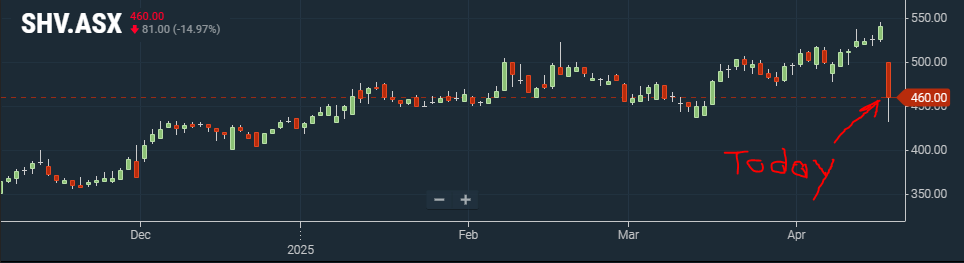
Select Harvests has released an update to the market today (Wednesday April 16). It included a downgrade to production with an upgrade to almond pricing. The market has responded negatively to the news in early trade. Let’s try and determine if this initial market reaction is appropriate.
Website: www.selectharvests.com.au
Select Harvests has issued a constructive update amidst a challenging crop year. Despite a lower-than-expected almond production, the strong pricing environment and strategic execution are expected to offset volume headwinds, reinforcing management’s confidence in delivering long-term value.
| Metric | FY24 (AGM) | March 2025 Briefing | April 2025 Update |
|---|---|---|---|
| Revenue | $337m | Confirmed | Not updated |
| Almond Price (forecast) | $7.69/kg | $9.20/kg | ↑ $10.35/kg |
| Crop Volume Forecast | 29,527MT (actual FY24) | 27,500–29,000MT (March) | ↓ 24,000–26,500MT |
| Exchange Rate Hedge | Not disclosed | 86% of 2025 crop hedged at 0.648 | Confirmed |
📈 Almond pricing upgraded to A$10.35/kg, up from A$9.20/kg in March and A$7.69/kg in FY24. This represents a +35% YoY price increase and supports profitability despite lower volumes.
🌐 Strong global demand, particularly from China and India, is sustaining price strength.
🏭 Processing capacity expansion continues at Carina West, helping to scale efficiently into future years.
💵 86% of 2025 crop is hedged, reducing FX risk in volatile markets.
🌾 Crop downgrade from 27,500–29,000MT to 24,000–26,500MT, driven by poor bloom strength, large hulls, and frost damage (~500MT).
🌿 The Nonpareil variety’s crack-out rates are lower, impacting kernel yields.
🌧️ Continued weather volatility in NSW presents a risk for future crop consistency.
🧪 Strategy benefits expected from 2026 onwards, indicating muted near-term uplift from transformation efforts.
🔼 Analysts were previously modelling A$9.20/kg pricing, so A$10.35/kg represents a beat.
🔽 However, volumes are materially lower, likely dragging revenue and EBITDA forecasts down despite price support.
📊 Analysts will likely need to trim volume forecasts but increase realised price assumptions, creating a mixed revision outlook.
🌎 Almond macro tailwinds remain intact, including rising demand, constrained US supply, and low global inventories.
🏗️ Strategy remains unchanged – scale-up, cost management, customer expansion, and margin capture.
🌱 New horticultural strategy should show tangible results from 2026, with full benefits expected in 2027.
🔁 Despite lower 2025 crop, management sees no ongoing structural impact on future crops.
Previous FY25 Crop Forecast: 27,500 – 29,000 MT
Updated Forecast: 24,000 – 26,500 MT
This ~10% downgrade in volume reflects weaker bloom and low crack-out rates (particularly from Nonpareil), plus 500MT frost losses. This will likely pressure revenue and EBITDA forecasts downward, all else equal.
Previous FY25 Price Forecast: A$9.20/kg
Updated Forecast: A$10.35/kg (~12.5% increase)
Higher almond pricing, driven by global supply tightening (especially California) and strong demand from China and India, more than offsets the crop downgrade on a dollar basis, likely lifting margin expectations and partially or fully offsetting the crop volume impact on EBITDA.
Revenue: Likely to remain flat to slightly up, as higher price offsets volume loss.
Adjusted EBITDA: Likely to be revised up slightly, particularly if hedging gains and cost discipline continue.
EBT (Earnings Before Tax): Should benefit from pricing tailwinds and lower production costs — mild upward revision likely.
Despite a crop downgrade, higher almond prices and favourable hedging are expected to offset volume losses, leading to stable or slightly higher revenue forecasts. Adjusted EBITDA and EBT are likely to be revised upward due to improved pricing, cost efficiencies, and operational execution. Overall, the outlook remains positive with strong momentum into FY25.
Disclaimer: This information is provided purely for educational purposes. It takes no account of an individual’s personal financial circumstances and hence can in no way constitute financial advice. The above data may be subject to errors or inconsistencies for which the author takes no liability. It is imperative that all investors do their own research or if they need advice, seek it from a qualified financial adviser.
Select Harvests (ASX:SHV) April Update
This content is restricted to supporters of stocksunderthehood.com
Become a supporter or take a free 14 day trial here:
Website: vistagroup.co.nz
Vista Group International (NZX & ASX: VGL) reported strong momentum in 2024, achieving record revenue, positive free cash flow, and increased long-term EBITDA margin aspirations. The transition to cloud-based solutions is accelerating, reinforcing the company’s strategic shift to SaaS.
| Metric | 2024 | 2023 | Change YoY |
|---|---|---|---|
| Revenue | $150.0m | $143.0m | +5% |
| Recurring Revenue | $134.6m | $124.0m | +9% |
| SaaS Revenue | $55.7m | $45.9m | +21% |
| Annual Recurring Revenue (ARR) | $145.6m | $126.3m | +15% |
| EBITDA | $21.6m | $13.3m | +62% |
| Operating Cash Flow | $16.8m | $9.0m | +87% |
| Net Profit Before Tax (NPBT) | $1.8m | ($17.5m) | +110% |
| Dividend | No dividend declared | N/A | N/A |
💰 Positive free cash flow achieved in 2H24, ahead of 4Q24 guidance.
☁️ Strong transition to cloud – 17 new clients signed, 683 sites live, representing 15% of enterprise client sites.
📈 EBITDA margin aspirations increased to 33-37% (from 25-30%) over the long term.
📊 Vista Cloud adoption accelerating – major new signings include Cine Colombia, Cinema West, and Silky Otter.
🎥 Industry performance boosted by blockbuster releases such as Inside Out 2 (US$1.7b box office) and Deadpool & Wolverine.
✅ Positive Surprises:
⚠️ Potential Concerns:
📈 Above Expectations:
📉 Below Expectations:
📊 Financial Guidance:
🚀 Strategic Priorities:
The share price of Vista Group had been trending higher into this result.
Revenue guidance suggests no major revisions should be needed by analysts. Strong EBITDA performance may see slight revisions higher.
Disclaimer: This information is provided purely for educational purposes. It takes no account of an individual’s personal financial circumstances and hence can in no way constitute financial advice. The above data may be subject to errors or inconsistencies for which the author takes no liability. It is imperative that all investors do their own research or, if they need advice, seek it from a qualified financial adviser.
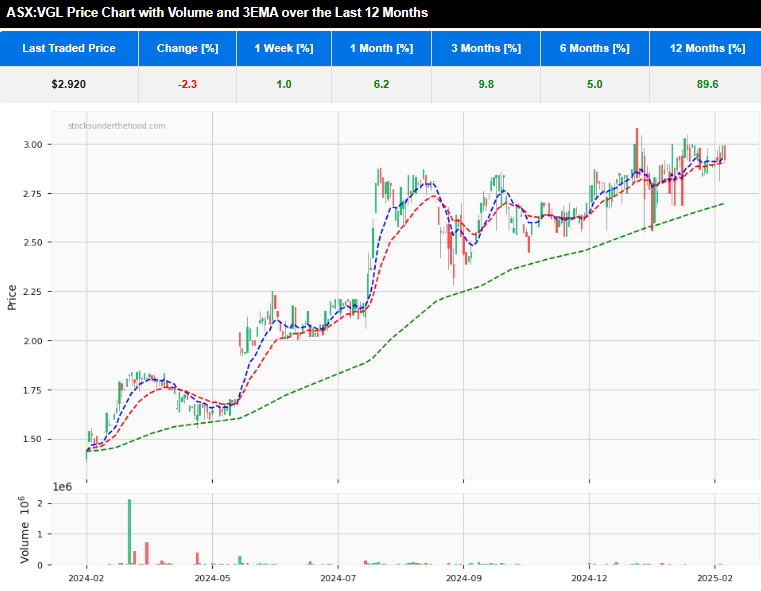
Quick Take: FY2024 ASX:VGL
Fleetwood Limited delivered strong revenue growth (+19%), with significant EBIT improvement (+$12M YoY), driven by Building Solutions and Community Solutions. Despite challenges in RV Solutions, cash flow improved, and the company increased its dividend to 11.5cps, highlighting confidence in future earnings.
| Metric | H1FY25 | H1FY24 | Change ($) | Change (%) |
|---|---|---|---|---|
| Revenue | $272.7M | $229.9M | + $42.8M | +19% |
| EBITDA | $25.2M | $14.5M | + $10.7M | +74% |
| Underlying EBIT | $18.3M | $6.3M | + $12.0M | +190% |
| Net Profit After Tax (NPAT) | $4.7M | $3.9M | + $0.7M | +18% |
| Free Cash Flow | $21.6M | -$10.6M | + $32.2M | +300% |
| Order Book | $137M | $100M | + $37M | +37% |
| Dividend (fully franked) | 11.5 cps | 2.5 cps | +9.0 cps | +360% |
📈 Revenue Growth & Business Performance
💰 Profitability & Cash Flow
🚀 Strategic Developments
✅ Revenue and EBIT exceeded expectations, driven by Building & Community Solutions growth.
✅ Cash flow turnaround (+$32.2M YoY) reflects strong working capital management.
⚠️ RV Solutions impairment ($6M) and restructuring costs ($1.9M) highlight ongoing challenges in the caravan market.
✅ Dividend of 11.5 cps significantly higher than 2.5 cps in H1FY24, demonstrating confidence in earnings momentum.
🔹 Building Solutions:
🔹 Community Solutions:
🔹 RV Solutions:
Shares in the Fleetwood were strong coming into this result.
2. EBITDA Forecasts:
Final Takeaway:
Disclaimer: This information is provided purely for educational purposes. It takes no account of an individual’s personal financial circumstances and hence can in no way constitute financial advice. The above data may be subject to errors or inconsistencies for which the author takes no liability. It is imperative that all investors do their own research or if they need advice, seek it from a qualified financial adviser.
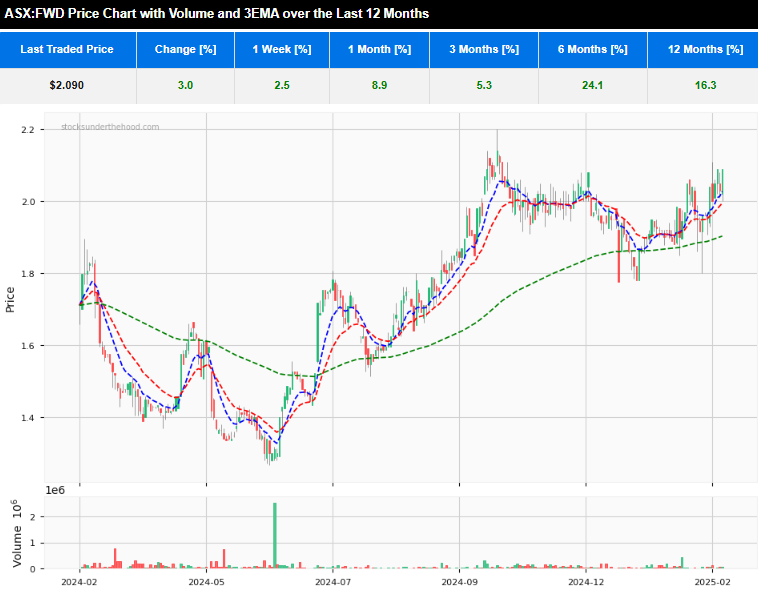
Quick Take: H1FY25 ASX:FWD
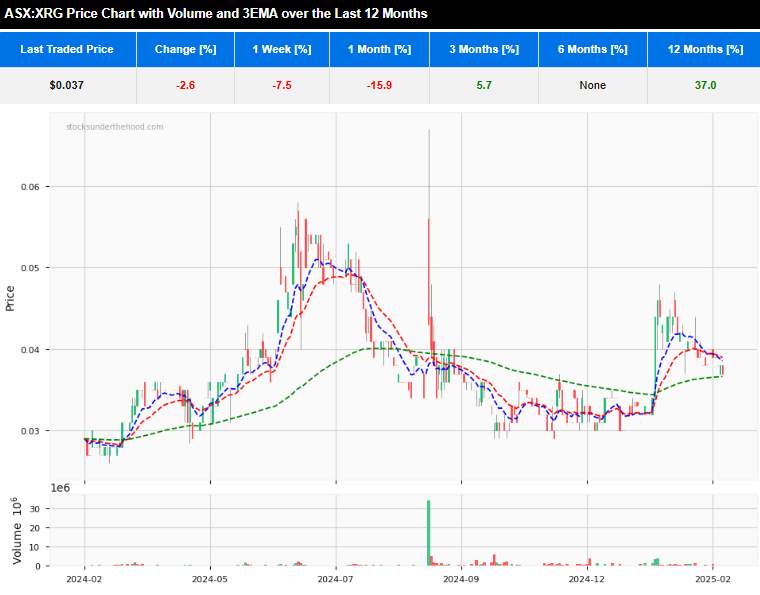
XReality Group (XRG) interim report reflects strong revenue growth driven by the success of Operator XR, partially offset by weakness in the entertainment segment. While the company remains unprofitable, the net loss has narrowed, and management is focusing on high-margin technology-driven business. The outlook for Operator XR remains positive, with continued growth in customer acquisitions and contract value.
| Metric | 31 Dec 2024 | 31 Dec 2023 | Change ($) | Change (%) |
|---|---|---|---|---|
| Revenue | $7.42M | $5.61M | + $1.82M | +32% |
| Adjusted EBITDA | $0.9M | $0.46M | + $0.44M | +96% |
| Operating Cash Flows | $1.32M | $0.77M | + $0.54M | +70% |
| Net Loss After Tax (NLAT) | – $0.99M | – $1.50M | + $0.51M | +34% |
| Normalised EPS (cents) | – 0.18 | – 0.32 | +0.14 | +44% |
| Dividend | Nil | Nil | – | – |
📈 Revenue Growth & Business Shift
💰 Profitability & Cash Flow
📌 Strategic Adjustments & Future Focus
✅ Revenue beat expectations, driven by strong Operator XR sales growth.
✅ EBITDA exceeded projections, indicating effective cost control.
⚠️ Net loss remains a concern, although it has narrowed significantly.
⚠️ Entertainment sector underperformance could weigh on future valuation.
🚀 Operator XR set for continued expansion, targeting new markets in Europe & Asia.
📊 Annual Recurring Revenue (ARR) at $3.6M, with Total Contract Value (TCV) up 80% YoY to $7.4M.
💼 iFLY & Freak Entertainment restructuring planned, with possible exits in FY2025.
🔎 Focus on AI-driven innovations, led by new Chief AI Advisor.
Disclaimer: This information is provided purely for educational purposes. It takes no account of an individual’s personal financial circumstances and hence can in no way constitute financial advice. The above data may be subject to errors or inconsistencies for which the author takes no liability. It is imperative that all investors do their own research or if they need advice, seek it from a qualified financial adviser.
Quick Take: H1FY25 ASX:XRG
Austin Engineering (ASX: ANG) has reported strong revenue and earnings growth for FY25 H1, with standout performances in North America and APAC. However, operating cash flow challenges and margin pressures in South America are key considerations. The order book at a multi-year high reinforces confidence in future growth, and the company has reiterated its full-year guidance.
| Metric | FY25 H1 | FY24 H1 | Change (%) |
|---|---|---|---|
| Revenue | $170.2M | $143.6M | +18.5% |
| Underlying EBITDA | $25.3M | $20.8M | +22.0% |
| Operating Cash Flow | $(3.5M) | Positive | Negative |
| Adjusted Earnings Before Tax (EBT) | $20.0M | $15.8M | +27.0% |
| Normalised NPAT | $17.4M | $15.0M | +16.0% |
| Normalised EPS | Not Disclosed | Not Disclosed | – |
| Dividend (Interim, Fully Franked) | 0.6c per share | 0.4c per share | +50% |
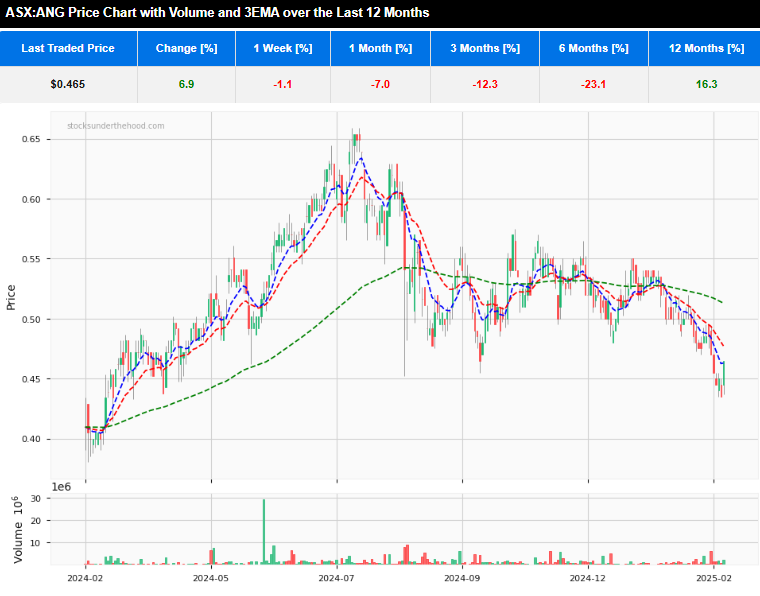
Revenue and EBITDA Performance
H1 FY25 Revenue: $170.2M (18.5% YoY growth)
H1 FY25 Underlying EBITDA: $25.3M (22% YoY growth)
Analyst Forecasts:
Assessment:
“Disclaimer: This information is provided purely for educational purposes. It takes no account of an individual’s personal financial circumstances and hence can in no way constitute financial advice. The above data may be subject to errors or inconsistencies for which the author takes no liability. It is imperative that all investors do their own research or if they need advice, seek it from a qualified financial adviser.”
Quick Take: H1FY25 ASX:ANG