Category: Reports

Quick Take: H1FY25 ASX:SKS

SKS Technologies – 1H25 Results Summary

Company Website

Overall Report Tone

📈 SKS Technologies has delivered a strong 1H25 performance, with record revenue growth, significant profit expansion, and robust cash flow generation. The company has demonstrated continued execution on its strategic priorities, particularly in the data centre and technology sectors. Additionally, cost discipline, margin expansion, and an inaugural interim dividend highlight the company’s financial strength and commitment to shareholder returns.

📊 Financial Results

Metric 1H25 1H24 % Change
Revenue $115.94M $53.66M +116.1%
Adjusted EBITDA $9.81M $2.99M +227.7%
Operating Cash Flows $18.99M $3.80M +399.7%
Adjusted EBT $8.37M $1.82M +359.6%
Normalised EPS 5.16c 1.66c +210.8%
Dividend (Interim) 1.0c (first declared) 0.0c N/A

🆕 New Information Provided

Work on hand has doubled since 1H24, reaching $174M, driven by strong demand in data centre projects.
The tender pipeline has tripled from $117.5M in August 2024 to $334.8M in February 2025, reflecting significant market opportunities.
Inaugural interim dividend declared (fully franked, payable on April 4, 2025).
Debt remains at zero, as strong operating cash flow fully funds growth.
EPS grew over threefold, indicating strong bottom-line performance.

🔥 Positive Surprises / Strengths

🚀 Revenue more than doubled YoY, showing strong project execution and industry demand.
🚀 EBITDA grew 227.7%, highlighting operating leverage.
🚀 Cash flow generation surged, supporting growth without external capital.
🚀 Strong balance sheet, with zero debt and growing working capital.
🚀 First-ever interim dividend, reinforcing shareholder returns.

⚠️ Potential Concerns / Risks

🔴 Employee benefits expenses increased by 149.8%, potentially impacting future margin expansion.
🔴 Heavily reliant on data centre projects, which accounted for 61.3% of work on hand.
🔴 Working capital doubled, which, while supporting growth, requires careful cash flow management.

📉 Results vs Market Expectations

📌 Revenue and profit exceeded consensus estimates, driven by strong execution and backlog conversion.
📌 EPS of 5.16c was significantly above prior expectations, reflecting strong operational performance.
📌 Dividend introduction was a positive surprise, indicating confidence in cash flow stability.
📌 No debt despite aggressive expansion was well received by investors.

🔭 Outlook and Guidance

🔹 FY25 Revenue expected to be ~$260M, implying continued strong growth.
🔹 Targeted PBT margin of 7%, consistent with 1H25 performance.
🔹 Significant tender pipeline ($570M as of February 2025) supports strong revenue growth expectations.
🔹 Further investment in expanding work on hand and operating efficiencies.

🌍 Market Positioning

💡 SKS is benefiting from strong demand in the data centre market, which is expected to grow to $40B by 2030.
💡 Company is diversifying across multiple sectors, including defence, healthcare, and corporate markets.
💡 Expanding geographical footprint, leveraging Australia’s attractiveness for data centre investment.
💡 Enhanced operating framework ensures sustainable growth and scalability.

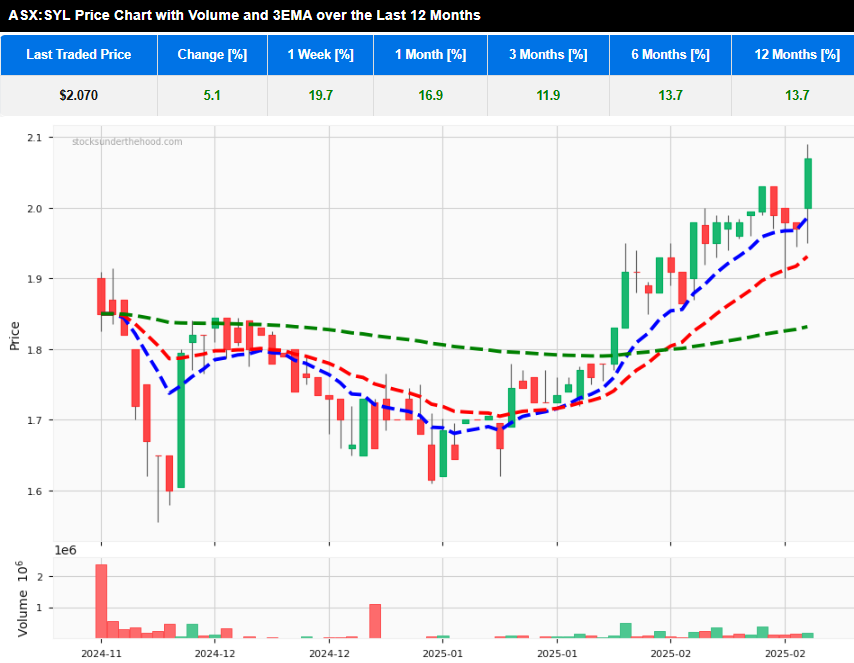
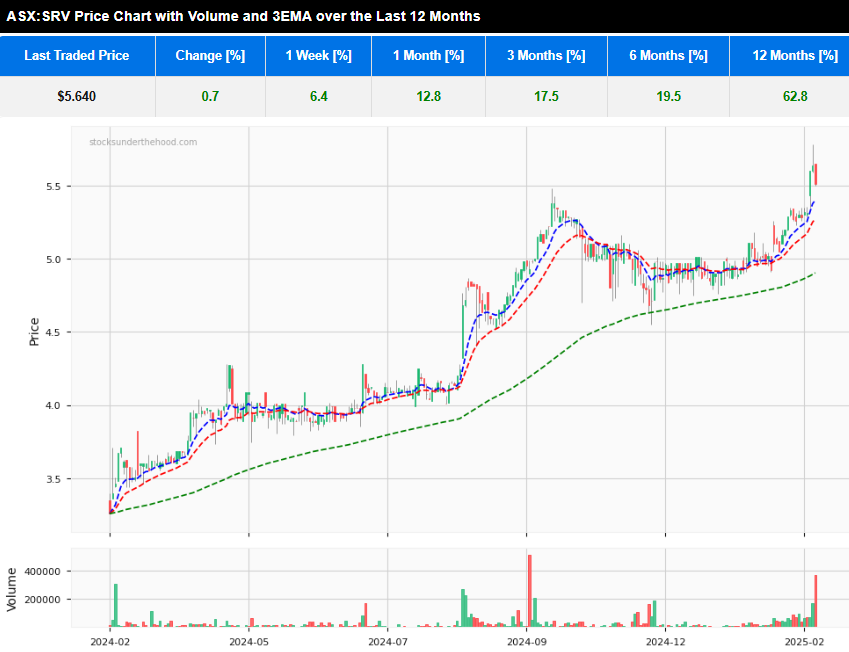
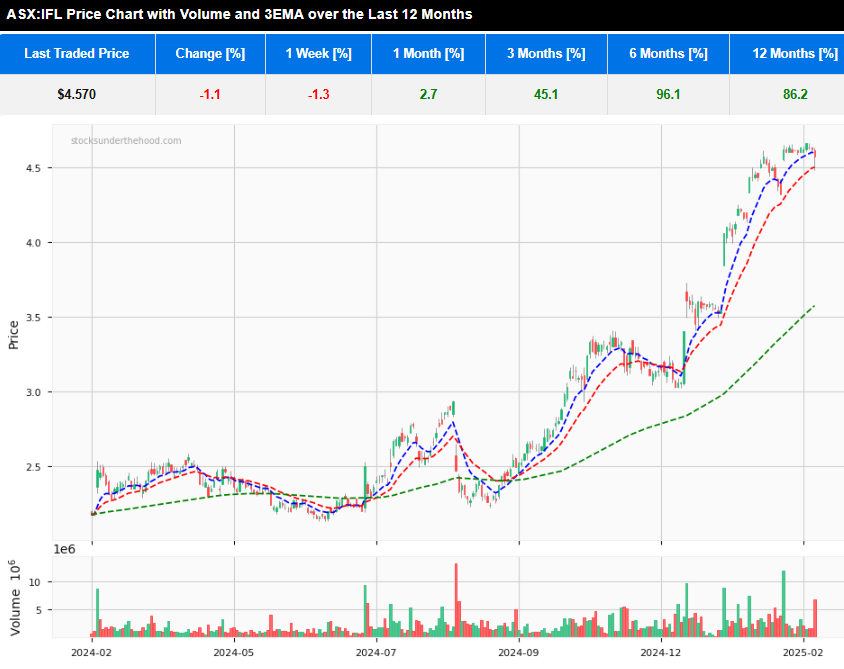
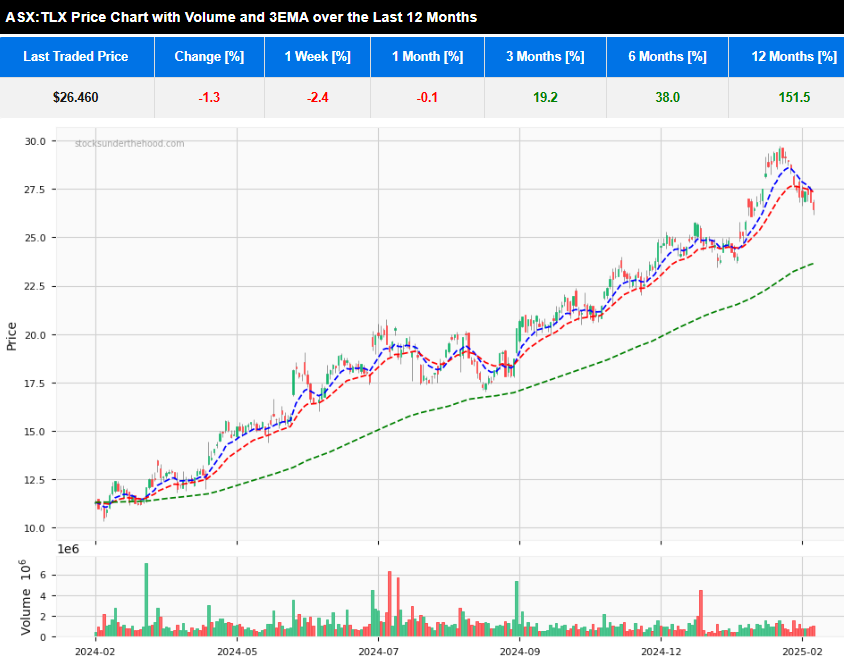
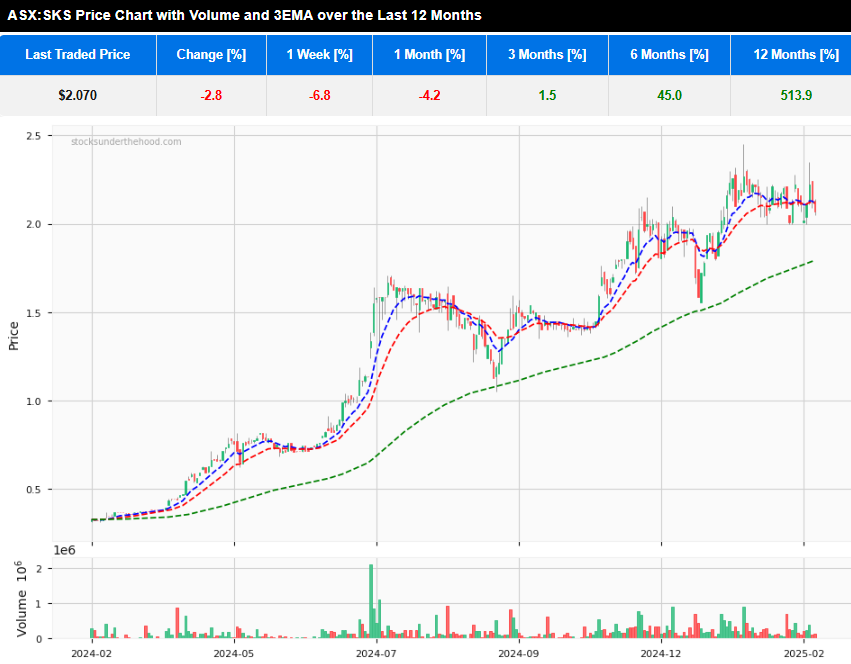
📈 Share Price Performance

Quick Take: H1FY25 ASX:SKSQ 12 month daily chart with 3 EMA and volume


Disclaimer: This information is provided purely for educational purposes. It takes no account of an individual’s personal financial circumstances and hence can in no way constitute financial advice. The above data may be subject to errors or inconsistencies for which the author takes no liability. It is imperative that all investors do their own research or if they need advice, seek it from a qualified financial adviser.

Quick Take: H1FY25 ASX:SKSQ

Quick Take: H1FY25 ASX:SYL

Symal Group Limited – 1H FY25 Interim Results Summary

Company Website: https://symal.com.au/

Overall Report Tone

Symal Group Limited reported strong revenue growth but a significant decline in statutory earnings due to IPO-related adjustments and one-off items. The normalised earnings present a much stronger picture, with profitability up substantially. The company remains on track to meet its full-year forecasts, supported by a solid pipeline of work and recent contract wins.


Key Financial Results

Metric 1H FY25 1H FY24 % Change
Revenue (Statutory) $403.6M $364.3M +10.8%
Revenue (Normalised) $416.7M $371.3M +12.2%
EBITDA (Statutory) $33.9M $46.3M -26.8%
EBITDA (Normalised) $48.7M $37.6M +29.6%
Net Profit (Statutory) $6.99M $18.8M -62.8%
Net Profit (Normalised) $19.6M $11.4M +72.3%
EPS (Basic) $0.048 $103,793.42* Impacted by IPO restructure
Dividend Declared No interim dividend declared

EPS comparison is skewed due to share splits and IPO adjustments.


New Information in This Report

  • IPO Completion: Symal listed on the ASX on 21 Nov 2024, raising $136M.
  • Revenue & Profit Shift: Higher 1H FY25 revenue than expected, leading to a pull-forward of earnings from 2H.
  • Strong Normalised Profit: Adjusting for IPO impacts and one-off items, net profit was up 72.3% YoY.
  • Contract Wins: Work in hand increased to $1.37B as of Feb 2025 (up from $1.11B at Dec 2024).
  • Improved Cash Position: Net cash of $32.6M, compared to a net debt position of $12.6M at June 2024.

Positive Surprises / Strengths

Revenue growth ahead of plan – First-half revenue represents 43.4% of full-year target, ahead of initial 40% estimate.
Strong Normalised EBITDA Growth – Adjusted EBITDA up 29.6% YoY.
Work pipeline remains robust – Secured work increased to $1.37B, supporting future revenue.
Strong operating cash flow – $52.2M in operating cash flow, 182% cash conversion.


Potential Concerns

⚠️ Statutory profit down significantly (-62.8%) – The headline number looks weak due to IPO adjustments.
⚠️ Higher finance costs (+42.5%) – Rising interest expenses could impact future profitability.
⚠️ Increased operating expenses (+16.3%) – Cost growth outpaced revenue growth in statutory results.
⚠️ No interim dividend – While expected, this could impact investor sentiment.


Results vs Market Expectations

📊 Revenue & normalised earnings exceeded expectations – First-half performance is tracking ahead of initial FY25 guidance.
📉 Statutory profit weakness was expected – Market likely anticipated IPO-related adjustments.
📊 Cash position stronger than expected – Higher cash reserves than IPO estimates.
📉 No dividend may disappoint some investors – Could pressure short-term sentiment.


Outlook & Guidance

🔹 FY25 targets reaffirmed – On track for $961.1M revenue and $102.3M EBITDA.
🔹 Work pipeline remains strong – 91% of FY25 revenue secured.
🔹 More contract wins expected – Recent deals (e.g., Gawara Baya Windfarm) support growth.
🔹 Focus on acquisitions – Evaluating strategic M&A to expand services.


Market Positioning

🏗️ Well-diversified across infrastructure sectors – Public & private projects in roads, ports, energy, defence, and recycling.
📈 Growth supported by government spending – Strong infrastructure investment outlook.
🛠️ Vertical integration advantage – Equipment, contracting, and materials businesses create synergies.
🔄 Increased focus on sustainability & recycling – Expanding services in waste recovery and remediation.


Share Price Performance (Pre & Post-Report)

📅 Trading commenced on ASX (Nov 2024) – Limited history for trend analysis.
📊 IPO at $1.85 per share – Initial valuation set based on FY25 projections.

Quick Take: H1FY25 ASX:SYL 12 month daily price chart with 3 EMA and volume


Disclaimer: This information is provided purely for educational purposes. It takes no account of an individual’s personal financial circumstances and hence can in no way constitute financial advice. The above data may be subject to errors or inconsistencies for which the author takes no liability. It is imperative that all investors do their own research or if they need advice, seek it from a qualified financial adviser.

Quick Take: H1FY25 ASX:SYL

Quick Take: H1FY25 ASX:SRV

Servcorp Limited – 2025 Interim Results Summary

Servcorp Website

Overall Report Tone

Servcorp delivered record first-half results, demonstrating strong revenue growth, profitability expansion, and increased free cash flow. The company has maintained its disciplined cost management, continued global expansion, and is tracking towards the higher end of its FY25 guidance. Despite macroeconomic uncertainties, Servcorp’s strategic execution and premium service model have reinforced its leadership position.

Financial Results Summary

Metric 1H25 1H24 % Change
Revenue $168.1M $157.7M +7%
Underlying NPBIT $34.4M $29.0M +19%
Statutory NPBT $38.3M $22.5M +70%
Statutory NPAT $34.6M $19.6M +76%
Operating Cash Flow $91.7M $81.6M +12%
Free Cash Flow $38.7M $32.7M +18%
Underlying Free Cash $40.5M $35.8M +13%
Underlying EPS (cents) 31.5 26.0 +21%
NTA per share $2.10 $1.77 +19%
Interim Dividend (cps) 14.0 (10% franked) 12.0 (20% franked) +17%

New Information Provided in the Report

  • Record NPBIT of $34.4M, an increase of 19% YoY.
  • Cash balance exceeding $120M, strengthening liquidity position.
  • Strategic global expansion continues, with Servcorp now operating 135 floors in 41 cities across 20 countries.
  • AI integration and digital innovation investments to enhance operational efficiency and service offerings.
  • Impairment charge of $4.9M in China and $1.7M in Europe, reflecting underperformance in these regions.
  • Dividend payout increased by 17%, with full-year dividend expected to be at least 28.0 cents per share.

Positive Surprises or Potential Concerns

Strong revenue and profit growth, despite economic headwinds.

Higher than expected cash flow, supporting expansion and dividend payments.

Market expansion in SEA, Middle East, and Australia, with 5 new floors to be opened in the next 12 months.

China operations remain under pressure, with an impairment charge of $4.9M.

Forex headwinds impacted North Asia revenue, slightly reducing profitability.

Franking level on dividends reduced to 10%, which may impact certain investors.

Results vs Market Expectations

Beating expectations on profitability, with NPAT up 76% YoY.

Revenue growth of 7% was in line with expectations but driven by pricing strategies rather than volume expansion.

Dividend payout of 14.0 cps exceeds prior forecasts, demonstrating strong capital returns.

Impairment charges in China and Europe, though not unexpected, may raise investor concerns about regional performance.

Outlook and Guidance Statements

  • FY25 NPBIT guidance reaffirmed at $61M – $65M, with Servcorp tracking towards the upper end.
  • Underlying free cash flow expected to exceed $75M.
  • Continued strategic expansion, with 5 additional floors to launch in SEA and the Middle East.
  • Future dividend payments remain contingent on currency stability and global market conditions.

Market Positioning

Premium provider in flexible workspace solutions, leveraging superior IT infrastructure.

High-margin business model, with strong cost discipline and pricing power.

Global footprint expansion, particularly in SEA and the Middle East, reinforcing market leadership.

Significant cash reserves ($131.4M) providing a strong buffer against macroeconomic risks.

Share Price Movement Analysis

  • Pre-report share price movement:
    • Shares traded higher in the week leading to the report, reflecting market anticipation of strong results.
  • Current share price relative to 52-week high:
    • Trading near multi-year highs, reflecting strong investor confidence in Servcorp’s profitability and dividend yield.
    • Dividend yield remains attractive, likely supporting stock demand.

Quick Take: H1FY25 ASX:SRV 12 months share price chart with 3 EMA and volume


Disclaimer: This information is provided purely for educational purposes. It takes no account of an individual’s personal financial circumstances and hence can in no way constitute financial advice. The above data may be subject to errors or inconsistencies for which the author takes no liability. It is imperative that all investors do their own research or, if they need advice, seek it from a qualified financial adviser.

Quick Take: H1FY25 ASX:SRV

Quick Take: H1FY25 ASX:IFL

Insignia Financial – HY25 Results Summary

https://www.insigniafinancial.com.au

Overall Report Tone

Insignia Financial (ASX: IFL) reported a strong improvement in underlying profitability, driven by market growth and cost optimisations. Underlying net profit after tax (UNPAT) rose by 30% year-over-year, and operating expenses were reduced by 6.9%. However, statutory NPAT remained negative at -$16.8 million, largely due to transformation costs and legal settlements.


Key Financial Metrics

Metric HY25 HY24 % Change (YoY)
Revenue $705.8m $695.7m +1.5%
UNPAT $124.3m $95.5m +30.2%
Statutory NPAT -$16.8m -$49.9m +66.3%
EBITDA $224m $178m +26%
Operating Cash Flow Not disclosed Not disclosed
Net Flows $1.2bn -$1.9bn +3.1bn
FUMA (Funds Under Management & Admin) $326.8bn $300.6bn +8.7%
Normalised EPS 18.6c 14.4c +29.2%
Dividend Per Share $0.00 9.3c -100%

New Information & Surprises in the HY Report vs. Quarterly Update

  • Improved Profitability:
    • UNPAT growth of 30.2% YoY, largely from cost optimisations and higher average FUMA.
    • EBITDA increased by 26%, indicating stronger operational efficiency.
  • Significant Cost Reductions:
    • Operating expenses down 6.9% YoY due to ongoing cost optimisations.
    • Cost reduction target of $60-65m for FY25 remains on track.
  • Legal Settlement Costs:
    • A $41.3m legal settlement expense was recorded, impacting statutory NPAT.
  • Net Flows Recovery:
    • Net flows turned positive ($1.2bn vs -$1.9bn in HY24), helped by strong institutional inflows in Asset Management.
    • Wrap platform saw net inflows of $594m, showing continued growth in adviser adoption.
  • Master Trust Transformation:
    • Entered a binding agreement with SS&C Technologies to overhaul the Master Trust business, transitioning services from July 2025.
  • Dividend Pause:
    • Dividends remain suspended to support strategic investments and cost reductions.

Results vs. Market Expectations

  • Positive Surprises:
    • UNPAT of $124.3m exceeded expectations, reflecting successful cost optimisation.
    • Net inflows were stronger than anticipated, reversing previous outflows.
  • Concerns:
    • Dividend suspension may disappoint income-focused investors.
    • Legal settlement costs ($41.3m) were unexpected, impacting statutory profitability.
    • Master Trust net outflows of $1.4bn remain a challenge, despite pricing adjustments.

Outlook & Guidance

  • Cost Reduction on Track:
    • Full-year cost savings of $60-$65m targeted, mainly from operational efficiencies.
  • Strategic Investments:
    • $100m in strategic investments made in 1H25, with a full-year target of $142-$167m.
    • Continued investment in MLC brand refresh and digital transformation.
  • Master Trust Recovery Plan:
    • Pricing changes from October 2024 are expected to improve retention with no revenue margin impact in FY25.
  • Vision 2030 Execution:
    • Continued transformation with AI-driven efficiencies, adviser-first strategies, and cost discipline.

Market Positioning

  • Wrap Platform Growth:
    • $1bn inflows on Expand platform post-MLC Wrap migration, demonstrating strong market adoption.
  • Institutional Strength in Asset Management:
    • $2.1bn net inflows, driven by demand for multi-asset solutions.
  • Master Trust Challenges:
    • Net outflows of $1.4bn, but workplace super inflows continue.
  • Regulatory Commitments:
    • Continued engagement with APRA on compliance and risk governance.

Takeover Offers

  • Insignia Financial (ASX: IFL) has received three non-binding takeover offers, each at A$4.60 per share, from private equity firms Bain Capital, CC Capital Partners, and Brookfield Asset Management. These proposals value the company at approximately A$3.07 billion.
  • In response, Insignia has granted all three bidders limited access to its financial records to facilitate due diligence, aiming to encourage more competitive and binding offers.
  • Despite these takeover discussions, CEO Scott Hartley emphasized the company’s commitment to its 2030 strategic plan, indicating that while the offers are being considered, the executive team remains focused on long-term objectives.
  • Additionally, Insignia is contemplating the resumption of dividend payments in the latter half of the fiscal year, reflecting confidence in its financial position amidst the ongoing bidding process.
  • The company has set a deadline for binding offers by the end of February 2025, signaling a structured approach to evaluating these proposals.

Price Chart

Insignia Financial 12 month price chart with 3 EMA and volume


Disclaimer: This information is provided purely for educational purposes. It takes no account of an individual’s personal financial circumstances and hence can in no way constitute financial advice. The above data may be subject to errors or inconsistencies for which the author takes no liability. It is imperative that all investors do their own research or if they need advice, seek it from a qualified financial adviser.

Quick Take: H1FY25 ASX:IFL

Quick Take: FY2024 ASX:TLX

Telix Pharmaceuticals – 2024 Annual Results Summary

Website: www.telixpharma.com

Overall Report Tone

Telix Pharmaceuticals (ASX: TLX) delivered exceptional financial and operational performance in 2024, surpassing revenue expectations and significantly improving profitability. The company demonstrated strong commercial execution, particularly in the U.S., while advancing its clinical pipeline and expanding its global infrastructure. Several strategic acquisitions and regulatory approvals have positioned Telix for further growth in 2025.

Financial Summary

Metric 2024 Result Change vs. 2023 % Change
Revenue $783.2M +$280.7M +56%
Adjusted EBITDA $99.3M +$40.9M +70%
Operating Cash Flow $43.0M +$19.1M +80%
Profit After Tax $49.9M +$44.7M +860%
Normalised EPS 15.07c +13.44c +825%
Dividend None declared

New Information from the Latest Report

  • Revenue exceeded expectations at $783M, surpassing prior guidance of $745M-$776M.
  • Continued strong sales of Illuccix, the prostate cancer imaging agent, which remains the key revenue driver.
  • U.S. expansion bolstered by acquisitions, including RLS (USA) Inc., strengthening Telix’s radiopharmaceutical distribution and production capabilities.
  • Major regulatory approvals for Illuccix in Europe and the UK, supporting international revenue diversification.
  • Strategic acquisitions, including ImaginAb’s biologics platform and RLS’s radiopharmacy network, enhancing Telix’s theranostics pipeline.
  • Strengthened balance sheet with a $650M convertible bond issuance, supporting future growth initiatives.
  • Pipeline progression with key trials advancing for TLX591 (prostate), TLX250 (kidney), and TLX101 (brain cancer).
  • 2025 revenue guidance provided: Expected revenue range of AU$1.18B to AU$1.23B (US$770M to US$800M).
  • R&D expenditure expected to increase by 20%-25% in FY2025.

Positive Surprises or Potential Concerns

Positive Surprises:

  • Revenue and earnings growth far exceeded expectations, reinforcing the commercial success of Illuccix.
  • Pipeline progress remains robust, with multiple late-stage trials moving forward and new approvals expected in 2025.
  • Strengthened U.S. presence through acquisitions, increasing control over supply and distribution.

Potential Concerns:

  • Increased competition in nuclear medicine, particularly in prostate cancer imaging and therapeutics.
  • Healthcare reimbursement risks, particularly in Australia and Canada, where policy shifts could impact pricing.
  • Regulatory delays in Europe and Brazil may affect near-term international revenue expansion.

Outlook Commentary

Telix expects strong continued growth in 2025, driven by:

  • Commercial expansion of Illuccix into new markets.
  • Regulatory approvals for new imaging agents (Gozellix, Zircaix, and Pixclara).
  • Advancement of key therapeutic trials, including TLX591 and TLX250 pivotal trials.
  • Infrastructure expansion, particularly through RLS integration and European GMP facility enhancements.

Guidance Statements

  • 2025 revenue guidance provided: AU$1.18B to AU$1.23B (US$770M to US$800M), reflecting expected continued strong financial performance.
  • Further investment in R&D, expected to rise 20%-25% compared to FY2024.
  • Key clinical readouts in H1 2025, including ProstACT GLOBAL interim results for TLX591.

Result vs. Market Expectations

  • Outperformed expectations with a 56% revenue increase, well above consensus estimates.
  • Strong profit growth and positive operating cash flow were well received by investors.

Market Positioning

  • Telix solidifies its position as a leader in radiopharmaceuticals, with a diverse and growing commercial portfolio.
  • The acquisition of RLS enhances its U.S. presence, reducing dependency on third-party distribution.
  • The Illuccix franchise continues to dominate prostate cancer imaging, with potential expansion into additional indications.

Share Price Performance Leading into the Report

  • TLX shares had fallen from their high leading into this report.
  • Entered ASX100 in 2024, reinforcing institutional interest and long-term growth potential.
  • 152% share price gain in 2024, making it one of the ASX’s best-performing biopharmaceutical stocks.

Telix Pharmacecuticals 12 month price chart with 3 EMA and volume


Disclaimer: This information is provided purely for educational purposes. It takes no account of an individual’s personal financial circumstances and hence can in no way constitute financial advice. The above data may be subject to errors or inconsistencies for which the author takes no liability. It is imperative that all investors do their own research or if they need advice, seek it from a qualified financial adviser.

Quick Take: FY2024 ASX:TLX

Quick Take: H1FY25 ASX:GMD

Genesis Minerals Limited – 2025 Interim Results Summary

Website: genesisminerals.com.au

Overview

Genesis Minerals Limited (ASX: GMD) reported strong financial and operational performance for the half-year ended 31 December 2024, with a 57% increase in revenue and a 161% rise in net profit after tax (NPAT). The company’s continued operational expansion and cost efficiencies have supported its strong profitability growth.

Financial Performance (Per Share Basis Where Applicable)

Metric H1 FY25 H1 FY24 (Restated) % Change
Revenue ($’000) 338,732 215,924 +57%
EBITDA ($’000) 153,649 54,639 +181%
Operating Cash Flow ($’000) 140,880 75,759 +86%
Earnings Before Tax ($’000) 84,841 22,885 +271%
Net Profit After Tax ($’000) 59,800 22,885 +161%
Net Tangible Assets per Share ($) 0.96 0.80 +20%
Basic EPS (cents) 5.49 2.28 +141%
Diluted EPS (cents) 5.30 2.19 +142%

Key Highlights and Concerns

  • Revenue growth of 57%, driven by higher gold production and improved gold prices.
  • Record gold sales of 86,527 ounces, with an average price of A$3,909/oz (up from A$2,984/oz in H1 FY24).
  • Higher production efficiency, supported by the restart of the Laverton Mill in October 2024 (six months ahead of plan).
  • Operational milestones achieved, including first stope production at Ulysses underground mine and commencement of mining at Hub open pit.
  • Improved cost management, with All-in Sustaining Cost (AISC) at A$2,383/oz, slightly higher than A$2,114/oz in H1 FY24 due to increased development activities.

Outlook Commentary

  • Upgraded FY25 production guidance to 190,000 – 210,000oz (previously 162,000 – 188,000oz), reflecting operational improvements.
  • Strong development pipeline, including Tower Hill open pit project, progressing on schedule with key approvals in place.
  • Expansion at Leonora and Laverton operations to enhance production capabilities.
  • Continued focus on sustainability initiatives, including climate risk assessments and community engagement programs.

Guidance Statements

  • Genesis Minerals remains focused on achieving its 5-Year “ASPIRE” plan, with an emphasis on sustainable growth.
  • Gold price hedging strategy in place, securing downside protection with zero-cost collars for 12,000 ounces per quarter from January 2025 to December 2025.
  • Further operational efficiencies and cost optimizations planned to support margin expansion.

Result vs. Market Expectations

  • The results exceeded market expectations, particularly in profitability and cash flow generation.
  • Higher-than-expected gold sales and production output positively impacted earnings.
  • Investors will closely monitor cost discipline and execution of growth projects.

Market Positioning

  • GMD’s share price was stable leading into the report, reflecting investor confidence in the company’s operational execution.
  • The stock remains well-positioned, supported by its strong financials and robust production pipeline.
  • Potential share price upside if cost efficiencies improve and development projects proceed as scheduled.

Disclaimer: This information is provided purely for educational purposes. It takes no account of an individual’s personal financial circumstances and hence can in no way constitute financial advice. The above data may be subject to errors or inconsistencies for which the author takes no liability. It is imperative that all investors do their own research or if they need advice, seek it from a qualified financial adviser.

Quick Take: H1FY25 ASX:GMD

Quick Take: H1FY25 ASX:SXE

Southern Cross Electrical Engineering (SCEE) – 2025 Interim Results Summary

Website: scee.com.au

Overview

Southern Cross Electrical Engineering (ASX: SXE) delivered a record first-half performance, with revenue up 55.5% and net profit after tax (NPAT) up 67.8%. The company continues to benefit from its diversified operations across infrastructure, commercial, and resources sectors, with strong momentum in data centres, electrification projects, and hospital developments.

Financial Performance (Per Share Basis Where Applicable)

Metric H1 FY25 H1 FY24 % Change
Revenue ($’000) 397,400 255,500 +55.5%
EBITDA ($’000) 27,100 17,100 +58.5%
Operating Cash Flow ($’000) 114,800 84,100 +36.5%
Earnings Before Tax ($’000) 23,300 13,900 +67.6%
Normalised EPS (cents) Not provided Not provided
Interim Dividend (cents per share) 2.5 1.0 +150%

Key Highlights and Concerns

  • Record revenue of $397.4M, driven by strong performance in infrastructure (63.3% of revenue).
  • Significant projects include Collie Battery Energy Storage System, Western Sydney International Airport, and major data centres.
  • Cash reserves at a record $114.8M, reinforcing a strong balance sheet with no debt.
  • Gross margin declined to 12.7% from 14.7%, impacted by legal costs related to WestConnex arbitration and a lower-margin project mix.
  • Strong order book of $670M, up 21.8% YoY.

Outlook Commentary

  • Electrification opportunities expanding, including battery storage, renewable energy, and energy-efficient infrastructure.
  • Strong data centre pipeline, with over $500M in tenders expected over the next two years.
  • Hospital sector growth, highlighted by the $60M Shellharbour Hospital contract.
  • Reiterated FY25 EBITDA guidance of at least $53M, with potential upside.

Guidance Statements

  • Fully franked interim dividend of 2.5 cents per share, up 150% YoY.
  • Management remains focused on acquisitions to enhance geographic reach and service offerings.
  • No debt, strong cash reserves, and increased bonding capacity support future expansion.

Result vs. Market Expectations

  • Results exceeded market expectations, with revenue and profit growth surpassing prior guidance.
  • The dividend increase signals confidence in cash flow stability and earnings visibility.
  • Investors will monitor gross margin improvements and resolution of the WestConnex arbitration.

Market Positioning

  • SCEE’s share price heading into the report was strong, reflecting positive investor sentiment.
  • The company remains well-positioned in the infrastructure, data centre, and electrification sectors, which continue to experience long-term tailwinds.
  • Continued execution on its growth strategy through acquisitions and organic expansion could drive further share price upside.

Disclaimer: This information is provided purely for educational purposes. It takes no account of an individual’s personal financial circumstances and hence can in no way constitute financial advice. The above data may be subject to errors or inconsistencies for which the author takes no liability. It is imperative that all investors do their own research or if they need advice, seek it from a qualified financial adviser.


Quick Take: H1FY25 ASX:SXE

Quick Take: H1FY25 ASX:SHA

SHAPE Australia – 2025 Interim Results Summary

Website: shape.com.au

Overview

SHAPE Australia Corporation Limited (ASX: SHA) delivered a strong first-half performance, with record revenue growth of 15.4% and a 25.6% increase in net profit after tax (NPAT). The company continues to expand its presence in non-office sectors, new geographic locations, and service offerings, positioning itself for sustained growth.

Financial Performance (Per Share Basis Where Applicable)

Metric 31 Dec 2024 31 Dec 2023 % Change
Revenue ($’000) 478,985 415,201 +15.4%
EBITDA ($’000) 14,789 12,239 +20.8%
Operating Cash Flow ($’000) 31,978 17,557 +82.1%
Earnings Before Tax ($’000) 13,656 10,846 +26.0%
Normalised EPS (cents) 11.36 8.99 +26.4%
Net Tangible Assets per Share (cents) 30.70 24.05 +27.7%

Key Highlights and Concerns

  • Record revenue of $505.6M (including associate revenue), supported by strong project wins of $531.5M.
  • Gross margin remained stable at 9.1%, indicating strong cost control.
  • Significant growth in non-office sectors, particularly Defence, Education, and Healthcare, contributing $168.1M in revenue.
  • Cash and marketable securities increased by 21.5% to $118.9M, enhancing financial flexibility.
  • Challenges in facade remediation projects, with a significant decline in project wins in this segment.

Outlook Commentary

  • SHAPE expects continued revenue growth in 2H FY25, supported by a strong order backlog of $516M.
  • Expansion in Gold Coast, Newcastle, and Tasmania is set to drive geographic growth.
  • The Defence sector rebound presents a strong pipeline of work opportunities.
  • The company is focused on enhancing its modular and design & build services to diversify revenue streams.

Guidance Statements

  • The company declared a fully franked interim dividend of 10.0 cents per share, up from 9.0 cents in the previous period.
  • Management remains optimistic about maintaining margin stability while growing revenue across diversified segments.
  • SHAPE anticipates strong client retention and repeat business, as reflected in its high Net Promoter Score (NPS) of +88.

Result vs. Market Expectations

  • The results were broadly in line with market expectations, with higher-than-expected profit growth.
  • Positive cash flow and increased dividend could support further share price appreciation.
  • Investors will likely focus on continued expansion in non-office sectors and improvement in new business segments.

Market Positioning

  • SHAPE’s share price heading into the report was steady, with limited volatility.
  • The market will be keen on management’s execution of its geographic and service expansion strategy to drive future earnings growth.

Disclaimer: This information is provided purely for educational purposes. It takes no account of an individual’s personal financial circumstances and hence can in no way constitute financial advice. The above data may be subject to errors or inconsistencies for which the author takes no liability. It is imperative that all investors do their own research or if they need advice, seek it from a qualified financial adviser.

Quick Take: H1FY25 ASX:SHA

Quick Take: H1FY25 ASX:MIN

Mineral Resources Limited – 1H25 Interim Results Summary

www.mineralresources.com.au

Overall Tone

Mineral Resources Limited (MIN) reported a significant net loss for 1H25, largely impacted by lower commodity prices, impairment charges, and foreign exchange losses. Despite these challenges, the Mining Services division delivered record earnings, benefiting from increased activity at Onslow Iron. The company has maintained strong liquidity but chose not to declare an interim dividend, prioritizing balance sheet flexibility.

Financial Summary

Metric 1H25 ($M) 1H24 ($M) % Change
Revenue 2,290 2,515 -9%
Underlying EBITDA 302 675 -55%
Operating Cash Flow (656) 624 N/A
Adjusted Earnings Before Tax (EBT) (1,154) 491 N/A
Normalised EPS (cents) (410.42) 281.98 N/A

Positive Surprises or Potential Concerns

  • Mining Services revenue grew 18% to $1,716M, with EBITDA up 49% to $379M.
  • Onslow Iron ramped up successfully, contributing $54M in EBITDA.
  • Iron ore and lithium segments struggled due to weaker prices and operational adjustments.
  • Bald Hill lithium project placed into care & maintenance (C&M) due to market conditions.
  • $352M in impairment charges and $232M foreign exchange losses weighed on results.

Debt Position

MinRes currently holds a substantial debt load, with total borrowings at $5.8B, including senior unsecured notes and revolving credit facilities. The debt profile consists of long-tenor instruments, with no maturities until mid-2027, providing some financial flexibility. However, foreign exchange losses of $331M have negatively impacted the company’s net debt position, highlighting risks associated with currency fluctuations.

Outlook Commentary

MinRes expects Mining Services to continue expanding, supported by new contract wins and Onslow Iron ramp-up. Iron ore performance depends on price recovery, while lithium operations will be closely managed amid weak market conditions. The company is evaluating the potential sale of Yilgarn Hub assets.

Guidance Statements

The company maintains a cautious outlook, focusing on liquidity preservation as Onslow Iron nears completion. Cost-cutting measures in lithium operations are expected to improve financials in 2H25. Capital expenditures will be heavily weighted toward completing Onslow Iron.

Results vs Market Expectations

The reported loss was significantly below expectations, as analysts anticipated weaker earnings but not to this extent. The market had priced in a challenging environment for lithium and iron ore, but the extent of impairments and foreign exchange losses will likely surprise investors. The decision to not declare an interim dividend may also disappoint some shareholders.

Market Positioning

  • Share price performance leading into the report: Weak, reflecting softer lithium and iron ore prices.
  • 1-week movement: Down, likely in anticipation of a poor earnings result.
  • 52-week high comparison: The stock remains well below its 52-week high, reflecting the challenging commodity market and financial pressures.


Disclaimer: This information is provided purely for educational purposes. It takes no account of an individual’s personal financial circumstances and hence can in no way constitute financial advice. The above data may be subject to errors or inconsistencies for which the author takes no liability. It is imperative that all investors do their own research or, if they need advice, seek it from a qualified financial adviser.

Quick Take: H1FY25 ASX:MIN

Quick Take: H1FY25 ASX:HUM

Humm Group Limited – 2025 Half Year Results Summary

Website: Humm Group

Overall Tone

Humm Group delivered strong financial growth in 1H25, with a significant turnaround in statutory profit and cash profit. The company benefitted from higher net interest income, improved cost efficiency, and reduced credit impairment charges. Despite some restructuring costs and ongoing operational challenges, Humm is well-positioned for further growth in commercial lending and Point of Sale Payment Plans (PosPP).

Financial Results Summary

Metric 1H25 1H24 YoY Change
Revenue (Interest & Fee Income) $336.0M $298.7M +12.5%
Net Interest Income (NII) $130.6M $122.7M +6.4%
Statutory Profit After Tax $27.3M $(6.0)M +555%
Cash Profit After Tax $29.8M $13.6M +119%
Credit Impairment Charge $33.8M $48.0M -30%
Operating Expenses $85.1M $97.4M -13%
ROCE (Return on Cash Equity) 10.9% 4.9% +600bps
Assets Under Management (AUM) $5.32B $4.65B +14%
Interim Dividend Per Share 1.25c 0.75c +67%

Positive Surprises & Potential Concerns

  • Positive: Statutory profit rebounded strongly from a loss in 1H24 to a $27.3M profit.
  • Positive: Credit impairment charges fell 30%, reflecting improved lending quality and lower loss rates.
  • Positive: Cost management initiatives delivered $15.6M in savings, driving a 13% reduction in operating expenses.
  • Concern: Net interest margin (NIM) remained flat at 5.5%, as funding costs increased.
  • Concern: Ongoing restructuring and transformation costs may weigh on future profitability.

Outlook Commentary

  • Commercial lending to remain a key growth driver, supported by strong demand from SMEs in Australia and New Zealand.
  • PosPP expansion into UK, Canada, and Ireland is expected to contribute positively in 2H25.
  • Continued cost efficiency focus to support margin expansion and profitability improvements.

Guidance Statements

  • Revenue Growth: Expected to be driven by volume expansion across core lending and PosPP.
  • Profitability: Margins to remain stable, with cost savings offsetting any increase in funding costs.
  • Dividend Growth: Payout ratio expected to be maintained, reflecting confidence in future earnings.

Result vs. Market Expectations

  • Stronger-than-expected profit turnaround, exceeding analyst forecasts.
  • Revenue growth aligned with expectations, but cost savings and lower impairments outperformed.
  • Dividend increase of 67% was a positive surprise, reflecting confidence in cash flow sustainability.

Market Positioning

  • Share price remained stable leading into results, as investors anticipated a profit rebound.
  • Stock trading near mid-range of 52-week performance, with upside potential if growth initiatives continue delivering.
  • Humm Group is strengthening its position in non-bank lending, with expansion plans supporting long-term growth.
Quick Take: H1FY25 ASX:HUM - 12 month daily price chart with 3 EMA and volume indicators

Disclaimer: This information is provided purely for educational purposes. It takes no account of an individual’s personal financial circumstances and hence can in no way constitute financial advice. The above data may be subject to errors or inconsistencies for which the author takes no liability. It is imperative that all investors do their own research or if they need advice, seek it from a qualified financial adviser.

Quick Take: H1FY25 ASX:HUM

Quick Take: 2024AGM ASX:SHV

Select Harvests Limited – 2024 Annual General Meeting Summary

Website: Select Harvests

Overall Tone

Select Harvests Limited (SHV) reported a significant turnaround in financial performance, achieving a positive net profit after tax (NPAT) of $1.5 million, compared to a substantial loss in the previous year. The company’s record almond crop and improving pricing environment contributed to the recovery. Operational efficiencies and strategic transformation initiatives continue to strengthen the company’s future outlook.

Financial Results Summary

Metric FY24 FY23 YoY Change
Revenue $337M
Net Profit After Tax (NPAT) $1.5M -$114.5M +116M
Operating Cash Flow $21.3M $3.3M +545%
Total Almond Crop 29,527MT 19,771MT +49.3%
Average Almond Price $7.69/kg
Net Debt $162.3M
Gearing Ratio 33.8% 29% (post-capital raise)

Positive Surprises & Potential Concerns

  • Positive: Record almond crop of 29,527MT, exceeding expectations and improving margins.
  • Positive: Debt reduction of $71.3M, significantly strengthening the balance sheet.
  • Concern: Ongoing challenges in NSW operations, with persistent wet seasons affecting yields.
  • Concern: Inflationary cost pressures, particularly in labor, fertilizer, and water management.

Outlook Commentary

  • Strong global almond demand expected to drive further price increases, with forecasts around $9.20/kg.
  • Cost optimization measures to continue, focusing on labor, procurement, and automation initiatives.
  • Investment in processing capacity (Project Optimus) to enhance efficiency and increase third-party processing volumes.

Strategic Transformation Initiatives

  • Yield and Quality Improvements: Investments in better pollination, harvest techniques, and water management.
  • Cost Management: Reducing operational expenses while maintaining productivity.
  • Market Expansion: Increased focus on China and India, capitalizing on premium product demand.
  • Processing Expansion: Project Optimus to increase capacity by 10,000MT by 2026.

Result vs. Market Expectations

  • Stronger-than-expected recovery, with NPAT turning positive after a difficult prior year.
  • Higher-than-expected almond prices, driven by lower US stockpiles and strong global demand.
  • Operational improvements progressing well, with cost reductions exceeding initial targets.

Market Positioning

  • Share price leading into AGM showed positive momentum, reflecting renewed investor confidence.
  • Trading near mid-range of its 52-week performance, with further upside potential tied to higher almond pricing.
  • Strategic focus on cost control and processing efficiency, positioning SHV as a low-cost, high-quality almond producer.

Disclaimer: This information is provided purely for educational purposes. It takes no account of an individual’s personal financial circumstances and hence can in no way constitute financial advice. The above data may be subject to errors or inconsistencies for which the author takes no liability. It is imperative that all investors do their own research or if they need advice, seek it from a qualified financial adviser.

Quick Take: 2024AGM ASX:SHV

Quick Take: H1FY25 ASX:HUB

HUB24 Limited – 2025 Half Year Results Summary

Website: HUB24

Overall Tone

HUB24 Limited reported strong financial results for the first half of FY25, driven by robust platform net inflows and continued expansion in funds under administration (FUA). The company achieved record revenue and profitability, with significant increases in net profit and earnings per share. Strategic acquisitions and product innovations have further strengthened HUB24’s market position in the wealth management technology sector.

Financial Results Summary

Metric Dec-24 Dec-23 YoY Change
Revenue $195.2M $156.7M +25%
Underlying EBITDA $77.6M $55.0M +41%
Net Profit After Tax (NPAT) $36.5M $21.5M +75%
Earnings Per Share (EPS) 40.92c 26.53c +54%
Interim Dividend Per Share 24.0c 18.5c +30%
Net Tangible Assets Per Share $1.09 $0.87 +25%

Positive Surprises & Potential Concerns

  • Positive: Platform net inflows of $9.5B (+31%), boosting total FUA to $120.9B (+33%).
  • Positive: Strong growth in platform revenue (+29%), reflecting increasing adviser adoption.
  • Concern: Higher operating expenses (+16% YoY), mainly due to strategic investments and acquisitions.
  • Concern: No major cost savings initiatives disclosed, which could impact margins in a high-growth environment.

Outlook Commentary

  • Continued growth expected in platform FUA, supported by adviser onboarding and product innovation.
  • Expansion in tech solutions revenue, leveraging Class and HUBconnect platforms.
  • Operational efficiencies and cost control measures to help sustain profit margin improvements.

Guidance Statements

  • Revenue Growth: Expected to remain strong, with double-digit growth anticipated in 2H25.
  • Profitability: Margins expected to improve, benefiting from scale efficiencies and operational leverage.
  • Dividend Policy: Maintaining 40-60% payout ratio, with a focus on sustainable shareholder returns.

Result vs. Market Expectations

  • Revenue and profit exceeded expectations, reflecting higher platform net inflows and strong cost discipline.
  • Dividend increase (24.0c per share) was ahead of analyst estimates, reinforcing HUB24’s confidence in its growth outlook.
  • Some concerns about rising costs, though market reaction remained positive given the overall earnings momentum.

Market Positioning

  • Share price performance leading into results was strong, reflecting positive sentiment around HUB24’s market leadership.
  • Trading near 52-week highs, with investors recognizing scalability and growth potential in the wealth tech sector.
  • Continued investment in technology and acquisitions, positioning HUB24 as a leading provider in the financial services platform space.

This information is provided purely for educational purposes. It takes no account of an individual’s personal financial circumstances and hence can in no way constitute financial advice. The above data may be subject to errors or inconsistencies for which the author takes no liability. It is imperative that all investors do their own research or if they need advice, seek it from a qualified financial adviser.

Quick Take: H1FY25 ASX:HUB

Quick Take: H1FY25 ASX:XRF

XRF Scientific Limited – 2025 Half Year Results Summary

Website: XRF Scientific

Overall Tone

XRF Scientific Limited delivered record half-year results, showcasing strong revenue and profit growth driven by increased sales of consumables and equipment. The company benefitted from global mining sector activity, improved operational efficiencies, and successful acquisitions. Despite a flat revenue performance, profitability improved, underpinned by higher margins and cost efficiencies.

Financial Results Summary

Metric Dec-24 Dec-23 YoY Change
Revenue $28.7M $28.6M +0.3%
Earnings Before Interest & Tax (EBIT) $6.91M $6.31M +9.5%
Net Profit After Tax (NPAT) $5.01M $4.48M +11.8%
Net Tangible Assets Per Share $0.26 $0.25 +4.0%
Earnings Per Share (EPS) 3.6c 3.3c +9.1%
Interim Dividend Per Share Nil Nil

Positive Surprises & Potential Concerns

  • Positive: EBIT and NPAT growth outpaced revenue growth, indicating strong cost control and operational efficiency.
  • Positive: Record sales in consumables division, driven by mining and industrial demand.
  • Concern: Revenue growth was modest, reflecting a mixed performance across business segments.
  • Concern: No interim dividend declared, despite strong earnings growth.

Outlook Commentary

  • Strong demand for consumables and capital equipment expected to drive revenue growth in 2H25.
  • Recent acquisitions of Orbis Mining and Labfit to contribute positively to future earnings.
  • Ongoing investment in product innovation, with new xrTGA instrument expected to be a key revenue driver.

Guidance Statements

  • Revenue Growth: Expected to accelerate in 2H25, led by international expansion and new product sales.
  • Profitability: Margins expected to remain strong, benefiting from cost efficiencies and product mix improvements.
  • Cash Flow Management: Continued focus on maintaining a strong balance sheet and funding growth initiatives.

Result vs. Market Expectations

  • EBIT and NPAT exceeded analyst expectations, driven by higher gross margins and strong consumables demand.
  • Revenue slightly below expectations, as some capital equipment sales were delayed.
  • No interim dividend, which was in line with prior company policy of paying a single annual dividend.

Market Positioning

  • Share price has been stable leading into results, reflecting investor confidence in earnings resilience.
  • Stock is trading near its 52-week high, supported by strong profitability trends and strategic acquisitions.
  • Positioned as a leader in analytical lab solutions, with growing international footprint and strong mining sector exposure.

Disclaimer: This information is provided purely for educational purposes. It takes no account of an individual’s personal financial circumstances and hence can in no way constitute financial advice. The above data may be subject to errors or inconsistencies for which the author takes no liability. It is imperative that all investors do their own research or if they need advice, seek it from a qualified financial adviser.

Quick Take: H1FY25 ASX:XRF

Quick Take: H1FY25 ASX:MLG

MLG Oz Limited – 2025 Half Year Results Summary

Website: MLG Oz

Overall Tone

MLG Oz Limited reported strong revenue growth for the half-year, driven by increased activity in the gold industry and haulage services. However, profitability declined significantly due to lower crushing and screening revenue, higher depreciation from recent capital investments, and delays in new projects. The company remains optimistic about the second half, with new projects expected to improve margins.

Financial Results Summary

Metric Dec-24 Dec-23 YoY Change
Revenue $272.9M $226.4M +20.5%
Net Profit After Tax $4.08M $7.12M -42.7%
EBITDA $29.3M $28.5M +2.8%
Operating Cash Flow $14.7M $24.6M -40.2%
Net Tangible Assets Per Share $1.02 $0.94 +8.5%

Positive Surprises & Potential Concerns

  • Positive: Revenue increased 20.5%, supported by high demand in the gold sector and haulage services.
  • Positive: Pricing adjustments aligned with inflation, ensuring revenue resilience.
  • Concern: Net profit dropped 42.7% due to lower crushing and screening revenue and higher depreciation costs.
  • Concern: Delays in new projects led to underutilization of fleet and operational inefficiencies.

Outlook Commentary

  • New projects in H2 FY25 are expected to boost revenue and improve profit margins.
  • Continued demand in mining services, with expanded scope in haulage and road construction.
  • Operational efficiencies to be optimized, focusing on deploying the fleet effectively and increasing contract coverage for fixed costs.

Guidance Statements

  • Revenue Growth: Expected to remain strong, driven by ongoing contract expansions and new project commencements.
  • Profitability: Margins expected to improve in 2H FY25, supported by fleet deployment and cost controls.
  • Cash Flow Management: Focus on optimizing working capital to sustain healthy cash flow levels.

Result vs. Market Expectations

  • Revenue growth exceeded expectations, reflecting continued strength in haulage and mining services.
  • Net profit below expectations, due to higher costs and project delays.
  • No interim dividend declared, consistent with expectations as MLG prioritizes reinvestment in growth initiatives.

Market Positioning

  • Share price performance leading into results was mixed, reflecting strong revenue growth but margin pressures.
  • Trading within mid-range of its 52-week high, as investors assess profitability concerns against long-term growth potential.
  • Well-positioned for long-term growth, supported by strong industry demand, strategic capital investments, and expanding project pipeline.

Disclaimer: This information is provided purely for educational purposes. It takes no account of an individual’s personal financial circumstances and hence can in no way constitute financial advice. The above data may be subject to errors or inconsistencies for which the author takes no liability. It is imperative that all investors do their own research or if they need advice, seek it from a qualified financial adviser.


Quick Take: H1FY25 ASX:MLG

Quick Take: H1FY25 ASX:ARB

ARB Corporation Limited – 2025 Half Year Results Summary

Website: ARB Corporation

Overall Tone

ARB Corporation reported modest revenue growth for the half-year, driven by strong export sales and strategic acquisitions. However, profitability was slightly lower due to increased expenses related to acquisitions and operational expansions. Despite a challenging economic environment, ARB remains well-positioned with a strong balance sheet and strategic growth initiatives.

Financial Results Summary

Metric Dec-24 Dec-23 YoY Change
Sales Revenue $361.7M $341.5M +5.9%
Total Revenue $366.7M $342.7M +7.0%
Profit Before Tax $70.3M $70.8M -0.7%
Net Profit After Tax $50.95M $51.27M -0.6%
Interim Dividend Per Share 34.0c 34.0c 0.0%
Net Tangible Assets Per Share $8.08 $7.12 +13.5%

Positive Surprises & Potential Concerns

  • Positive: Export sales grew 15.4% YoY, particularly in the U.S. market (+18.7%), benefiting from strong demand and partnerships.
  • Positive: ARB expanded its footprint with two new retail store acquisitions in Toowoomba, QLD, and Christchurch, NZ.
  • Concern: Operating profit declined 4.6% (excl. one-off adjustments), primarily due to acquisition costs and higher operating expenses.
  • Concern: Weaker Australian dollar and inflationary pressures impacted margins, requiring pricing adjustments.

Outlook Commentary

  • Continued growth expected in exports and aftermarket sales, particularly in the U.S. through ARB’s expanded ORW/4WP retail network.
  • Ongoing product innovation with new launches, including the Stealth Bar for Toyota LC70 and enhancements to the Earth Camper.
  • Cost control remains a focus, with efficiency improvements and pricing strategies to offset currency impacts and inflationary pressures.

Guidance Statements

  • Sales Growth: Expected to remain in the mid-single-digit range in 2H FY25.
  • Profitability: Anticipated to improve as acquisition-related costs subside and new investments begin contributing.
  • Cash Flow Management: Prioritizing inventory optimization and cost efficiencies to sustain a strong balance sheet.

Result vs. Market Expectations

  • Revenue growth aligned with market expectations, with export strength offsetting domestic market headwinds.
  • Profit slightly below expectations, largely due to one-time acquisition costs and increased employee expenses.
  • Dividend maintained at 34.0c per share, signaling confidence in long-term financial stability.

Market Positioning

  • Share price remained stable leading into results, reflecting confidence in export growth and strategic investments.
  • Stock trading near mid-range of its 52-week range, as investors weigh short-term cost pressures against long-term growth potential.
  • Long-term growth remains intact, driven by strong product innovation, international expansion, and strategic acquisitions.

Meta Description:


Disclaimer: This information is provided purely for educational purposes. It takes no account of an individual’s personal financial circumstances and hence can in no way constitute financial advice. The above data may be subject to errors or inconsistencies for which the author takes no liability. It is imperative that all investors do their own research or if they need advice, seek it from a qualified financial adviser.


Quick Take: H1FY25 ASX:ARB

Quick Take: H1FY25 ASX:BIO

Biome Australia Limited – 2025 Half Year Results Summary

Website: Biome Australia

Overall Tone

Biome Australia Limited reported a strong half-year performance, achieving maiden net profitability and continued revenue growth. The company recorded two consecutive quarters of positive EBITDA, driven by robust sales in its Activated Probiotics range. With a solid financial position and expanding international presence, Biome is well-positioned for future growth.

Financial Results Summary

Metric Dec-24 Dec-23 YoY Change
Revenue $8.86M $6.02M +47.4%
Statutory Net Profit After Tax $433K -$1.53M +128.4%
Gross Margin 61.0% 60.2% +0.8pp
Operating Cash Outflow -$1.12M -$654K -71%
Net Tangible Assets Per Share 2.00c 1.01c +98%

Positive Surprises & Potential Concerns

  • Positive: Strong revenue growth (+47.4% YoY) driven by Activated Probiotics and international expansion.
  • Positive: First-ever net profit, reflecting improved cost control and stronger gross margins.
  • Concern: Operating cash outflows, mainly due to bonus and long-term incentive (LTI) payments.
  • Concern: Inventory levels increased, potentially reflecting higher stock requirements for growth or a slowdown in demand.

Outlook Commentary

  • Continued growth expected, with expansion into Canada, UK, Ireland, and New Zealand showing early promise.
  • Ongoing investment in distribution footprint, with Australian points of sale increasing from 5,000 to 6,000.
  • Further margin expansion anticipated as economies of scale improve and operational efficiencies are realized.

Guidance Statements

  • Revenue Growth: Expected to maintain strong double-digit growth in upcoming periods.
  • Profitability: Focus on sustained positive EBITDA and net profit, while reinvesting in international expansion.
  • Cash Flow Management: Aiming to reduce operating cash outflows, ensuring financial sustainability.

Result vs. Market Expectations

  • Revenue growth exceeded expectations, reflecting strong demand and effective distribution expansion.
  • Profitability milestone surpassed estimates, highlighting the effectiveness of cost controls and operational efficiencies.
  • No dividends declared, in line with expectations as the company prioritizes reinvestment for growth.

Market Positioning

  • Share price performance leading into results was stable, reflecting confidence in Biome’s growth trajectory.
  • Trading near 52-week highs, supported by strong financial results and expanding market reach.
  • Positioned as a high-growth health and wellness company, with a differentiated product offering and increasing global presence.

Disclaimer: This information is provided purely for educational purposes. It takes no account of an individual’s personal financial circumstances and hence can in no way constitute financial advice. The above data may be subject to errors or inconsistencies for which the author takes no liability. It is imperative that all investors do their own research or if they need advice, seek it from a qualified financial adviser.

Quick Take: H1FY25 ASX:JDO

Judo Capital Holdings – 2025 Half Year Results Summary

Website: Judo Bank

Overall Tone

Judo Capital Holdings delivered solid financial results for the six months ending 31 December 2024, demonstrating continued growth in its SME lending franchise. While statutory profits declined year-over-year due to higher costs and loan impairments, underlying profit before tax increased by 33% due to loan book expansion and prudent cost management. The company remains well-capitalized with strong liquidity and improving efficiency metrics.

Financial Results Summary

Metric Dec-24 Jun-24 Dec-23 HoH Change YoY Change
Revenue (Statutory Operating Income) $201M $201M 0% 0%
Net Interest Income $193.0M $190.8M $195.2M +1% -1%
Statutory Net Profit After Tax $40.9M $24.0M $45.9M +70% -11%
Adjusted EBITDA Not disclosed
Operating Cash Flow $(74.3)M $370.2M $271.9M
Adjusted Earnings Before Tax (EBT) $56.7M $42.7M $67.4M +33% -16%
Normalised EPS 3.7c 2.2c 4.1c +68% -10%
Net Tangible Assets Per Share $1.39 $1.36 +2.2%

Positive Surprises & Potential Concerns

  • Positive: Strong loan book growth (+9% HoH to $11.6B), well above system growth, supported by regional expansion and recruitment of relationship bankers.
  • Positive: Credit impairment expenses decreased significantly (-33% HoH), reflecting better risk management and portfolio performance.
  • Concern: Net Interest Margin (NIM) declined by 4bps to 2.81%, primarily due to the impact of refinancing the Term Funding Facility (TFF).
  • Concern: Cost-to-Income Ratio (CTI) increased to 57.4% (up from 56.3% in Jun-24), driven by higher employee benefits expenses and IT costs.

Outlook Commentary

  • The business lending market remains strong, particularly for SMEs, but some sectors face challenges due to higher interest rates and economic uncertainty.
  • Judo expects to demonstrate clear operating leverage from 2H25, with an improving NIM and controlled expenses.
  • Growth is expected to continue, supported by regional expansion and ongoing investment in customer relationships.

Guidance Statements

  • Loan Book (GLA): Expected to grow to $12.7B – $13.0B by FY25.
  • Net Interest Margin (NIM): Gradual improvement expected in 2H25, targeting 3% by June 2025.
  • Cost-to-Income Ratio (CTI): Expected to remain broadly stable, with an improvement in 2H25.
  • Profitability (PBT/ROE): Targeting 15% growth in PBT compared to FY24, with a low- to mid-teens ROE.

Result vs. Market Expectations

  • Judo’s profit beat expectations due to lower-than-expected impairment expenses and stronger loan growth.
  • The decline in NIM and the increase in CTI were concerns but were largely expected by analysts.
  • No dividends were declared, which was in line with the company’s strategy of reinvesting profits into growth.

Market Positioning

  • Leading up to the results, Judo’s share price showed strength, reflecting investor confidence in its loan book growth and risk management.
  • The stock was trading closer to its 52-week high, indicating positive sentiment despite NIM pressures.
  • The company remains well-capitalized with strong liquidity, positioning it for further growth in the SME banking sector.

Disclaimer: This information is provided purely for educational purposes. It takes no account of an individual’s personal financial circumstances and hence can in no way constitute financial advice. The above data may be subject to errors or inconsistencies for which the author takes no liability. It is imperative that all investors do their own research or if they need advice, seek it from a qualified financial adviser.

Quick Take: H1FY25 ASX:JDO

Quick Take: H1FY25 ASX:MND

Monadelphous – 2025 Half-Year Results Summary

Monadelphous Group Limited

Overall Tone

Monadelphous delivered a solid half-year result, marked by revenue growth and a significant increase in profitability. Strong demand in maintenance and engineering construction services, combined with a well-managed balance sheet and contract wins, positions the company well for continued expansion. The outlook remains positive, driven by a robust project pipeline across resources, energy, and renewables.

Financial Results

Financial Metric 1H 2025 Change vs 1H 2024
Revenue $1.051 billion +4.2%
Adjusted EBITDA $79.8 million +30.2%
Operating Cash Flow $93.1 million Strong cash flow conversion of 145%
Adjusted Earnings Before Tax (EBT) $61.7 million +37.9%
Normalised EPS 43.3 cents
Interim Dividend 33 cents (fully franked)

Outlook Commentary

The resources and energy sectors are expected to remain strong over the long term, supported by sustained global economic growth and decarbonisation efforts. Investment in renewables and energy transition projects is increasing, providing significant future opportunities for Monadelphous. Labour shortages continue to present a challenge, but the company is mitigating this through workforce development and retention initiatives.

Guidance Statements

Monadelphous anticipates high single-digit revenue growth for FY25, supported by a strong backlog of projects. Operating margins are expected to improve as the company focuses on efficiency and risk management. The balance sheet remains strong, providing flexibility for strategic acquisitions and expansions.

Results vs Market Expectations

Monadelphous’ results were in line with market guidance, with revenue growth and profitability exceeding some analysts’ expectations. The strong EBITDA performance, driven by operational improvements and non-operating gains, was a key highlight. Investors reacted positively, particularly to the robust cash flow and dividend declaration.

Market Positioning

Leading up to the results announcement, Monadelphous’ share price showed resilience, reflecting positive sentiment. The stock has seen moderate gains in the past week but remains below its 52-week high. Investors are likely to focus on the company’s execution of its project pipeline and ability to sustain margins amid labour and supply chain constraints.


Disclaimer: This information is provided purely for educational purposes. It takes no account of an individual’s personal financial circumstances and hence can in no way constitute financial advice. The above data may be subject to errors or inconsistencies for which the author takes no liability. It is imperative that all investors do their own research or if they need advice, seek it from a qualified financial adviser.

Quick Take: H1FY25 ASX:MND

Quick Take: H1FY25 ASX:CVL

Civmec Limited – 2024 Half-Year Results Summary

Civmec Limited

Overall Tone

Civmec reported steady revenue growth, but profitability declined due to lower gross margins and increased administrative expenses. The company’s order book remains strong, supported by ongoing projects in the infrastructure, resources, and defence sectors. Liquidity remains robust, despite a notable drop in cash reserves.

Financial Results (per share where applicable)

Metric HY 2024 HY 2023 % Change
Revenue from ordinary activities ($m) 502.9 492.3 +2.1%
Gross Profit ($m) 55.8 60.3 -7.5%
Gross Profit Margin (%) 11.1% 12.2% -1.1pp
Statutory Profit Before Tax ($m) 37.5 45.1 -16.9%
Statutory Profit After Tax ($m) 26.5 31.9 -16.9%
Net Operating Cash Flow ($m) -22.7 99.4 N/A
Basic EPS (cents per share) 5.21 6.29 -17.2%
Interim Dividend (cents per share, franked at 100%) 2.5 2.5 Unchanged

Strategic Initiatives

Civmec continues to expand its presence in the defence sector with progress on the Luerssen Australia acquisition. The company is also focusing on improving efficiency in its shipbuilding and infrastructure divisions. Investments in automation and digital transformation aim to enhance long-term operational resilience.

Outlook Commentary

Civmec expects continued revenue growth driven by strong demand in the resources and infrastructure sectors. The company remains focused on project execution and cost management to mitigate margin pressures. Defence-related projects are expected to be a key driver of future earnings.

Guidance Statements

Management anticipates stable revenue with a focus on operational efficiencies to restore profit margins. Cash flow management remains a priority, and further investment in key growth areas such as shipbuilding and automation is planned. The company is optimistic about securing additional contracts in the coming quarters.

Results vs. Market Expectations

Revenue growth was in line with expectations, but profitability declined more than anticipated due to lower gross margins. The decline in cash flow was notable and may raise concerns among investors. The market may react cautiously until profitability trends improve.

Market Positioning

Civmec’s share price has been relatively stable leading up to the results but remains below its 52-week high. Investor sentiment may be impacted by the decline in profit margins and cash reserves, though the company’s strong order book provides long-term confidence.


Disclaimer: This information is provided purely for educational purposes. It takes no account of an individual’s personal financial circumstances and hence can in no way constitute financial advice. The above data may be subject to errors or inconsistencies for which the author takes no liability. It is imperative that all investors do their own research or if they need advice, seek it from a qualified financial adviser.

Quick Take: H1FY25 ASX:CVL