Category: Reports

Quick Take: FY2024 ASX:AVH

AVITA Medical – 2024 Full-Year Results Summary

Website: AVITA Medical

Overall Tone

AVITA Medical delivered strong revenue growth in FY24, reflecting increased adoption of RECELL® technology across multiple treatment areas. While the company reported a larger net loss, key strategic milestones, expanded market approvals, and a revised financial outlook remain positives. The company’s ability to sustain its momentum in regenerative medicine positions it well for future growth.

Financial Results Summary

Metric FY 2024 FY 2023 YoY Change
Revenue from Ordinary Activities ($M) $64.3M $50.1M +28%
Other Income ($M) $0.16M $9.91M -98%
Statutory Net Loss ($M) $(61.8)M $(35.4)M -75%
Total Comprehensive Loss ($M) $(61.9)M $(44.9)M -38%
Net Operating Cash Flow ($M) $(48.9)M $(38.0)M -28.7%
Net Tangible Asset Backing per Share ($) $(0.17) $1.82 N/A
Dividend N/A N/A No dividend declared

Positive Surprises & Potential Concerns

  • Positive: Robust revenue growth (+28%), driven by broader clinical adoption and expanded market penetration.
  • Positive: Regulatory advancements, particularly in full-thickness skin defects and vitiligo indications.
  • Positive: Strengthened financial position, securing amendments to its credit agreement that provide more flexibility for future growth.
  • Concern: Net loss widened, primarily due to higher R&D and commercialization expenses as AVITA scales operations.
  • Concern: Liquidity and cash burn remain areas to watch, though the company asserts it has sufficient funding for the next 12 months.

Outlook Commentary

  • Continued revenue growth expected, fueled by broader U.S. and international adoption of RECELL®.
  • Regulatory progress in new indications (vitiligo, trauma, chronic wounds) expected to unlock additional revenue streams.
  • Operational efficiencies and pricing strategies to improve gross margins over time.

Guidance Statements

  • Revenue: Expected to exceed $73M in Q1 2025, with sequential growth through the year.
  • Cash Management: Continued focus on reducing burn rate, optimizing costs, and securing non-dilutive funding opportunities.
  • Market Expansion: Further penetration in Asia-Pacific and European markets, leveraging new regulatory approvals.

Result vs. Market Expectations

  • Revenue growth met expectations, but the net loss widened significantly, which may disappoint investors.
  • The company’s expansion strategy and increasing market penetration are positive long-term factors, but short-term financial performance remains under scrutiny.

Market Positioning

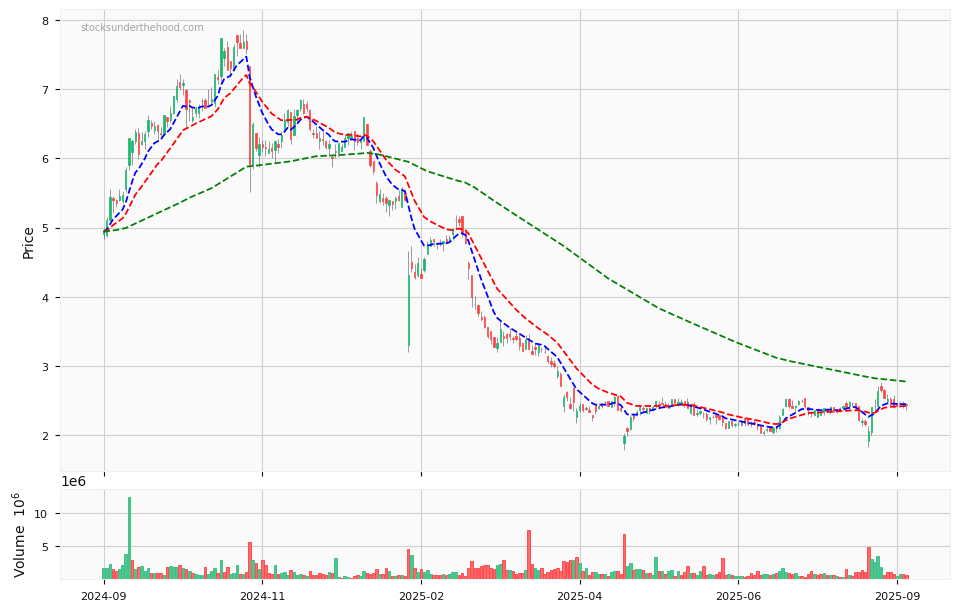
  • AVITA’s share price has seen volatility leading into the results, reflecting both optimism about revenue growth and concerns over rising losses.
  • The stock remains well below its 52-week high, signalling cautious investor sentiment amid ongoing operational challenges.

Disclaimer: This information is provided purely for educational purposes. It takes no account of an individual’s personal financial circumstances and hence can in no way constitute financial advice. The above data may be subject to errors or inconsistencies for which the author takes no liability. It is imperative that all investors do their own research or if they need advice, seek it from a qualified financial adviser.

Quick Take: FY2024 ASX:AVH

Quick Take: H1FY25 ASX:LGI

LGI – 2025 Half-Year Results Summary

LGI Limited

Overall Tone

LGI delivered solid revenue growth and stable EBITDA, but profitability was impacted by increased borrowing costs. The company continued to expand its biogas capture and renewable energy generation capabilities, reinforcing its market position in carbon abatement and clean energy solutions.

Financial Results (per share where applicable)

Metric HY 2025 HY 2024 % Change
Revenue from ordinary activities ($m) 16.91 15.85 +6.7%
Statutory EBITDA ($m) 7.26 7.05 +3.0%
Statutory Profit Before Tax ($m) 3.22 4.14 -22.2%
Statutory Profit After Tax ($m) 2.40 3.10 -22.0%
Net Operating Cash Flow ($m) 6.26 7.61 -17.7%
Normalised EPS (cents per share) 2.7 3.5 -22.9%
Interim Dividend (cents per share, franked at 25%) 1.2 1.2 Unchanged

Outlook Commentary

LGI remains focused on increasing its biogas capture and renewable energy generation. Expansion efforts, including the Canberra and Eastern Creek power stations, are expected to drive future revenue growth. However, higher financing costs and infrastructure investment may weigh on short-term profitability.

Guidance Statements

LGI anticipates continued growth in biogas capture and carbon credit generation, with an emphasis on infrastructure expansion. While profitability pressures exist, the long-term strategy of enhancing landfill gas recovery and renewable power production remains intact. The company aims to improve cash flow conversion and maintain dividend consistency.

Results vs. Market Expectations

Revenue growth met expectations, but the decline in profit due to higher interest expenses may have disappointed investors. The stability in EBITDA suggests operational resilience, yet market sentiment may be affected by weaker net income figures.

Market Positioning

LGI’s share price has remained relatively stable, trading within a range leading into the results announcement. The stock is positioned moderately below its 52-week high, reflecting both investor confidence in its growth strategy and concerns over profitability headwinds.


Disclaimer: This information is provided purely for educational purposes. It takes no account of an individual’s personal financial circumstances and hence can in no way constitute financial advice. The above data may be subject to errors or inconsistencies for which the author takes no liability. It is imperative that all investors do their own research or if they need advice, seek it from a qualified financial adviser.

Quick Take: H1FY25 ASX:LGI

Quick Take: FY2024 ASX:AMP

AMP – 2024 Full-Year Results Summary

AMP Limited

Overall Tone

AMP reported mixed results for the full year 2024, showing revenue growth but a significant decline in statutory profit. While cost management and capital returns were strong, the company faced challenges in maintaining profitability, particularly in its banking operations.

Financial Results (per share where applicable)

Metric FY 2024 FY 2023 % Change
Revenue from ordinary activities ($m) 2,869 2,732 +5%
Underlying NPAT ($m) 236 205 +15.1%
Statutory NPAT ($m) 150 265 -43%
Adjusted EBITDA ($m) Not explicitly reported
Operating Cash Flows ($m) Not explicitly reported
Adjusted Earnings Before Tax (EBT) ($m) Not explicitly reported
Normalised EPS (cents per share) 9.0 7.2 +25%
Final Dividend (cents per share, franked at 20%) 1.0 2.0 -50%

Outlook Commentary

AMP is positioning itself as a retirement specialist, with strong growth in its wealth management and superannuation businesses. The company remains focused on cost discipline, enhancing its North platform, and leveraging AI and digital banking to drive future growth. The economic environment remains challenging, particularly in the banking sector.

Guidance Statements

AMP expects continued positive momentum in its wealth businesses, with an emphasis on managed portfolios and retirement solutions. Cost control remains a priority, and further investment in digital banking is anticipated to support future revenue growth. The company has completed its capital management program, returning $1.1 billion to shareholders since 2022.

Results vs. Market Expectations

While revenue and underlying profit met expectations, the sharp decline in statutory NPAT and dividend cut may have disappointed some investors. The company’s focus on retirement solutions and digital banking is seen as a long-term growth driver, but the challenging banking environment remains a concern.

Market Positioning

AMP’s share price leading into the results was volatile, ranging from $0.93 to $1.66 during the year. The stock is trading near its 52-week high, reflecting investor confidence in its ongoing transformation and strategic initiatives.


Disclaimer: This information is provided purely for educational purposes. It takes no account of an individual’s personal financial circumstances and hence can in no way constitute financial advice. The above data may be subject to errors or inconsistencies for which the author takes no liability. It is imperative that all investors do their own research or if they need advice, seek it from a qualified financial adviser.

Quick Take: FY2024 ASX:AMP

Quick Take: FY2024 ASX:GQG

GQG Partners – 2024 Preliminary Final Report Summary

GQG Partners

Overall Tone

GQG Partners delivered a strong financial performance for 2024, reporting substantial growth in revenue, net income, and funds under management (FUM). The company remains focused on delivering long-term investment outperformance while strategically expanding its global footprint and private capital solutions business.


Financial Results (Per Share Where Applicable)

Metric 2024 2023 % Change
Revenue $760.4M $517.6M +46.9%
Adjusted EBITDA $577.9M $384.4M +50.4%
Operating Cash Flow Not explicitly stated, but strong growth indicated
Adjusted Earnings Before Tax (EBT) $586.9M $386.9M +51.7%
Normalised EPS $0.15 $0.10 +52.3%

Outlook Commentary

GQG remains optimistic about 2025, citing strong net inflows, ongoing investment in talent and geographic expansion, and continued demand for active investment management. The firm expects further growth in its wholesale and sub-advisory channels, particularly in Australia, Canada, and the Middle East.

Guidance Statements

  • Management remains committed to organic and inorganic growth, leveraging strong investment performance and global distribution capabilities.
  • The company anticipates sustained FUM growth, supported by both market performance and net inflows.
  • The newly established Private Capital Solutions (PCS) business is expected to contribute to long-term diversification, though its near-term impact on financial results will be limited.

Results vs Market Expectations

The 52.8% increase in net income and strong FUM growth exceeded market expectations, reinforcing GQG’s reputation as a high-growth investment boutique. The firm’s ability to generate $20.2 billion in net inflows—nearly double the previous year’s $10.2 billion—was a standout achievement in a competitive asset management industry.

Market Positioning

  • Share Price Performance: Prior to the earnings report, GQG’s share price showed positive momentum, reflecting investor confidence.
  • Recent Trends: Given the strong earnings and inflows, GQG is well-positioned to attract further interest from both institutional and retail investors.

Disclaimer: This information is provided purely for educational purposes. It takes no account of an individual’s personal financial circumstances and hence can in no way constitute financial advice. The above data may be subject to errors or inconsistencies for which the author takes no liability. It is imperative that all investors do their own research or, if they need advice, seek it from a qualified financial adviser.

Quick Take: FY2024 ASX:GQG

Quick Take: 1HFY25 ASX:IMD

IMDEX Limited – 1H25 Interim Results Summary

Website: www.imdexlimited.com

Overall Tone

IMDEX reported a strong rebound in net profit for 1H25 despite a 10% decline in revenue. Profitability surged, driven by lower costs, improved operational efficiencies, and a one-off litigation income. The company continues to maintain a solid balance sheet with positive operating cash flow, but revenue softness may be a concern for investors.


Financial Highlights

Metric 1H25 1H24 % Change
Revenue $211.99M $235.32M -10%
Net Profit After Tax (NPAT) $30.98M $16.80M +84%
Basic EPS (cents) 6.05c 3.31c +83%
Interim Dividend 1.5c 1.5c No Change
Net Tangible Assets per Share 36.8c 26.09c +41%

Outlook Commentary

IMDEX remains focused on cost efficiencies and operational improvements to counterbalance revenue pressures. The company continues to invest in new technologies, particularly in its digital and software segments, to drive long-term growth. The integration of recent acquisitions, including Globaltech, is expected to further strengthen IMDEX’s intellectual property and market positioning.


Guidance Statements

While no formal earnings guidance was provided, IMDEX has emphasized its commitment to maintaining profitability and cash flow strength. The company expects demand for its drilling and mining technology solutions to remain steady, although revenue headwinds could persist in the near term.


Result vs Market Expectations

The market will likely view the sharp profit increase positively, particularly given the impact of cost reductions and operational efficiencies. However, the revenue decline may raise questions about underlying demand trends. Investors will likely focus on management’s commentary regarding future sales momentum.


Market Positioning

  • Share price performance pre-results: IMDEX shares have shown resilience, with some volatility in recent weeks.
  • 52-week high comparison: The stock remains below its 52-week high, reflecting cautious sentiment despite strong profit growth.

Meta Description:

Imdex ASX:IMD - 12 month daily chart with volume and three exponential moving averages to help quickly determine the trend.


Disclaimer:
This information is provided purely for educational purposes. It takes no account of an individual’s personal financial circumstances and hence can in no way constitute financial advice. The above data may be subject to errors or inconsistencies for which the author takes no liability. It is imperative that all investors do their own research or, if they need advice, seek it from a qualified financial adviser.

Quick Take: 1HFY25 ASX:IMD

Quick Take: 1H25Update ASX:NXL

Nuix – 1H25 Results Update

www.nuix.com/investors

Overall Tone

Nuix delivered moderate revenue and ACV growth in 1H25 but faced a decline in statutory EBITDA. While cash flow remains strong and ACV is growing, challenges in contract procurement cycles and a decrease in capitalised R&D spending weighed on earnings. The company is maintaining its FY25 growth targets but acknowledges execution risks.


Financial Highlights

Metric 1H25 Range 1H24 % Change
Annualised Contract Value (ACV) $215M – $217M $199.6M +8% – 9%
Statutory Revenue $104M – $106M $98.4M +6% – 8%
Cash EBITDA $11M – $13M $10.3M +7% – 26%
Underlying EBITDA $26M – $28M $28.4M (1%) – (8%)
Statutory EBITDA $14M – $16M $17.2M (7%) – (19%)
Cash on Hand $30M – $31M $24.0M +25% – 29%

Outlook Commentary

Nuix is targeting approximately 15% ACV growth in constant currency for FY25, but current trends suggest full-year ACV growth will likely be in the range of 11% to 16%. The company is experiencing longer procurement cycles due to larger, more complex contracts and a transition to platform-based sales.


Guidance Statements

Nuix remains on track to meet its FY25 target for revenue growth exceeding operating cost growth (excluding legal expenses). The company continues to fund software development from free cash flow and expects to be cash flow positive for the full year.


Result vs Market Expectations

The update is largely in line with expectations, with ACV growth being a positive sign. However, the decline in statutory EBITDA and the continued impact of legal expenses may raise concerns among investors. The market will likely focus on whether Nuix can execute its growth targets in the second half.


Market Positioning

  • Share price performance pre-results: Nuix has experienced some volatility leading up to the results.
  • 52-week high comparison: The stock remains below its peak, with investor sentiment influenced by legal costs and execution risks.

Nuix ASX:NXL - 12 month daily chart with volume and three exponential moving averages to help quickly determine the trend.


Disclaimer:
This information is provided purely for educational purposes. It takes no account of an individual’s personal financial circumstances and hence can in no way constitute financial advice. The above data may be subject to errors or inconsistencies for which the author takes no liability. It is imperative that all investors do their own research or, if they need advice, seek it from a qualified financial adviser.

Quick Take: 1H25Update ASX:NXL

Quick Take: 1HFY25 ASX:BVS

Bravura Solutions – 2025 Interim Results Summary

www.bravurasolutions.com

Overall Tone

Bravura Solutions delivered a significantly improved financial performance in 1H25, rebounding strongly from the prior period’s losses. The company benefited from a one-off licence sale to Fidelity International, significantly boosting profitability. Underlying performance also improved, with EBITDA and cash flow showing strong growth despite some regional revenue softness.


Financial Results Summary

Metric 1H25 1H24 % Change
Revenue $183.8M $127.0M +44.7%
Revenue (excluding licence sale) $127.5M $127.0M +0.4%
Adjusted EBITDA $23.8M $7.9M +201%
Operating Cash Flow $67.1M $18.8M +257%
Adjusted Earnings Before Tax (EBT) $18.0M -$1.7M N/A
Normalised EPS 2.5c -0.4c N/A

Outlook Commentary

Bravura Solutions remains focused on its strategic growth initiatives, particularly in expanding its software offerings and improving operational efficiencies. The company continues to invest in its Alta and Advice OS platforms, aiming to enhance product functionality and expand its total addressable market.


Guidance Statements

The company has not provided formal earnings guidance but expects continued profitability and cash flow strength. It remains committed to prudent capital allocation, with a focus on maintaining a strong balance sheet and shareholder returns.


Result vs Market Expectations

The strong results, particularly the one-off licence sale impact, exceeded market expectations. The significant profitability rebound has likely reassured investors, although the market will be keen to assess sustainable earnings growth excluding non-recurring items.


Market Positioning

  • Share price performance pre-results: The stock had seen moderate gains in the prior week.
  • 52-week high comparison: The share price remains below its 52-week high, suggesting there is room for further upside if the company maintains its momentum.

Bravura Solutions ASX:BVS - 12 month daily chart with volume and three exponential moving averages to help quickly determine the trend.


Disclaimer:
This information is provided purely for educational purposes. It takes no account of an individual’s personal financial circumstances and hence can in no way constitute financial advice. The above data may be subject to errors or inconsistencies for which the author takes no liability. It is imperative that all investors do their own research or, if they need advice, seek it from a qualified financial adviser.

Quick Take: 1HFY25 ASX:BVS

Quick Take: H1FY25 ASX:IAG

2025 Insurance Australia Group – Interim Results Summary

https://www.iag.com.au

Overall Tone

Insurance Australia Group’s interim report presents a strong but mixed outlook, with significant profit growth and improved margins. However, a slowdown in gross written premium (GWP) growth, a lower-than-expected dividend, and cautious forward guidance have led to a negative market reaction despite improved profitability.

Financial Performance

Metric 1H25 1H24 % Change
Revenue $9.04bn $8.69bn ▲ 4.0%
Net Profit After Tax (NPAT) $778m $407m ▲ 91.2%
Insurance Profit $957m $614m ▲ 55.9%
Reported Insurance Margin 19.4% 13.7% ▲ 5.7pp
Underlying Insurance Margin 15.1% 13.7% ▲ 1.4pp
Operating Cash Flow $324m $805m ▼ 59.7%
Earnings Per Share (EPS) 32.88c 16.77c ▲ 96.1%
Dividend Per Share 12.0c (60% franked) 10.0c (40% franked) ▲ 20.0%

Key Takeaways

  • Profitability Up, But Revenue Growth Slowing: NPAT nearly doubled, and margins improved, but GWP growth slowed to 6.0%, compared to 12.5% in the prior corresponding period.
  • Dividend Below Expectations: The 12.0c dividend was lower than analyst expectations of 13.9c, contributing to investor disappointment.
  • Premium Growth Concerns: Management indicated GWP growth is likely to be at the lower end of its mid-to-high single-digit forecast range.
  • Cautious Forward Outlook: Slower premium growth and continued investment in digital transformation and claims handling may weigh on future earnings.

Outlook & Guidance

  • FY25 NPAT Guidance: Expected in the range of $1.4bn – $1.6bn.
  • Reported Insurance Margin: 13.5% – 15.5%, expected toward the upper end.
  • Premium Growth: Likely to be at the lower end of previous expectations.
  • Business Interruption Provision Release: $140m post-tax release, not expected to be recurring.

Market Positioning

As of February 12, 2025, Insurance Australia Group Limited (ASX: IAG) is trading at $8.92 per share. The current price is about 3.1% below its 52-week high of $9.21, reached on January 31, 2025.

Market Expectations

  • The results delivered strong profit growth but fell short on revenue expansion and dividends, leading to a significant share price decline.
  • Investors appear concerned that growth in premium income is slowing, which may impact future revenue and earnings potential.

Final Thought: Quick Take: H1FY25 ASX:IAG

While IAG posted strong profitability and margin expansion, the market’s focus on slowing premium growth and cautious guidance has overshadowed the result. Investors will likely watch how management balances growth, cost control, and capital returns in the coming quarters.

Insurance Australia Group ASX:IAG - 12 month daily chart with volume and three exponential moving averages to help quickly determine the trend.


“This information is provided purely for educational purposes. It takes no account of an individual’s personal financial circumstances and hence can in no way constitute financial advice. The above data may be subject to errors or inconsistencies for which the author takes no liability. It is imperative that all investors do their own research or if they need advice, seek it from a qualified financial adviser.”

Quick Take: H1FY25 ASX:IAG

Quick Take: H1FY25 ASX:DOW

Downer Group – 2025 Interim Results Summary

https://www.downergroup.com

Overall Tone

The report conveys a positive and confident tone, emphasizing that Downer’s turnaround strategy is on track. The company highlights improvements in earnings, cost efficiencies, and margin growth while acknowledging softer conditions in certain markets.

Key Financial Metrics (Compared to 1H24)

Metric 1H25 1H24 Change
Revenue $5.5bn $5.79bn ▼5.2%
EBITA $204.4m $149.1m ▲37.1%
EBITA Margin 3.7% 2.6% ▲1.1pp
NPATA $127.3m $74.9m ▲70%
NPAT $75.5m $72.1m ▲4.7%
Operating Cash Flow $220.1m $168.2m ▲30.9%
Free Cash Flow $112.5m $19.9m ▲>100%
Net Debt to EBITDA 1.3x 1.4x Improved

Revenue & Earnings Analysis

  • Revenue decreased 5.2% due to divestments and reduced government transport spending.
  • EBITA grew 37.1%, reflecting strong cost reduction efforts and operational improvements.
  • EBITA margin increased by 1.1 percentage points to 3.7%, driven by enhanced contract management and disciplined risk-taking.

Operating Cash Flow

  • Cash conversion improved to 94%, strengthening the balance sheet.
  • Free cash flow surged to $112.5m, a significant improvement from $19.9m in 1H24.

Outlook & Guidance

  • The company remains confident in its turnaround strategy, targeting an underlying NPATA of $265m – $280m for FY25.
  • EBITA margins are expected to exceed 4.5% in FY26, with a minimum threshold of 4.2% in FY25.
  • Strong tender pipeline in 2H25 across Defence, Telecommunications, Power, and Road Maintenance.
  • Market conditions remain varied, with lower Australian transport spending and a softer New Zealand economy.

Observations on Market Expectations

The result appears broadly in line with expectations, with stronger-than-expected cost savings and EBITA growth balancing out weaker revenue. The continued turnaround progress and margin expansion could be seen as a positive surprise.

Downer Group ASX:DOW - 12 month daily chart with volume and three exponential moving averages to help quickly determine the trend.


“Disclaimer: This information is provided purely for educational purposes. It takes no account of an individual’s personal financial circumstances and hence can in no way constitute financial advice. The above data may be subject to errors or inconsistencies for which the author takes no liability. It is imperative that all investors do their own research or if they need advice, seek it from a qualified financial adviser.”

Quick Take: H1FY25 ASX:DOW

Quick Take: H1FY25 ASX:TWE

Treasury Wine Estates – 2025 Interim Results Summary

https://www.tweglobal.com/

Overall Tone

Treasury Wine Estates (TWE) results indicate a strong performance, with notable increases in revenue, profitability, and margins. The company continues to benefit from premiumization, strong growth in its Penfolds brand, and the integration of DAOU Vineyards. However, increased costs and restructuring efforts are worth monitoring.


Key Financial Metrics (Half-Year Ended 31 December 2024)

Metric 1H FY25 1H FY24 % Change
Revenue $1,570.4M $1,313.4M +19.6%
EBITDA (EBITS) $391.4M $289.8M +35.1%
Net Profit After Tax (NPAT) $220.9M $166.7M +32.5%
Operating Cash Flow $259.6M $149.0M +74.2%
Earnings Per Share (EPS) 27.2 cps 22.5 cps +21%
Interim Dividend 20.0 cps 17.0 cps +17.6%

Revenue & Profitability Trends

  • Revenue growth of 19.6% was driven by strong demand for luxury wine, particularly in the Penfolds portfolio, and the contribution of DAOU Vineyards.
  • EBITS margin expanded to 25.3% (up from 22.5%), reflecting improved pricing and a premium product mix.
  • Operating cash flow increased by 74.2%, showing strong cash generation and efficient capital management.

Earnings Before Tax (EBT)

  • EBT increased 42% to $322M, supported by higher revenue and cost efficiencies.
  • Finance costs rose slightly due to higher debt levels, but the overall impact was manageable.

Outlook Commentary

  • TWE remains focused on premiumization and expects further growth from Penfolds and DAOU Vineyards.
  • Expansion in China and other Asian markets is progressing well, with strong sales momentum.
  • Cost pressures are being managed through price increases and operational efficiencies.

Guidance Statements

  • The company did not provide formal earnings guidance but expects continued margin expansion and strong organic revenue growth.
  • Further integration of DAOU Vineyards is expected to contribute positively to earnings.
  • The dividend reinvestment plan (DRP) remains active, reflecting confidence in cash flow sustainability.

Market Expectations & Observations

  • Results exceeded market expectations, particularly in revenue and earnings growth.
  • The interim dividend increase suggests confidence in future performance.
  • Investors will watch cost management and further integration of acquisitions.

Treasury Wine Estates ASX:TWE - 12 month daily chart with volume and three exponential moving averages to help quickly determine the trend.


Disclaimer

Disclaimer: This information is provided purely for educational purposes. It takes no account of an individual’s personal financial circumstances and hence can in no way constitute financial advice. The above data may be subject to errors or inconsistencies for which the author takes no liability. It is imperative that all investors do their own research or if they need advice, seek it from a qualified financial adviser.

Quick Take: H1FY25 ASX:TWE

Quick Take: H1FY25 ASX:PME

Pro Medicus Limited – 2025 Interim Results Summary

https://www.promed.com.au/

Overall Tone

Pro Medicus Limited (PME) has delivered exceptional financial results for the half-year ended 31 December 2024, reflecting strong revenue growth, margin expansion, and increasing profitability. The company’s North American expansion and contract wins have significantly contributed to this above-market performance, alongside disciplined cost management and robust cash flow generation.


Key Financial Metrics

Metric H1 FY25 (31 Dec 2024) H1 FY24 (31 Dec 2023) Change (%)
Revenue ($’000) 97,190 74,110 +31.1%
EBITDA ($’000) N/A N/A
EBT ($’000) 73,272 50,162 +46.1%
NPAT ($’000) 51,745 36,250 +42.7%
Operating Cash Flow ($’000) 48,710 28,988 +68.1%
Net Cash & Financial Assets ($’000) 182,330 154,900 +17.7%
Interim Dividend (cents per share) 25.0 18.0 +38.9%

Performance Analysis

Revenue Growth

  • Revenue surged 31.1% to $97.2 million, driven by strong growth in North America (+34.6%), contract renewals, and increasing adoption of PME’s software solutions.
  • On a constant currency basis, revenue would have been $97.84 million (+32.0%).
  • Growth in Europe (+0.8%) and Australia (+10.8%) was modest but steady.

EBT & NPAT

  • Earnings before tax (EBT) rose 46.1% to $73.27 million, reflecting strong operating leverage.
  • Net profit after tax (NPAT) increased by 42.7% to $51.75 million, demonstrating margin expansion and cost efficiencies.

Cash Flow & Balance Sheet Strength

  • Operating cash flow surged 68.1% to $48.71 million, highlighting PME’s strong cash generation ability.
  • Cash reserves increased by $24.48 million, despite higher dividend payouts.
  • PME remains debt-free, positioning it well for future expansion and strategic investments.

Dividend Increase

  • Interim dividend raised to 25.0 cents per share (vs. 18.0 cents in H1 FY24), representing a 38.9% increase.
  • Reflects management confidence in PME’s earnings growth and commitment to shareholder returns.

Outlook Commentary

  • PME is well-positioned for continued growth, particularly in North America, where it secured $365 million in new contracts across Lurie Children’s Hospital, Trinity Health, and Duly Health & Care.
  • Contract renewals with NYU Langone, Duke Health ($39 million, 5-year deals), and Mercy Health ($98 million, 8-year deal) provide a long-term revenue base.
  • Investment in AI-driven imaging solutions and R&D continues to support PME’s competitive edge.
  • The company remains focused on academic hospitals, integrated delivery networks (IDNs), and corporate imaging centers, expanding its global footprint.

Guidance Statements

  • No formal guidance was provided, but the growth trajectory remains strong.
  • The company’s cash reserves and contract backlog suggest continued revenue expansion.

Market Expectation vs. Actual Performance

  • Given the strong revenue growth, margin expansion, and contract pipeline, PME’s results likely exceeded market expectations.
  • North American contract wins and strong cash flow generation are major positives.
  • The 38.9% increase in dividend payout signals management confidence.
  • The market may react positively, given PME’s high-growth profile, expanding margins, and cash generation strength.

Per Share Analysis

Metric H1 FY25 H1 FY24 Change (%)
Earnings per Share (EPS) 49.53 cents 34.71 cents +42.7%
Diluted EPS 49.44 cents 34.61 cents +42.9%
Interim Dividend per Share 25.0 cents 18.0 cents +38.9%

Conclusion

Pro Medicus Limited delivered outstanding H1 FY25 results, with exceptional revenue growth (+31.1%), profit expansion (+42.7%), and cash flow strength (+68.1%). The strong contract wins, high-margin business model, and disciplined capital allocation position PME for continued outperformance. The increase in dividend payout (+38.9%) further reinforces management’s confidence in sustained growth.

PME’s results likely exceeded market expectations, and the stock may react positively given its strong fundamentals, debt-free balance sheet, and strategic expansion plans.

Pro Medicus ASX:PME - 12 month daily chart with volume and three exponential moving averages to help quickly determine the trend.


Disclaimer: This information is provided purely for educational purposes. It takes no account of an individual’s personal financial circumstances and hence can in no way constitute financial advice. The above data may be subject to errors or inconsistencies for which the author takes no liability. It is imperative that all investors do their own research or if they need advice, seek it from a qualified financial adviser.

Quick Take: H1FY25 ASX:PME

Quick Take: H1FY25 ASX:TPW

Temple & Webster Group Ltd – 2025 Interim Results Summary

https://www.templeandwebster.com.au/

Overall Tone

The financial results for Temple & Webster Group Ltd (TPW) for the half-year ended 31 December 2024 indicate a strong and positive performance. The company has achieved robust revenue growth, significantly improved profitability, and strong cash flow generation. Operational efficiency gains, strategic investments in AI, and an increase in exclusive product offerings have contributed to the better-than-expected financial performance.


Key Financial Metrics

Metric H1 FY25 (31 Dec 2024) H1 FY24 (31 Dec 2023) Change (%)
Revenue ($’000) 313,710 253,827 +24%
EBITDA ($’000) 13,168 7,473 +76%
EBITDA Margin (%) 4.2% 2.9% +130bps
EBT ($’000) 12,466 6,428 +94%
NPAT ($’000) 8,980 4,125 +118%
Operating Cash Flow ($’000) 35,064 21,906 +60%
Net Tangible Assets per Share (cents) 81.3 64.25 +27%

Performance Analysis

Revenue

  • TPW achieved $313.7 million in revenue, representing a 24% increase YoY.
  • Growth was driven by record active customers (~1.2 million) and an increase in revenue per active customer (+2%).

EBITDA

  • EBITDA surged 76% to $13.2 million, reflecting margin expansion to 4.2% (vs. 2.9% YoY).
  • This was aided by cost discipline, AI-driven efficiencies, and improved gross margins.

Operating Cash Flows

  • Operating cash flow improved 60% to $35.1 million, showing strong cash conversion.
  • Free cash flow was $32.5 million, highlighting TPW’s capital-light business model.

Earnings Before Tax (EBT)

  • Pre-tax earnings almost doubled (+94%) to $12.5 million, demonstrating strong operational leverage.

Net Profit After Tax (NPAT)

  • NPAT more than doubled to $9.0 million (+118%), significantly outpacing revenue growth.

Outlook Commentary

  • TPW remains on track to achieve its mid-term goal of $1 billion+ in annual revenue within 3-5 years.
  • Expansion in exclusive products (45% of revenue) and further AI-driven efficiencies expected to drive margin expansion.
  • Market share increased by 23% to 2.9%, reinforcing TPW’s growing dominance in the online furniture and homewares segment.

Guidance Statements

  • No formal guidance was provided for FY25.
  • The company maintains a strong balance sheet with $139.3 million in cash, positioning it well for further growth initiatives.

Market Expectation vs. Actual Performance

  • Given the strong revenue growth, significant profit expansion, and high cash flow conversion, TPW’s results likely exceeded market expectations.
  • The company’s ability to scale efficiently while improving profitability is a positive surprise.
  • If the market expected a more moderate earnings growth, these results may lead to a positive share price reaction.

Per Share Analysis

Metric H1 FY25 H1 FY24 Change (%)
Earnings per Share (EPS) 7.57 cents 3.45 cents +119%
Diluted EPS 7.20 cents 3.30 cents +118%
Net Tangible Assets per Share 81.3 cents 64.25 cents +27%

Conclusion

Temple & Webster delivered a standout H1 FY25 performance, with strong revenue growth, significant margin expansion, and robust cash generation. AI-driven efficiencies and increasing penetration of exclusive products provide a clear path to further earnings growth. The company’s market share gains and disciplined cost structure position it well for continued outperformance.

Temple & Webster ASX:TPW - 12 month daily chart with volume and three exponential moving averages to help quickly determine the trend.


Disclaimer: This information is provided purely for educational purposes. It takes no account of an individual’s personal financial circumstances and hence can in no way constitute financial advice. The above data may be subject to errors or inconsistencies for which the author takes no liability. It is imperative that all investors do their own research or if they need advice, seek it from a qualified financial adviser.

Quick Take: H1FY25 ASX:TPW

Crispr NASDAQ:CRSP Analysis

About Crispr NASDAQ:CRSP

CRISPR Therapeutics is a biotechnology company developing gene-based medicines using CRISPR-Cas9 technology. Their work targets genetic diseases by editing DNA to correct or modify disease-causing genes. Key programs include treatments for beta-thalassemia and sickle cell disease, focusing on producing healthy blood cells. They are also advancing cancer immunotherapies by engineering immune cells to target tumors. Additionally, CRISPR explores regenerative medicine and other therapeutic areas to provide potentially curative treatments for severe genetic disorders.

Visit CRISPR’s website

Share Price Performance

Crispr NASDAQ:CRSP Analysis - share price performance over various periods in the last 2 years

Crispr NASDAQ:CRSP Price chart since 2020

In 2020, CRSP experienced substantial gains, which were erased in 2021. Since then, the stock has traded sideways, forming what technical analysts might consider a base. These periods often precede a potential breakout, provided the company delivers strong financial results to sustain upward momentum.

Market Overview

Crispr NASDAQ:CRSP Analysis - Market cap, free float and short positions

With a market cap of $4 billion, CRSP would rank comfortably within the ASX 200, as its valuation aligns with mid-to-upper-tier Australian companies. However, in the U.S. biotech sector, it is considered mid-sized. While it is much smaller than industry giants like Amgen or Regeneron, CRSP holds a notable position among innovative biotech firms developing cutting-edge therapies.

Short interest in CRSP exceeds 26%, with 19 days required to cover these positions based on average trading volume. This indicates significant market scepticism about the stock. However, unexpected positive developments could trigger a rapid price increase as short positions are closed.

Current Balance Sheet

Crispr NASDAQ:CRSP - Key balance sheet items

CRSP’s tangible value stems primarily from its cash holdings, which are substantial. Often companies that are heavily shorted are low on cash and have significant debt loads suggesting a future capital raise will be needed. That is not the case with this company.

Earnings

The company’s revenue history is inconsistent, driven by milestone payments from its partner, Vertex Pharmaceuticals. Future revenues are expected to grow strongly as its first approved treatment gains traction. EBITDA is also forecasted to improve significantly.

Valuation

Crispr NASDAQ:CRSP Analysis - Valuation metrics

CRSP remains unprofitable, and its valuation at 20x sales appears high. However, the projected revenue growth may justify this multiple over time. Analyst sentiment is broadly positive, with a 12-month average price target of $79.54 from 24 analysts.

Technical Analysis

Crispr NASDAQ:CRSP - price chart for the past 6 months

A look more closely at the recent price action shows that the short-term uptrend that was in place since mid-October has now collapsed back into a downtrend. CRSP has tried to break the downward price momentum on three occasions with the share price pushing above the medium-term trend as indicated by the 125 day EMA only to be rejected every time. It looks like the company will have to consolidate further around the lows before it can try and mount a fourth attempt at changing direction.

News From The Company

On November 11, (which can be seen as the day the share price spiked to almost $60) CRSPR’s CEO sold 30,000 shares. While still owning 196,540 shares, there is no doubt that that has put a serious dampener on what was looking like a promising share price recovery.

On November 5, the company announced their quarterly results beating market expectations with a narrower than expected loss of $1.01 per share. In the same period 12 months ago, they reported a loss of $1.41 per share. Total revenues were negligible though at $0.6M and were entirely from grants.

Vertex Pharmaceuticals (NASDAQ:VRTX)

Crispr NASDAQ:CRSP Analysis - Vertex Pharmaceuticals price chart since 2021

Vertex leads the global commercialization of CRISPR’s gene therapy, Casgevy. They reported $2 million in initial product revenues during their latest earnings release, highlighting a strong launch. For risk-averse investors, Vertex may offer a safer way to gain exposure to CRISPR’s success.

Controversy

  • Throughout my analysis, the phrase “controversial therapies” frequently appeared. CRSP operates in gene editing, which raises several concerns:
    • Off-Target Effects: Unintended genetic changes may pose health risks.
    • Germline Editing: Modifying embryonic genes can affect future generations, sparking ethical debates about “designer babies.”
    • Access and Equity: High costs may limit access, worsening healthcare disparities.
    • Environmental Impact: Gene editing in organisms might have unpredictable ecological consequences.
    • Regulatory Challenges: Global laws on genetic modification vary, complicating compliance and oversight.

Final Thoughts On CRISPR

CRISPR Therapeutics operates at the forefront of biotechnology, leveraging cutting-edge gene-editing technology to address critical medical challenges. Despite its innovative approach and strong financial position, the company faces significant hurdles, including market skepticism, ethical controversies, and inconsistent revenues. CRSP’s future will likely depend on its ability to deliver consistent results, navigate regulatory landscapes, and address public concerns about gene editing’s broader implications. While the company shows potential, its path forward remains contingent on balancing these challenges with its technological promise.


Disclaimer: This information is provided purely for educational purposes. It takes no account of an individual’s personal financial circumstances and hence can in no way constitute financial advice. The above data may be subject to errors or inconsistencies for which the author takes no liability. It is imperative that all investors do their own research or if they need advice, seek it from a qualified financial adviser.

Crispr NASDAQ:CRSP Analysis