This is a restricted members post.
Category: Reports
Environmental Group (ASX:EGL) Analysis
Update December 14, 2024
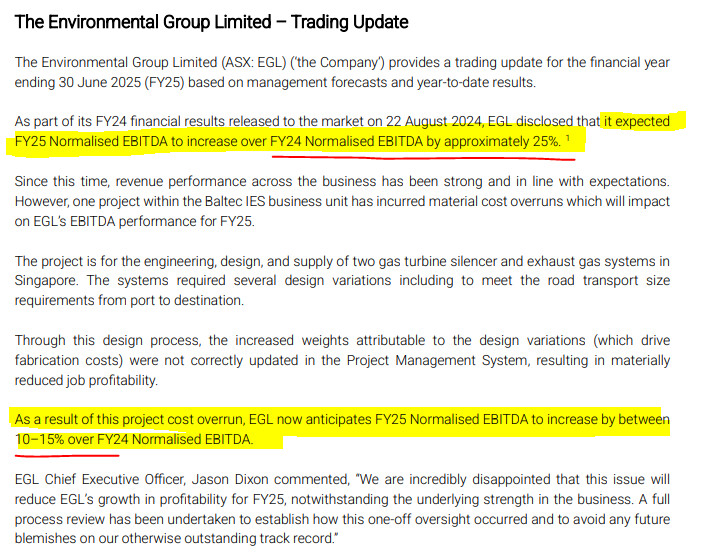
This announcement killed the upward momentum in the share price.

If it indeed is a one-off and the company can return to their longer-term trend of earnings growth, it could be argued that this sell-off has been overdone.
About the company
The Environmental Group Ltd (ASX: EGL) specializes in providing environmental solutions, focusing on air pollution control, water treatment, and waste management systems. The company designs, manufactures, and services equipment that helps industrial and commercial clients meet environmental compliance standards. EGL operates across various sectors, including mining, manufacturing, and energy, offering products and services aimed at reducing emissions, managing water resources, and enhancing overall environmental sustainability.
Company Dashboard
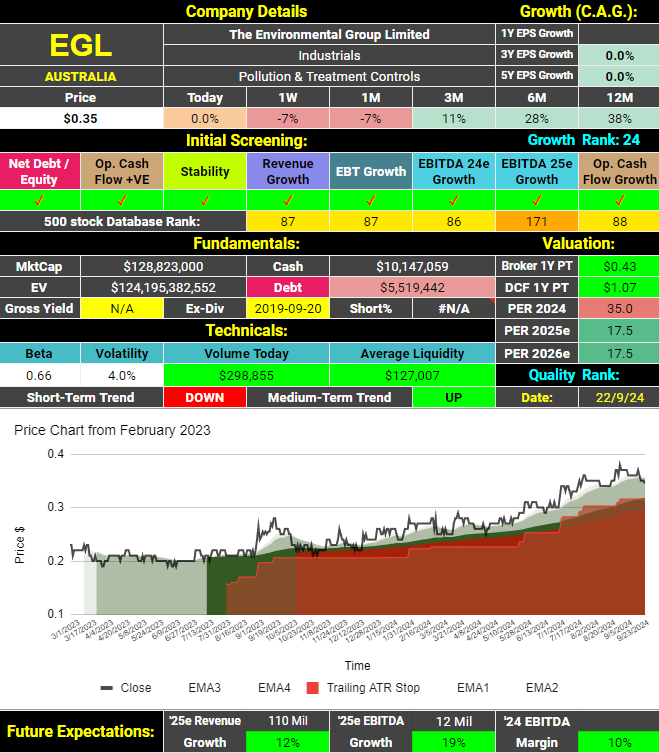
The initial screening shows a score of 8 ticks out of 8. As a result, EGL qualifies for a growth ranking, currently a respectable 24th in my database of 500 companies. Debt is less than cash, but it has been several years since they paid a dividend. Analysts are optimistic about the company, believing the share price is undervalued by 23% over a 12-month horizon. They predict revenues and earnings will grow steadily in the year ahead.
They do not feature on the list of ASX most shorted stocks, as they are too small.
Fundamental analysis

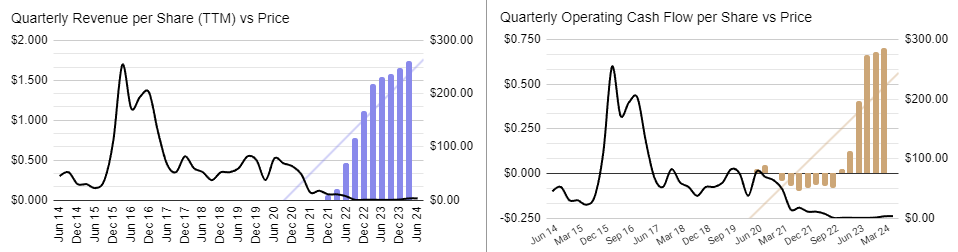
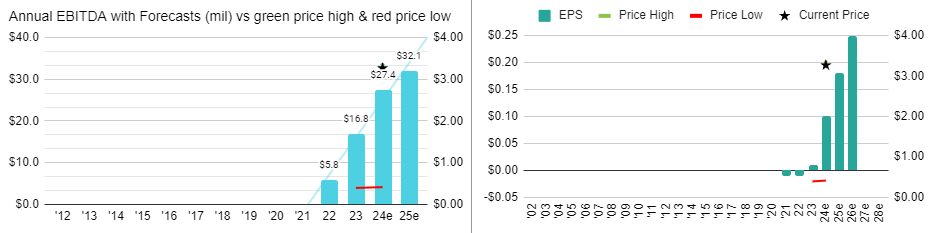
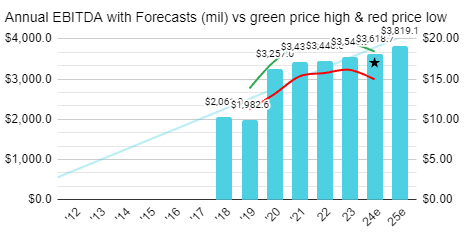
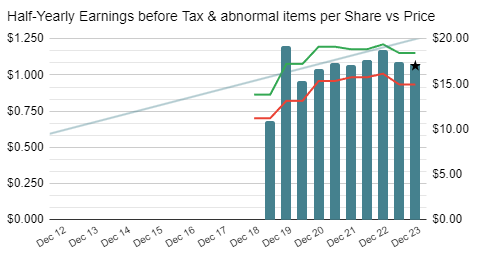
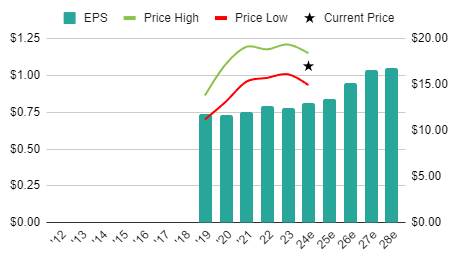
Since 2020, earnings have risen significantly, and analysts expect this trend to continue.
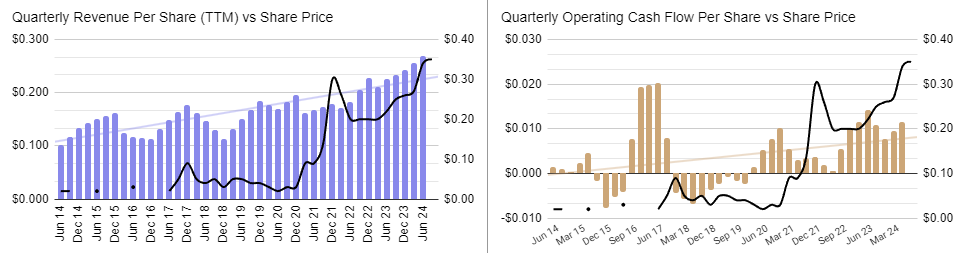
This growth has been driven by consistent increases in revenues. However, operating cash flows have yet to exhibit the same robust trends.
Quality Analysis
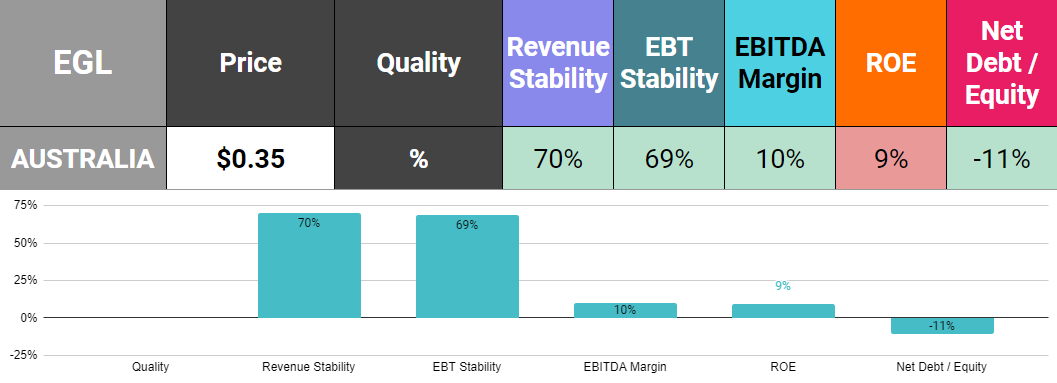
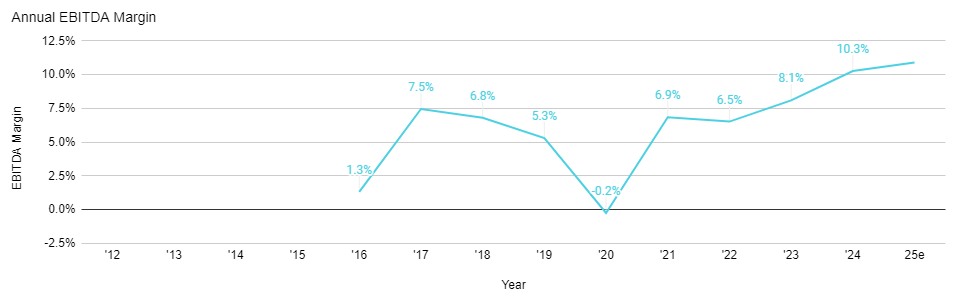
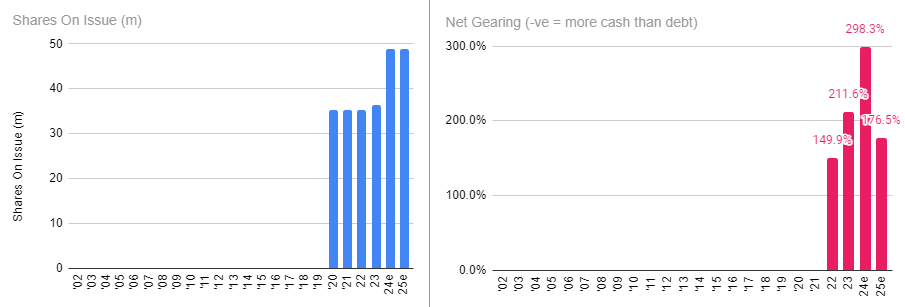
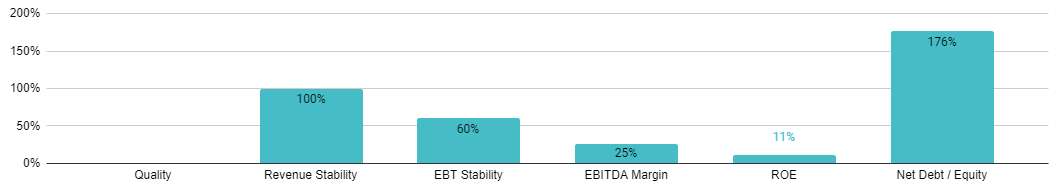
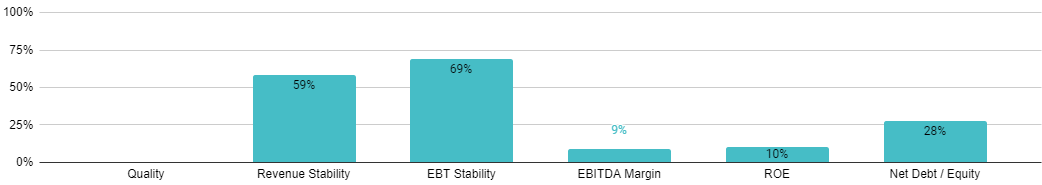
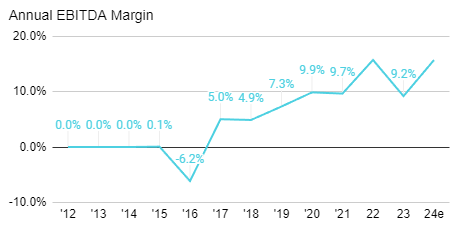
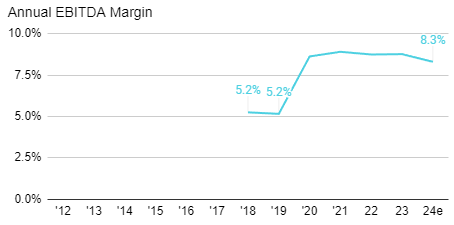
In 7 out of the last 10 instances, EGL has reported improvements in both revenues and earnings. EBITDA margins are healthy at 10%, with an upward trend. The same positive trend is evident in Return on Equity (ROE). With more cash than debt, EGL is in a strong financial position. Overall, it should be considered a medium-quality company with improving metrics across the board. If these trends continue, it could be regarded as a high-quality company in the near future.
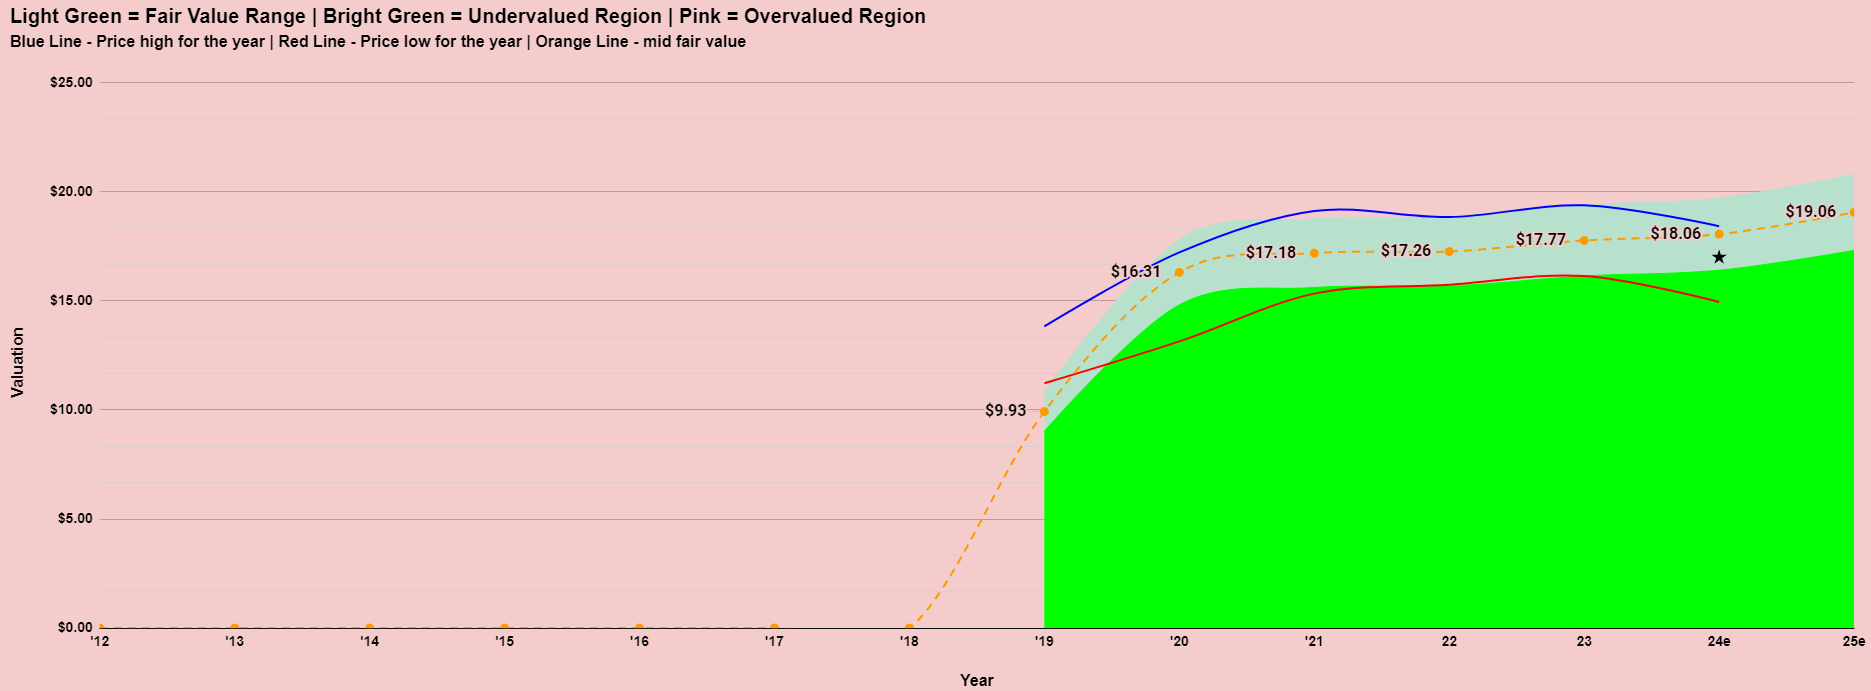
Valuation

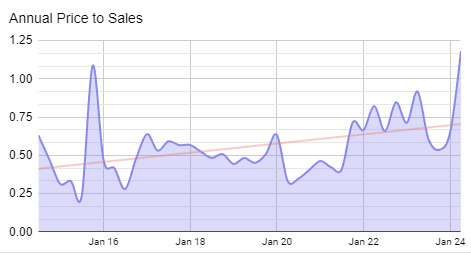
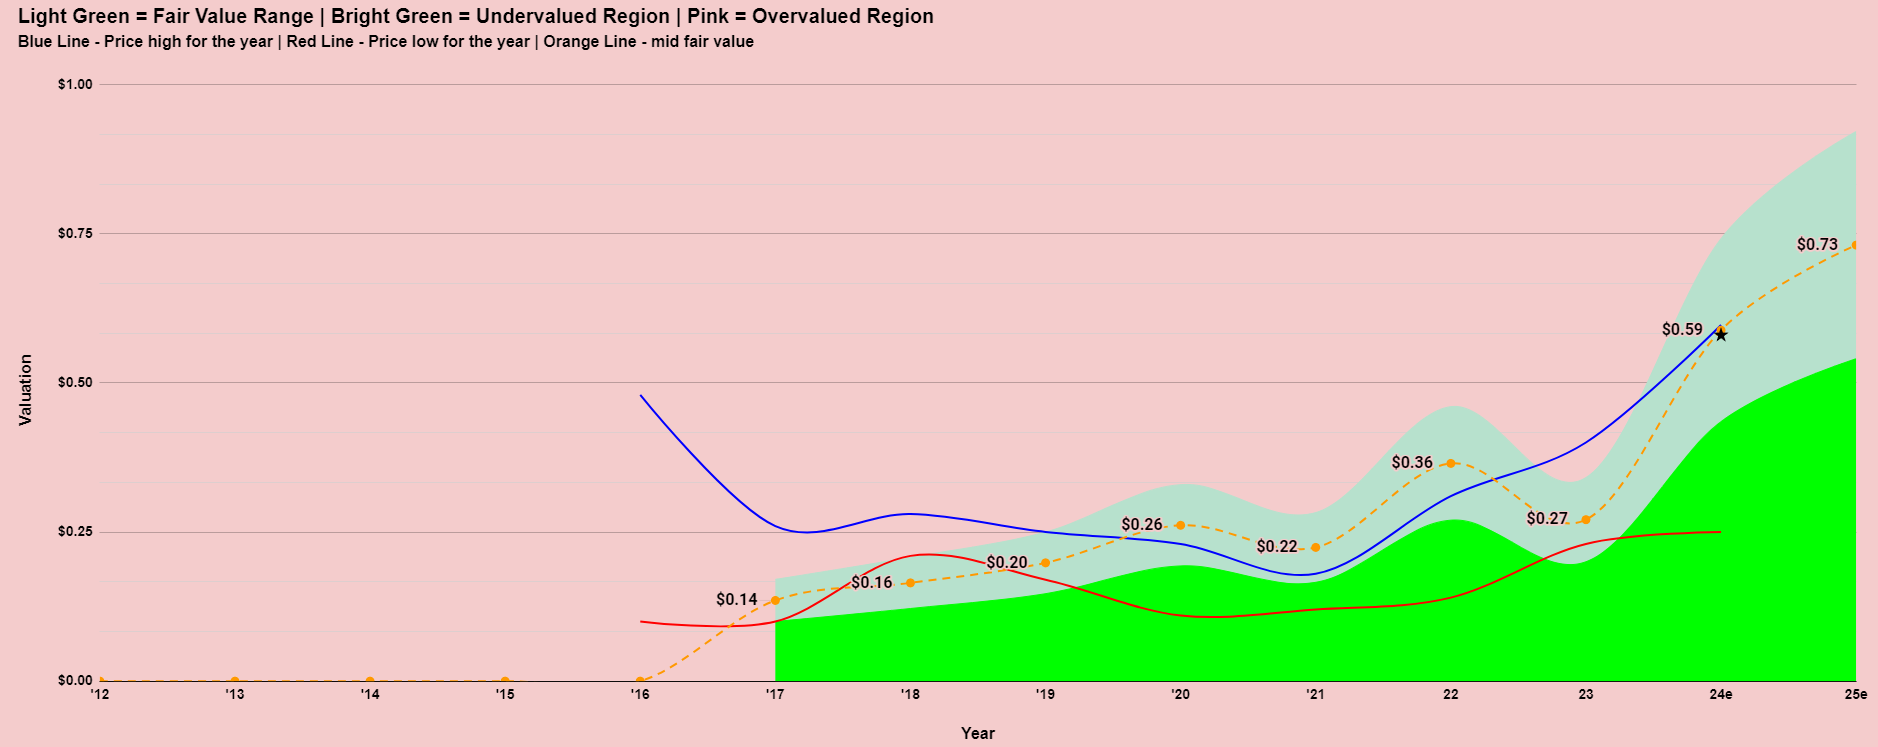
Based on the market’s valuation of EGL since 2021, the share price appears to be near fair value. However, as EGL continues to grow and deliver consistent results, it is reasonable to expect the market to gradually increase the multiple it is willing to pay for the company. As indicated in the Company Dashboard, analysts currently believe the company is undervalued.
Technical Analysis

Looking at the long-term daily chart, the period from 2005 to 2020 was challenging for EGL. From 2020 to 2022, the market grew excited about the company. Technically, EGL failed at the significant 37.5% Fibonacci level, corresponding with a previous resistance level from many years earlier. After a more steady climb, EGL is once again testing this level. However, this time the company’s fundamentals are much stronger. If the share price can break clearly above 38c, the next target would be 46c, and beyond that, a push to test old highs around 60c. A fall below 30c would be a negative signal.
News From The Company
The following information is sourced from the Environmental Group Results Presentation, August 28, 2024:

The company consists of five divisions.

It has reported a solid year with a strong outlook. Notably, the company is forecasting a 25% increase in EBITDA, while analysts are currently forecasting only 19%.
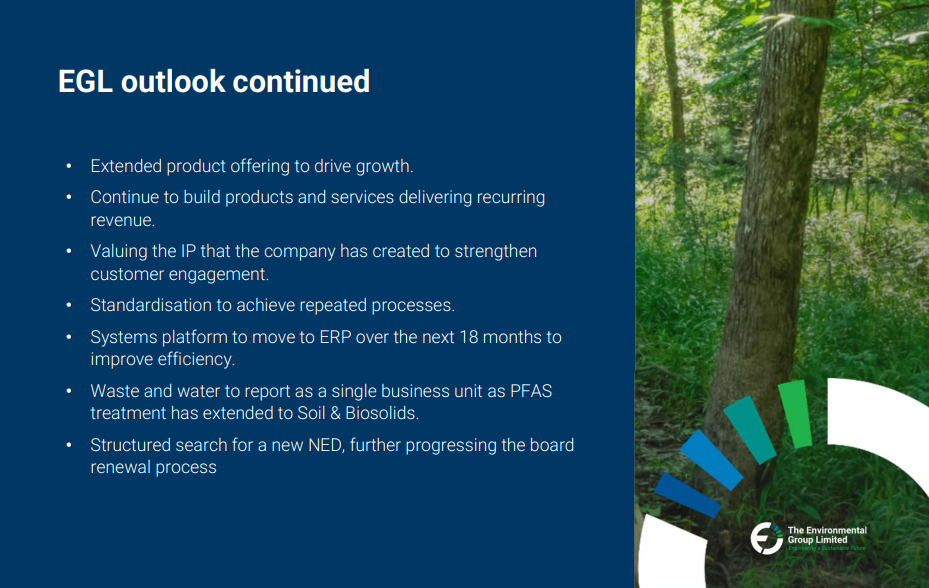
The company remains confident that it has significant organic growth opportunities to capitalize on in the year ahead.
Final thoughts on Environmental Group (ASX:EGL)
The Environmental Group Ltd has demonstrated impressive growth in recent years, with rising earnings and improving financial metrics. While operating cash flows have room to improve, the company’s strong cash position, growing revenues, and upward trends in profitability signal a promising outlook. With analysts forecasting continued growth and the potential for market revaluation, EGL stands as a medium-quality company with strong potential to achieve high-quality status in the future. Investors should watch closely as the company breaks key technical levels, which may signal further upward momentum.
Disclaimer: This information is provided purely for educational purposes. It takes no account of an individual’s personal financial circumstances and hence can in no way constitute financial advice. The above data may be subject to errors or inconsistencies for which the author takes no liability. It is imperative that all investors do their own research or if they need advice, seek it from a qualified financial adviser.
Environmental Group (ASX:EGL) Analysis
What’s happened to Neuren Pharmaceuticals (ASX:NEU)?
About Neuren Pharmaceuticals ASX:NEU
Neuren Pharmaceuticals is an Australian biopharmaceutical company focused on developing therapies for neurodevelopmental and neurodegenerative disorders. The company specializes in creating treatments for rare conditions such as Rett syndrome, Fragile X syndrome, and other related neurodevelopmental disorders. Neuren’s lead product, trofinetide, has shown promise in clinical trials and is designed to address the underlying symptoms of these disorders. Through innovative research and partnerships, Neuren aims to bring effective treatments to market for conditions with significant unmet medical needs.
2023 – A Break-out Year
Neuren Pharmaceuticals was probably one of the biggest company stories of 2023. This was due to the successful launch of DAYBUE in the United States for the treatment of Rett syndrome. ASX:NEU received an upfront payment of A$205M along with royalties of A$27M from its distribution partner Arcadia Biosciences. The company also reported encouraging top-line results from a Phase 2 trial of NNZ-2591 for Phelan-McDermid syndrome. 2023 was a great year for the company, setting the stage for a strong outlook in the coming years.

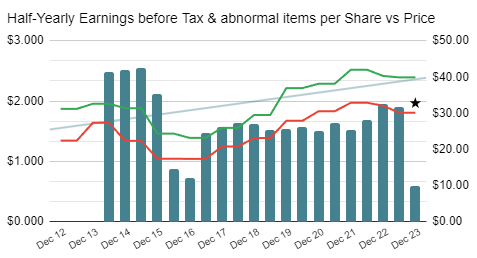
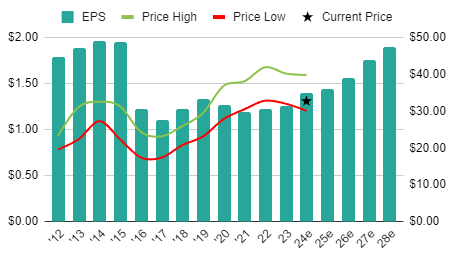
2024 – The Reality Check
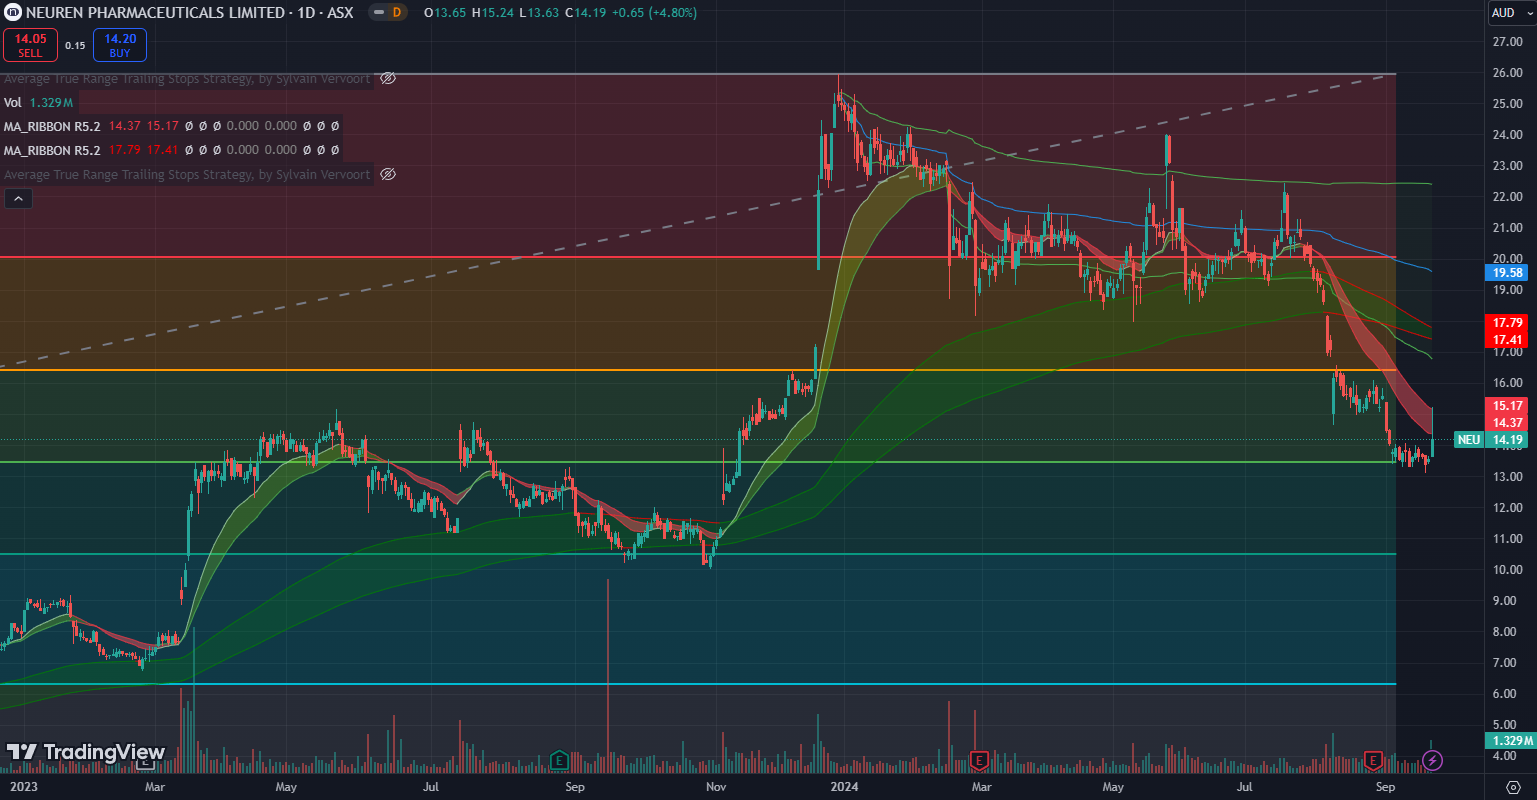
As September 2024 ends, shareholders are questioning why the share price, which nearly hit $26 just nine months ago, has declined to just $14.19 at the time of writing – a 45% decline.
In March 2024, Culper Research released a short-seller report targeting Neuren’s distribution partner, Arcadia Pharmaceuticals (NASDAQ: ACAD). The report accused Arcadia of misrepresenting retention data for DAYBUE, alleging that most patients stop using the treatment after six months. It also claimed Arcadia misrepresented safety data, suggesting nearly all patients experienced diarrhea, and about 1 in 10 were hospitalized. Additionally, only 13% of patients showed improvements in their condition. Culper also highlighted a series of high-level departures, including the Head of R&D, Chief Science Officer, and General Counsel, all of whom left within three months. The report further suggested insurers were concerned about the drug’s efficacy and its high price of US$575,000 per treatment.
While it’s still unclear if the report’s claims hold true, Arcadia has not met its initial sales targets. However, DAYBUE sales continue to grow in 2024, albeit at a slower pace than expected when Neuren’s share price was near $26.
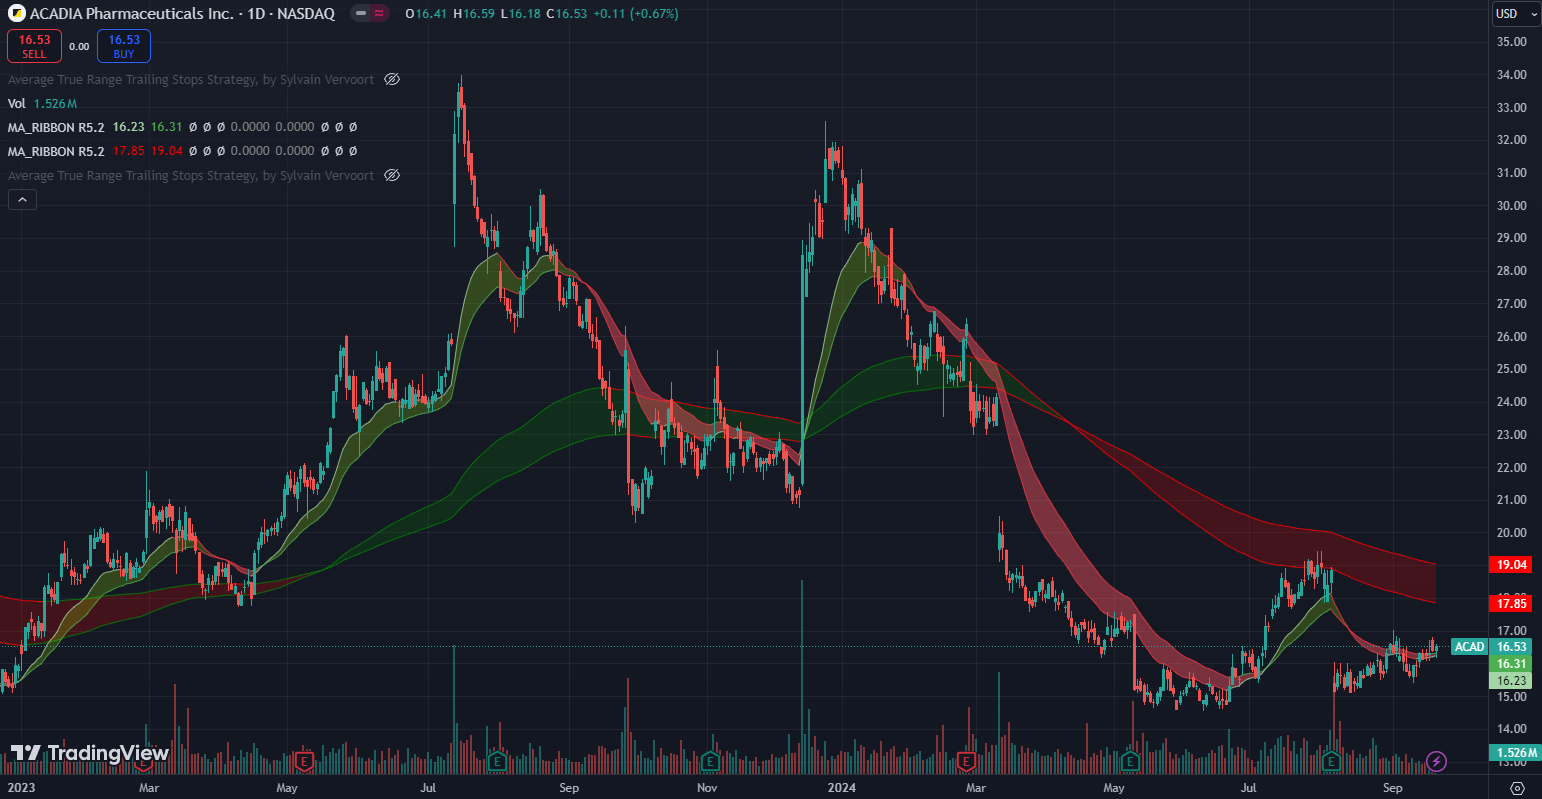
2024 has been a tough year for Arcadia Pharmaceuticals too.
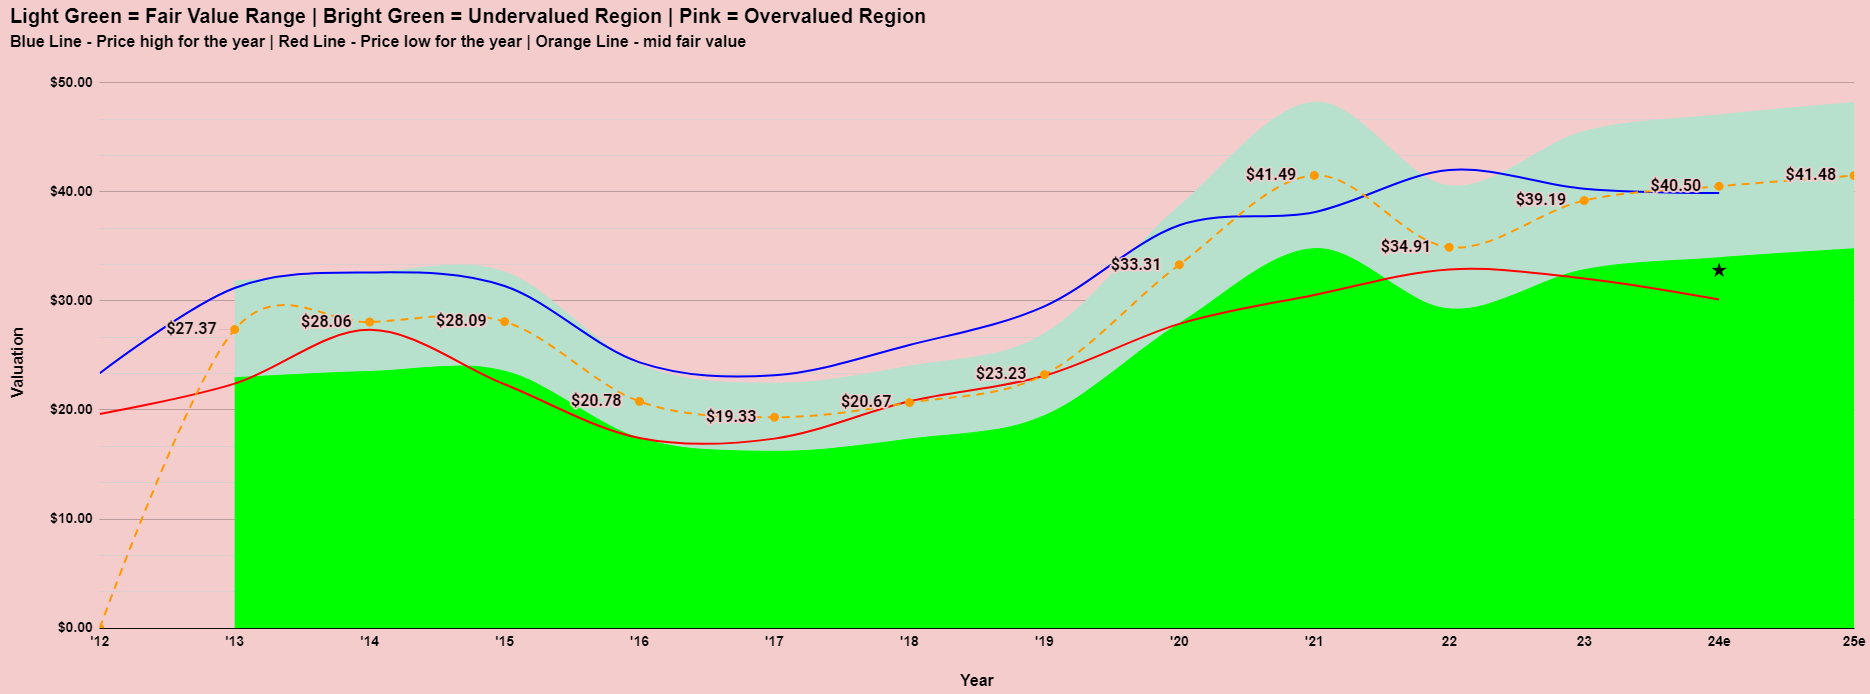
Valuation
Both Neuren and Arcadia Pharmaceuticals have faced challenges in 2024. Analysts still view Arcadia as undervalued, with a consensus 12-month price target of $25.11 from 19 analysts. Similarly, Neuren’s price target stands at $26.77 from 7 analysts.
Neuren trades at 17.5x expected earnings, a low multiple compared to other ASX biotech companies like CSL (43x), RMD (39x), COH (44x), TLX (42x), and PNV (200+x). While analysts project around 30% growth in revenues and EBITDA this year, it would appear the market is cautious and perhaps a bit sceptical about these forecasts.
Short Positions
The short positions in Neuren have increased steadily throughout 2024. They currently sit at 93rd on the list of most shorted companies. Some are clearly betting that things are only going to get worse for Neuren from here.

Final thoughts
Despite Neuren Pharmaceuticals’ significant achievements in 2023, including the successful launch of DAYBUE and positive clinical trials, challenges in 2024 have dampened optimism. A critical short-seller report and slower-than-expected sales growth have put pressure on the stock. Nevertheless, analysts see potential upside, given Neuren’s strong growth prospects and relatively low valuation compared to its peers. This suggests the current share price may not fully reflect the company’s future potential.
Disclaimer: This information is provided purely for educational purposes. It takes no account of an individual’s personal financial circumstances and hence can in no way constitute financial advice. The above data may be subject to errors or inconsistencies for which the author takes no liability. It is imperative that all investors do their own research or if they need advice, seek it from a qualified financial adviser.
What’s happened to Neuren Pharmaceuticals (ASX:NEU)?
Vysarn (ASX:VYS) Analysis
This is a restricted members post.
Regis Healthcare (ASX:REG) Analysis
This is a restricted members post.
Mineral Resources (ASX:MIN) Analysis
This is a restricted members post.
Data#3 (ASX:DTL) Analysis
Initial Financial and Technical Screening
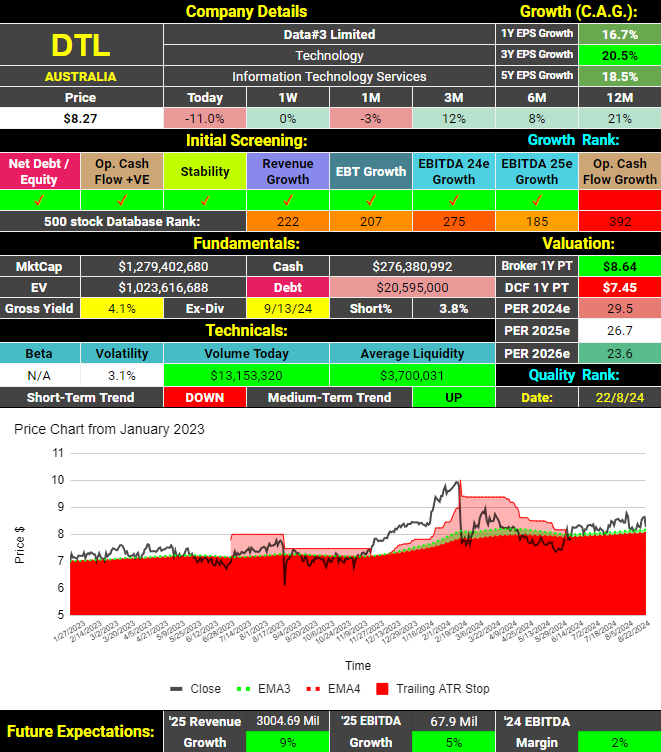
Data#3 (ASX: DTL) receives 7 out of 8 possible ticks in the initial screening. The company is growing and is expected to continue to do so; however, their last report showed a decline in operating cash flows. They have a grossed-up dividend yield of 4.1%, and debt levels are very low. They released results yesterday (August 21st), and the shares had a strong day, but all gains were reversed today following updates from brokers. Nevertheless, they’ve had a strong 12 months, with the share price up 21% in that time. Data#3 has a short position of 3.8% which, while not huge, is significant and shows that some don’t believe this stock has a bright future.
Fundamental Analysis
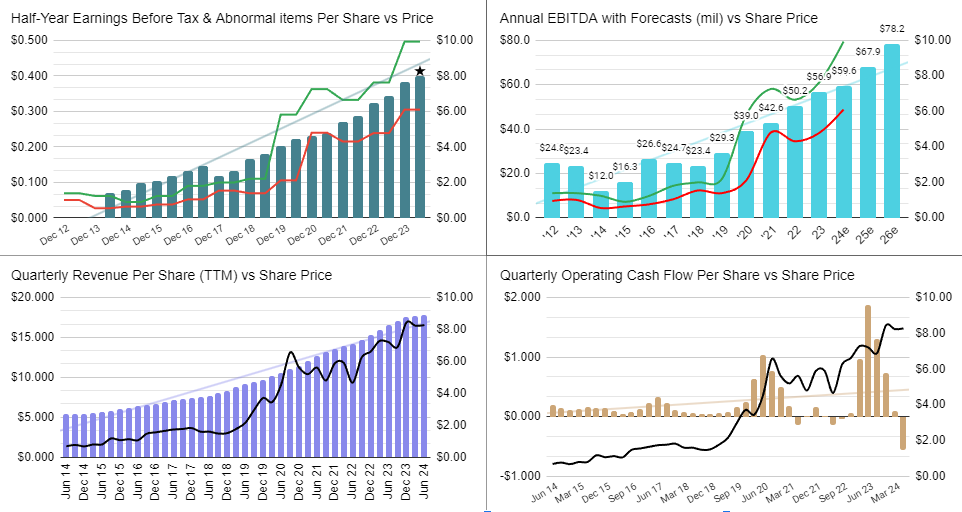
Earnings, EBITDA, and revenues paint a beautiful “bottom left to top right” picture. However, operating cash flows are much more volatile for this business, and there appears to be some correlation between the share price and operating cash flows. The latest decline in this measure may have contributed to the weakness in the share price today.
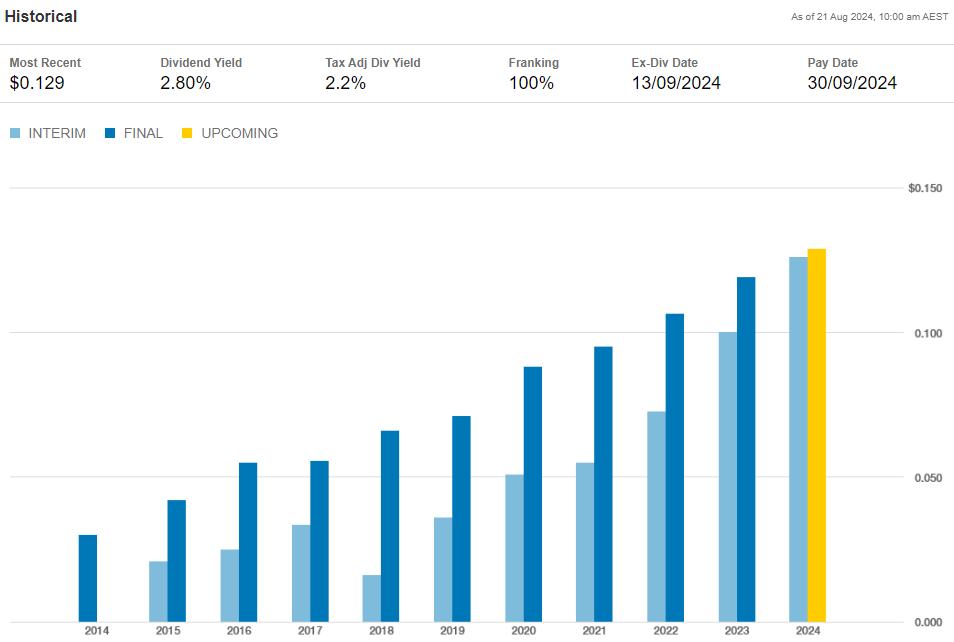
The company has an impressive and consistent history of increasing dividends.
Quality Assessment
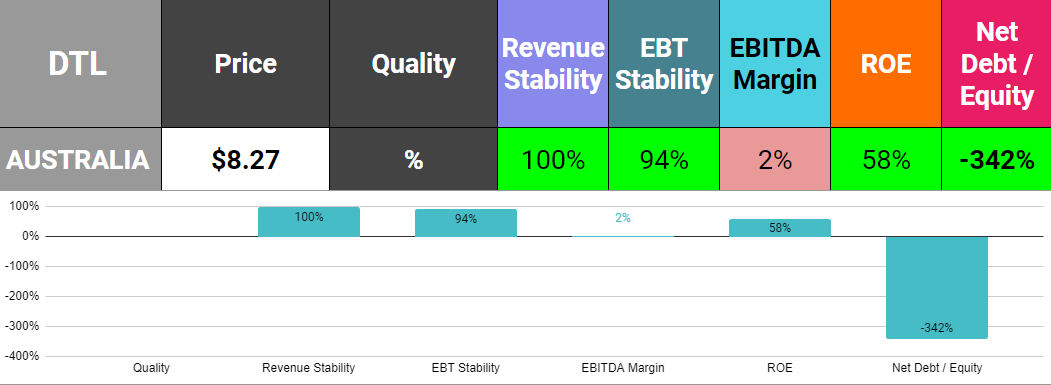
As noted above, Data#3 has a history of incredible consistency in revenue and earnings growth. The ROE is very high, and they have more cash than debt. The only downside is that they operate on very low margins suggesting perhaps that they operate in a very competitive market. Overall, this is a medium to high-quality company.
Valuation Considerations
Historically, this is not a company that has been valued highly. Until 2019, the average P/E ratio was around 15. Since then, the market has been willing to pay more, with Data#3 now trading at a P/E ratio of 29.5. I would argue it was more undervalued back then than overvalued today. For instance, over the past five years, Data#3 has increased earnings at a compound annual rate of 18.5% while consistently paying a healthy dividend. A P/E ratio of 15 would significantly undervalue this company. However, analysts are forecasting slower growth moving forward, with EPS growth of 10.7% in 2025 and 12.9% in 2026, making the current P/E ratio of 29.5 seem rather high.
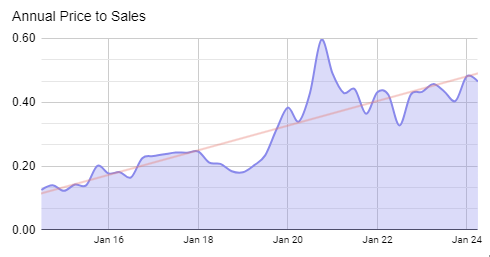
We can see the increase in valuation when we look at the Price to Sales chart over time too.
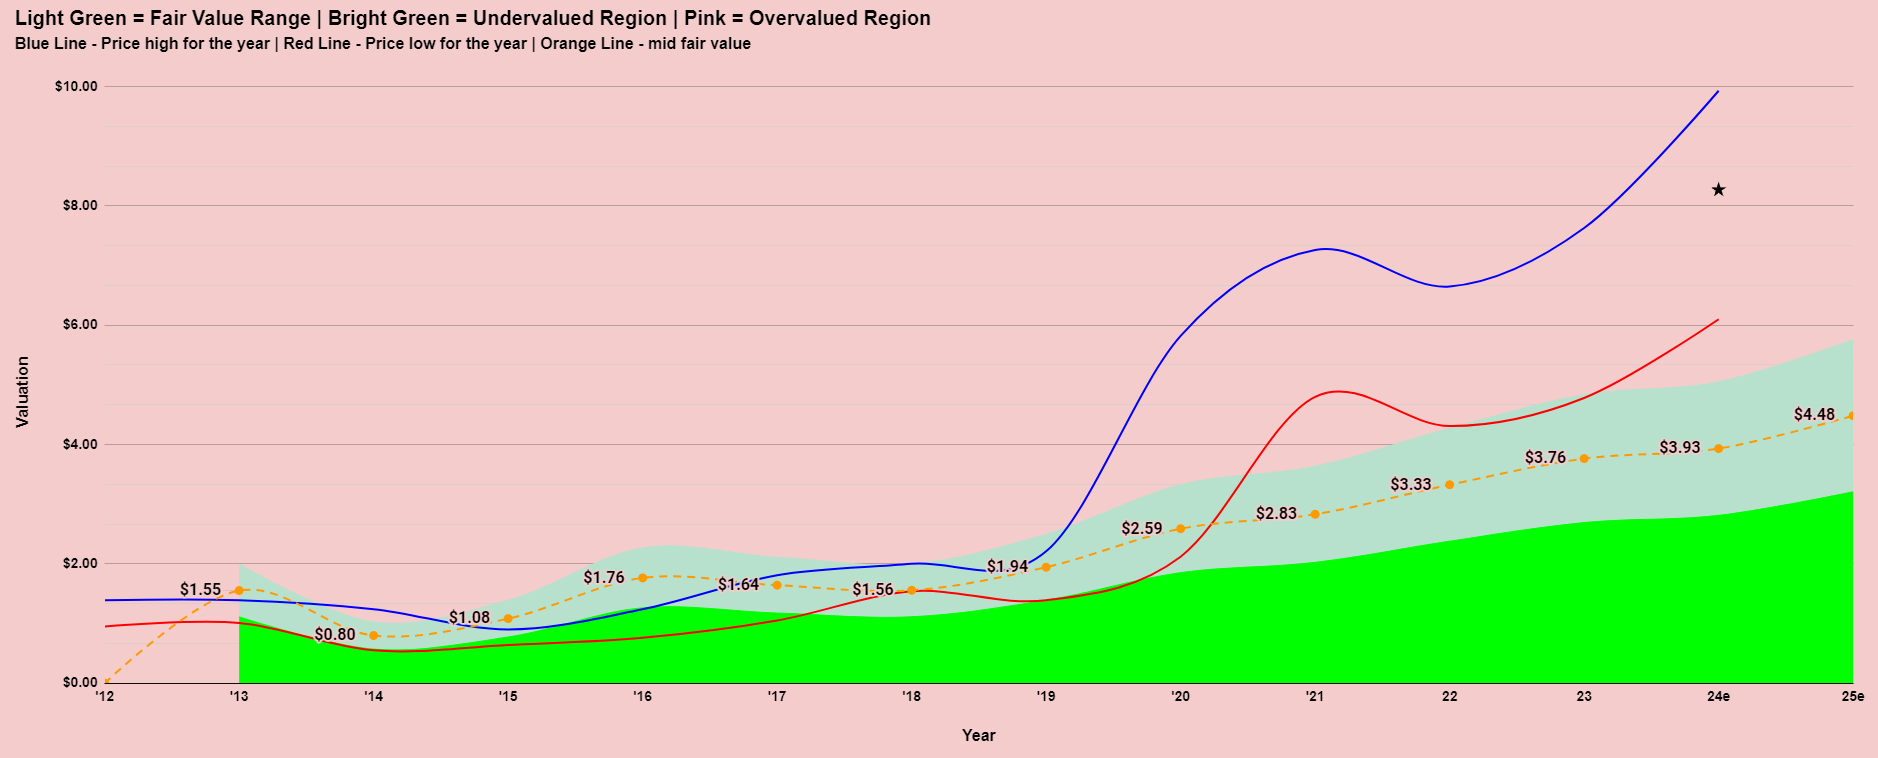
The valuation model, which compares the company’s current value to its historical valuation, shows that Data#3’s current price is significantly above historical norms.
Brokers have a price target of $8.64 compared to a closing price of $8.27. The shares would need to rise 4.5% to close that gap.
Technical Analysis
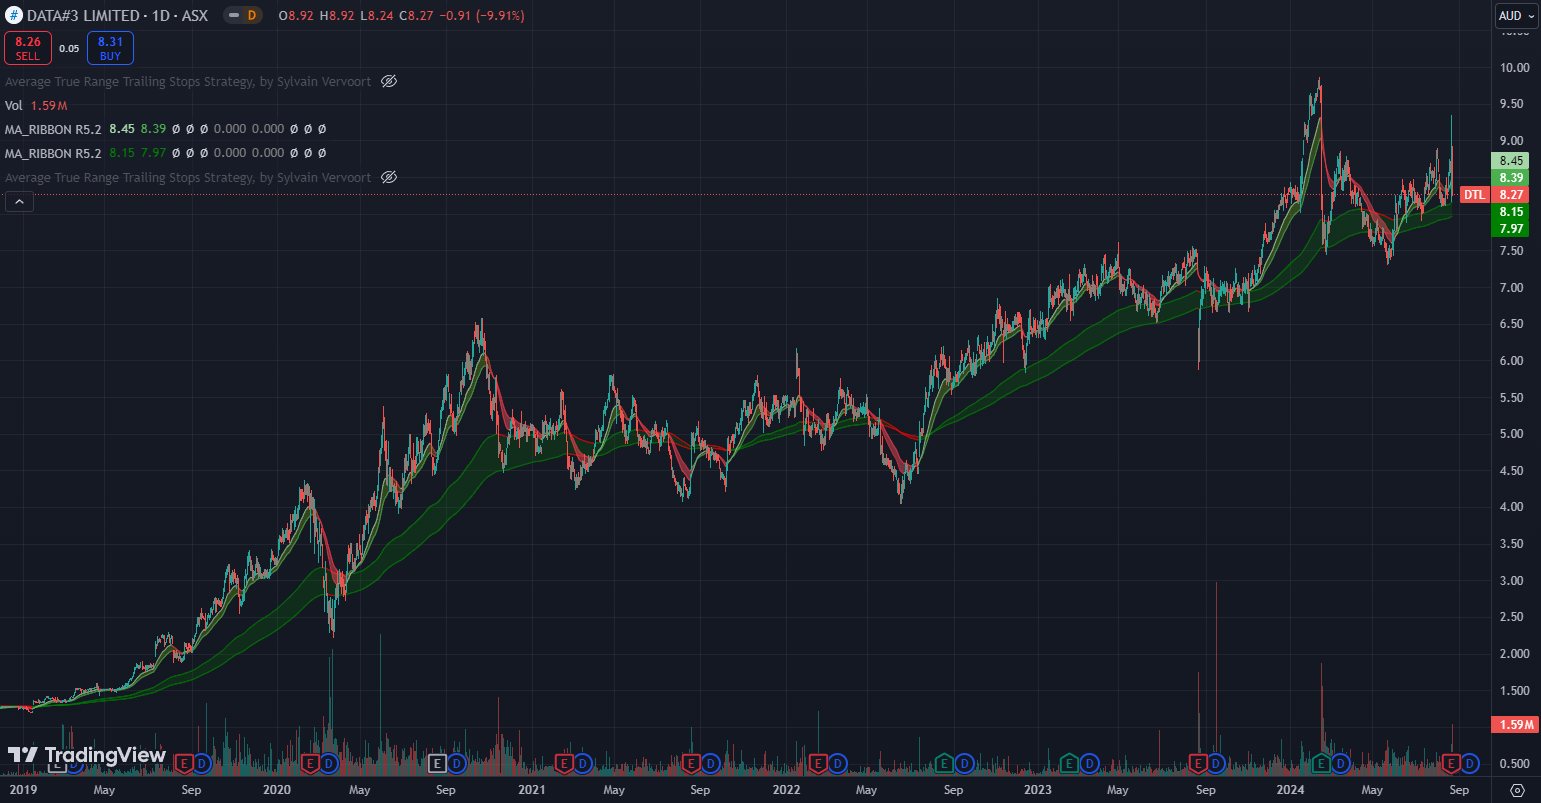
The long-term price chart for Data#3 is strong, with shareholders benefiting from both earnings and valuation expansion. The medium-term uptrend, as represented by the long-term moving average ribbon, remains intact.
Data#3 As A Way To Play The AI Theme?
According to ChatGPT, these are the pro’s for investing in this company as means of playing the AI theme:

These are the cons:

Concluding Statement
Data#3 (ASX: DTL) demonstrates strong and consistent growth in earnings and revenue, supported by a robust history of dividend increases and a high ROE. However, the company’s valuation has expanded significantly in recent years, and while the fundamentals remain solid, the current price appears to be above historical norms. This could suggest that future growth expectations are already priced in, warranting caution for new investors despite the company’s past performance.
ABOUT STOCKS UNDER THE HOOD
If you’re an active investor or would like to become one, Stocks Under The Hood is your ideal companion. I provide a wealth of educational resources, including detailed company dashboards, in-depth reports, and model portfolios. My goal is to help you cut through market noise with clear, actionable insights and educational content, empowering you to make informed investment decisions. With a strategic, growth-focused approach, I guide you toward the best opportunities in the market.
A FREE 14 Day TRIAL is available enabling you full access to the site (just provide your name and email address – no credit card is required). You will then be able to view all of the Stock Reports, Company Dashboards, and two Model Portfolios. ALSO, request ONE STOCK OF YOUR CHOICE from the Australian or US market and I will do a full stock report for you.

Disclaimer: This information is provided purely for educational purposes. It takes no account of an individual’s personal financial circumstances and hence can in no way constitute financial advice. The above data may be subject to errors or inconsistencies for which the author takes no liability. It is imperative that all investors do their own research or if they need advice, seek it from a qualified financial adviser.
Data#3 (ASX:DTL) Analysis
Netwealth Group (ASX:NWL) Analysis
This content is restricted to Supporters. Please Sign In.
Not a member? Follow the for a Free 14 Day Trial (no credit card required).
Nu Holdings NYSE:NU Analysis
This is a restricted members post.
Biome Australia (ASX:BIO) Analysis
This is a restricted members post.
Findi (ASX:FND) Analysis
Initial Financial and Technical Screening
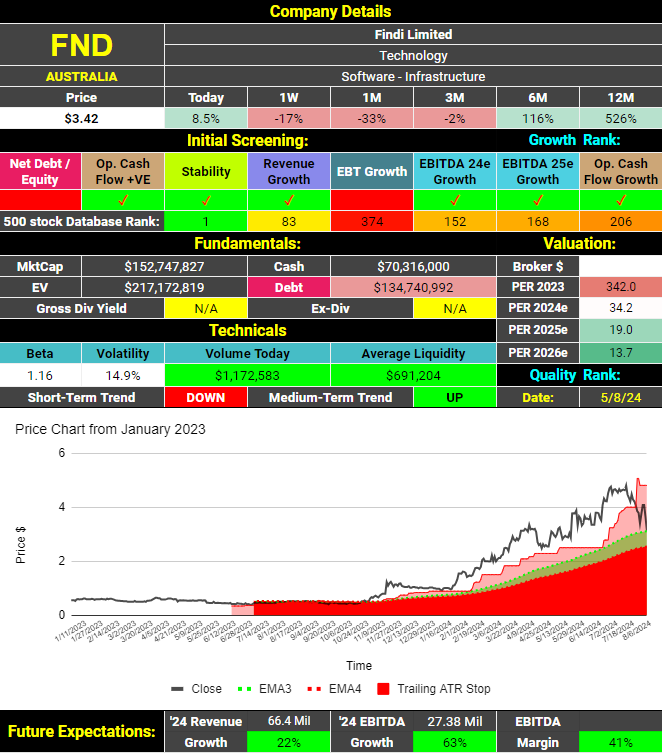
The latest report shows an increase in operating cash flows and revenues on a trailing 12-month basis. The company maintains a strong cash position and chooses to reinvest in the business rather than paying dividends. Analysts forecast EBITDA growth for 2025, although at a more moderate level compared to 2024. The stock currently has a P/E ratio of 34, which isn’t cheap, but strong growth is anticipated. This suggests that the valuation could improve significantly over the next couple of years.
Technically, the medium-term price trend remains upward, though the short-term trend has recently turned negative. Despite a decline of over 33% in the past month, the shares are still up an impressive 526% compared to 12 months ago. The only notable downside is that the company failed to increase earnings before tax and abnormal items in the last report.
Fundamental Analysis
Findi listed on the ASX in 2007 as Vortiv and rebranded on August 24, 2022.
Since the rebranding, revenues and operating cash flows have shown steady and consistent growth.
Likewise, EBITDA and Earnings Per Share (EPS) have been increasing and are forecast to continue to do so.
The company has financed its expansion through a mix of cash flows, equity, and debt. Shareholders have experienced significant dilution more recently mainly due to the conversion of options.
Findi (ASX:FND) does not feature at all on the ASX list of most shorted stocks. With a market cap of only ~$150M, it’s too small.
Quality Assessment
So far revenues have increased every time since the company changed its name to Findi. Earning before tax and abnormal items have been more inconsistent. Margins and return on equity (ROE) are acceptable and, more importantly, improving. The company is funding some of its expansion with debt but with positive cash flows and a healthy cash balance, this is of no concern at this time. Overall, Findi is an emerging company that could currently be classified as medium quality. However, if its current trajectory continues, it could be considered high quality in the coming years.
Valuation Considerations
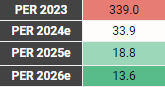
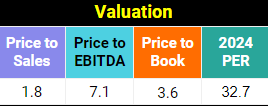 All of these metrics look reasonable for an emerging growth company. Based on analyst projections, the price-to-earnings ratio (PER) is expected to fall below 20 next year and under 15 the following year. Of course a lot can happen between now and then and being a small company, there may only be one analyst covering it. I cannot apply my valuation model to Findi as it has not been listed long enough.
Recent News From The Company
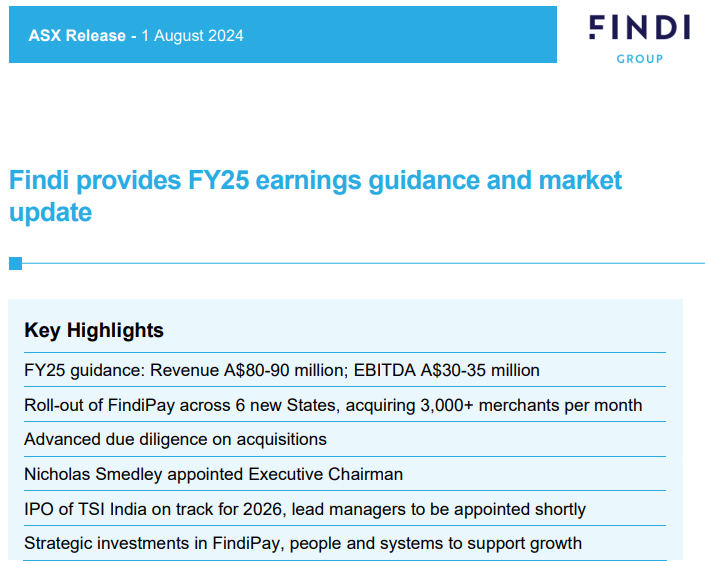
The company recently raised its revenue guidance while maintaining its EBITDA forecast. This suggests additional revenues may be allocated to expansion costs. The upcoming Indian IPO offers potential benefits and risks. It could lead to shareholder dilution but might also result in a higher valuation multiple. The success of the IPO will depend on the prevailing conditions in the Indian stock market. While the market has been buoyant recently, conditions could change.
Technical Analysis
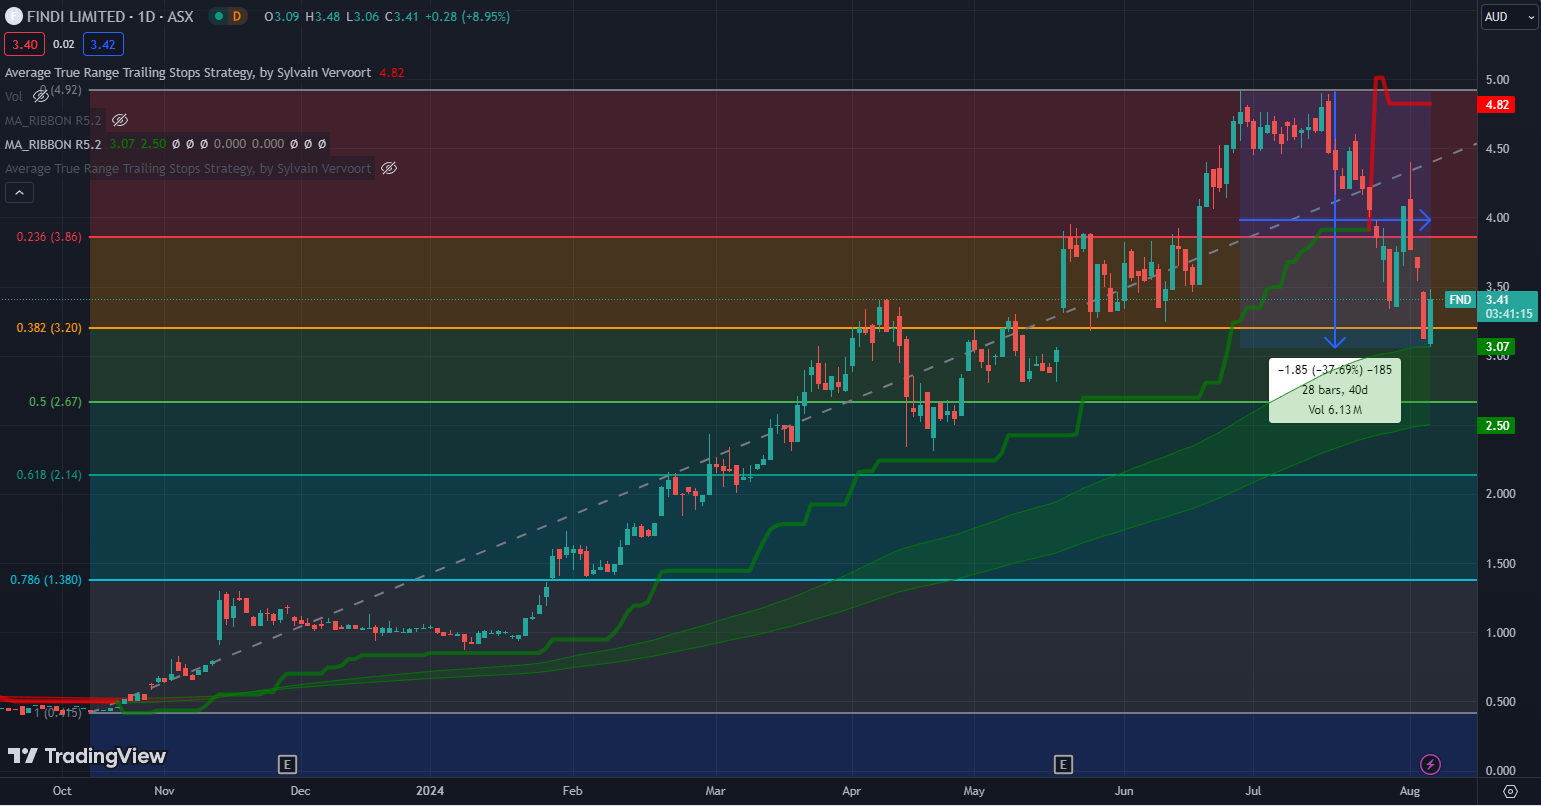
Findi’s share price rose significantly from October 2023 to July 2024. However, it has since fallen 37% over 39 days. The short-term uptrend has paused, with the share price recently finding support around $3.20. This level aligns with the 38.2% Fibonacci retracement level. Investors will hope for a bounce and a move back toward the $3.86 level. If this support fails, the next level to watch is $2.67, which aligns with the 50% retracement level. The medium-term uptrend remains intact for now.
Concluding Statement
Findi Limited (ASX: FND) has strategically shifted its focus to Indian operations, particularly through its substantial stake in TSI India. The company’s consistent growth in revenues, operating cash flows, and earnings demonstrates a strong upward trajectory, despite some shareholder dilution from increased equity. With a P/E ratio expected to drop below 20 next year, the market may not yet fully appreciate Findi’s growth potential. The recent 37% decline in share price has brought the stock to a more attractive valuation level, potentially offering an entry point for investors confident in the company’s long-term prospects.
The upcoming Indian IPO represents a pivotal moment for Findi, presenting both opportunities and risks. A successful IPO could unlock a higher valuation multiple and provide additional capital for expansion, though it also carries the potential for shareholder dilution and the effects of market volatility in India. Overall, while Findi faces some near-term uncertainties, its strong financial foundation and strategic focus on the high-growth Indian e-transactions and payments market position it well for future success. The growth outlook for this emerging fintech company remains promising.
ABOUT STOCKS UNDER THE HOOD
If you’re an active investor or would like to become one, Stocks Under The Hood is your ideal companion. I provide a wealth of educational resources, including detailed company dashboards, in-depth reports, and model portfolios. My goal is to help you cut through market noise with clear, actionable insights and educational content, empowering you to make informed investment decisions. With a strategic, growth-focused approach, I guide you toward the best opportunities in the market.
A FREE 14 Day TRIAL is available enabling you full access to the site (just provide your name and email address – no credit card is required). You will then be able to view all of the Stock Reports, Company Dashboards, and two Model Portfolios. ALSO, request ONE STOCK OF YOUR CHOICE from the Australian or US market and I will do a full stock report for you.
Disclaimer: This information is provided purely for educational purposes. It takes no account of an individual’s personal financial circumstances and hence can in no way constitute financial advice. The above data may be subject to errors or inconsistencies for which the author takes no liability. It is imperative that all investors do their own research or if they need advice, seek it from a qualified financial adviser.
Findi (ASX:FND) Analysis
Kelly Partners Group (ASX:KPG) Analysis
This is a restricted members post.
CSL (ASX:CSL) Analysis
About
CSL Limited (ASX:CSL) is a global biopharmaceutical company based in Melbourne, Australia. Founded in 1916, it develops, manufactures, and markets biotherapies, vaccines, and blood plasma products. The company operates through two main segments: CSL Behring, which focuses on plasma-derived therapies for conditions like hemophilia and immune deficiencies, and Seqirus, which specializes in influenza vaccines. CSL Behring also plays a key role in recombinant protein and monoclonal antibody treatments for chronic and acute conditions. Known for innovation, CSL invests heavily in research and development, expanding its pipeline with gene therapies and novel vaccines. With operations in over 30 countries, it serves global markets, delivering life-saving and life-improving treatments.
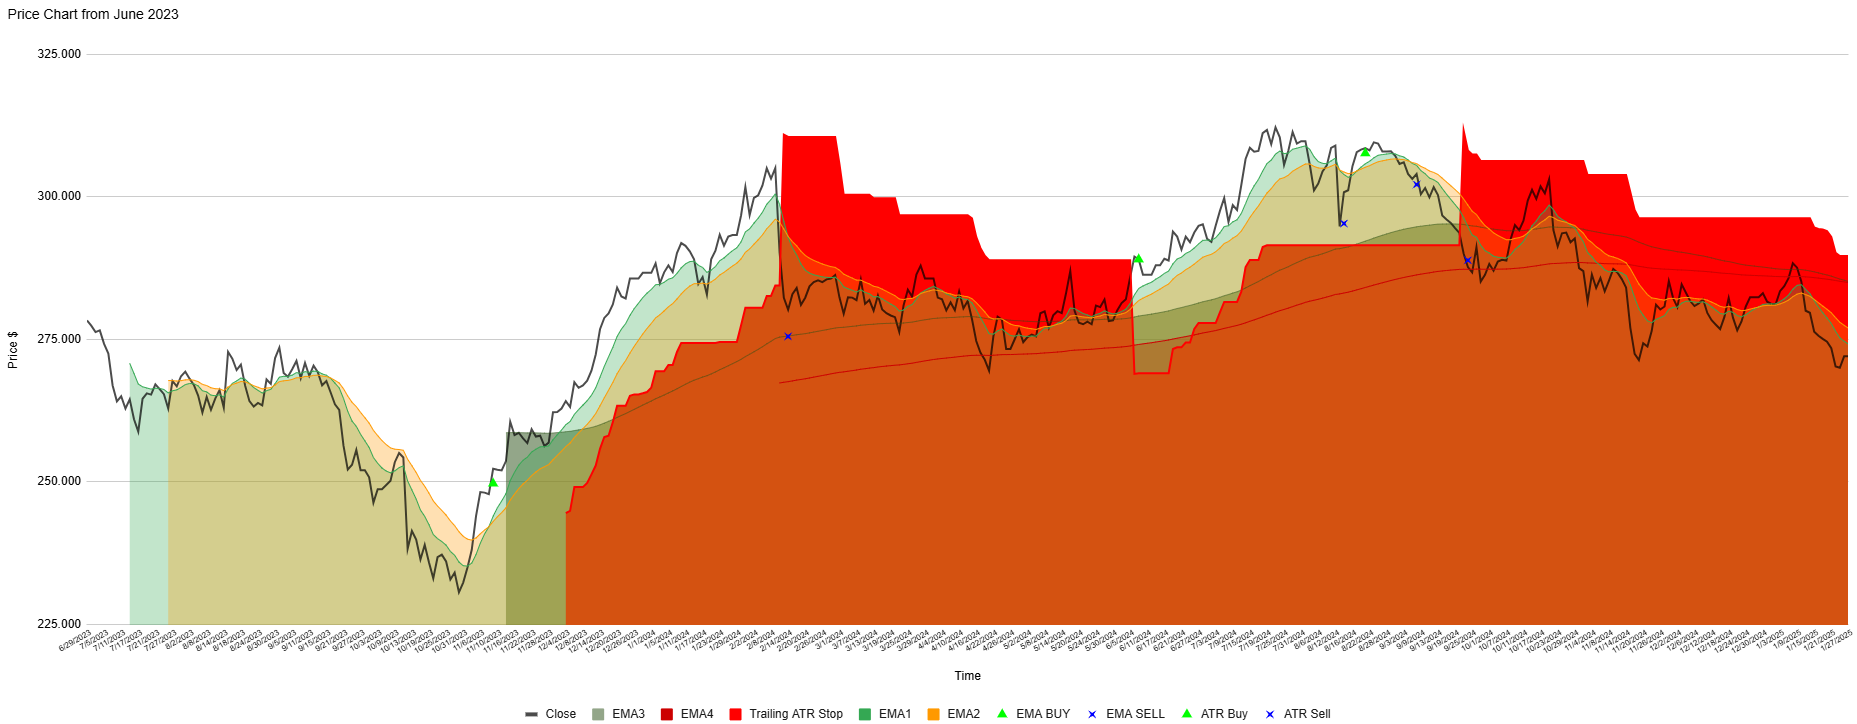
Update January 27, 2025
The price chart of CSL today is basically where it was at the start of the chart period. In that time, two profitable short-term trades have been generated by the 3EMA and ATR indicators with one losing trade. There are currently no open trades suggested as the share price is trending lower again.
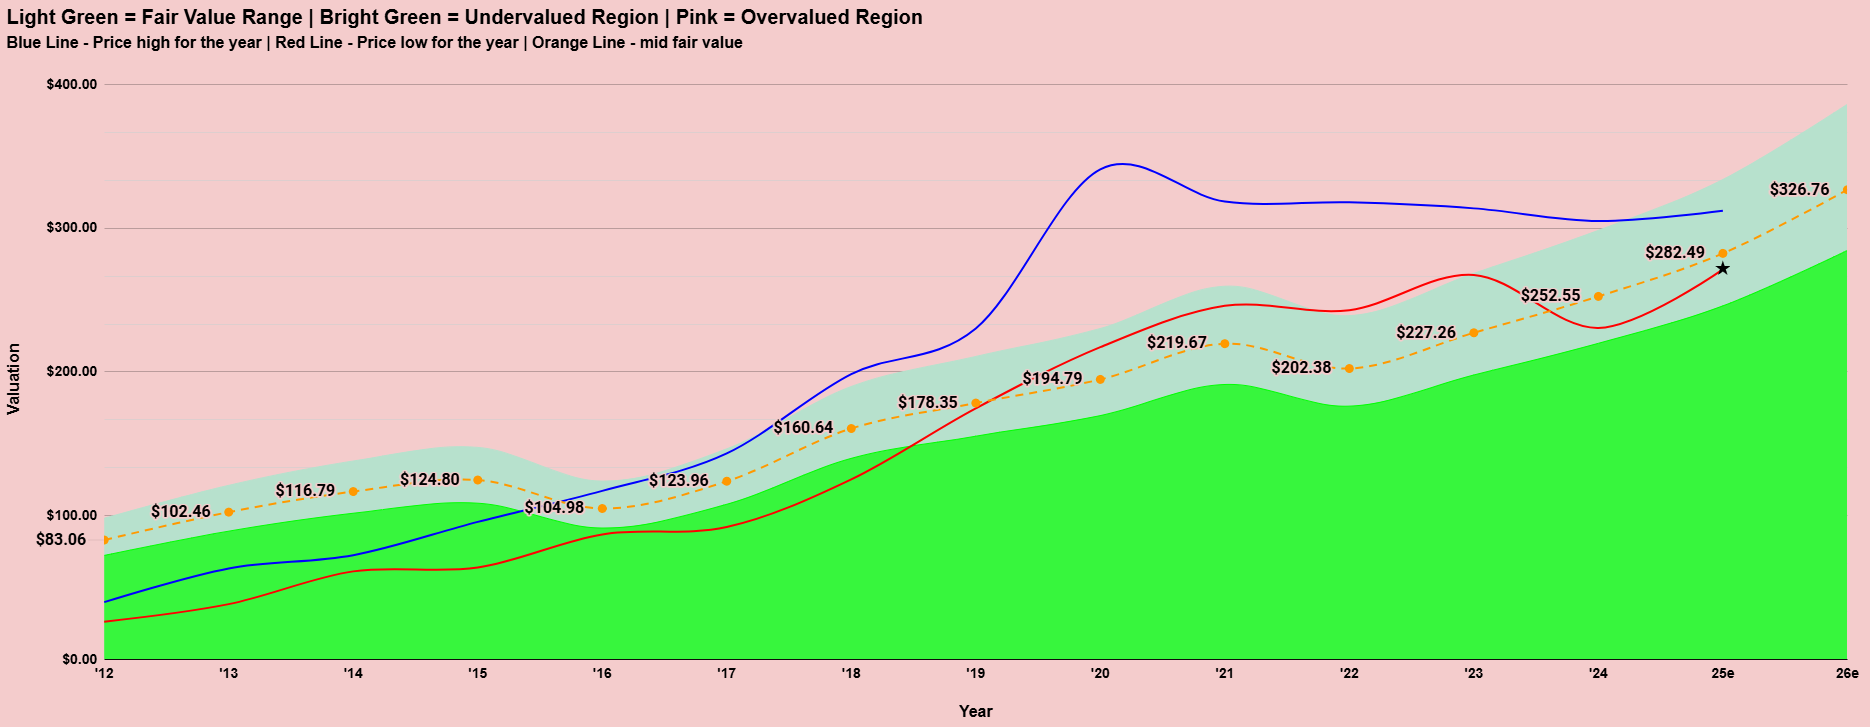
Overall, CSL has actually been in a sideways trading pattern since 2020 as can be seen on the valuation model chart below. In 2020, the valuation was over $100 above the model suggestion for fair value. After 4 solid years of consolidation, earnings have now caught-up and to the point where we now find CSL trading a little below fair value. If CSL can deliver some growth when it next reports around February 11, it might just be ready to start a new uptrend.
*** end update
Update September 16, 2024

The latest result was ok but not enough to push CSL up and out of the sideways pattern it has been trading in since 2020. The growth outlook is for lower growth than was expected in 2024. The acquisition from a couple of years ago has not delivered as they had hoped. The rest of the business continues to perform well. If they can get the Vifor acquisition to deliver, that would probably be the catalyst to see them move into an uptrend once again.

For now, there doesn’t appear much value here with a PER in the 40’s and forecast growth of just 14% in EBITDA and a grossed up dividend yield of just 1.4%. The valuation model which is based on how the market has been prepared to value the company in the past, suggests shares are trading close to fair value. The analysts love it though, suggesting the shares should be around 10% higher than they are today.
*** end update
Initial Screening

CSL (ASX:CSL) earns a tick on all 8 initial screening metrics. Revenue and earnings are again expected to have grown when they next report their results on August 13. The share price has recently moved into an uptrend based on the short and medium term moving averages although it remains within a longer term range. This has seen it move above the average broker price target. This is after an extended period of sideways price movement. It pays a small dividend and have a small amount of debt relative to its size.
Fundamental analysis
CSL (ASX:CSL) had been a great performer for investors over a number of years until the share price peaked in February, 2020. Despite the peak coming in 2020, the shares showed continued growth in earnings up until 2022. A fall for a year then saw a return to growth in 2023. Analysts are forecasting further growth in the years ahead.

CSL (ASX:CSL) is a growth stock, albeit there are many growing faster in my database.
CSL (ASX:CSL) is ranked #302 on the ASX Most Shorted Stocks List. 0.4% of its shares are currently short sold. This is insignificant.
Quality Analysis

Debt and shares on issue were reducing until 2022 when the company made an acquisition. Nevertheless, debt remains at conservative levels. It’s also encouraging to see that CSL has shown the desire to reduce debt in the past.
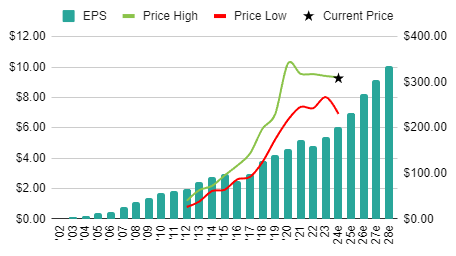
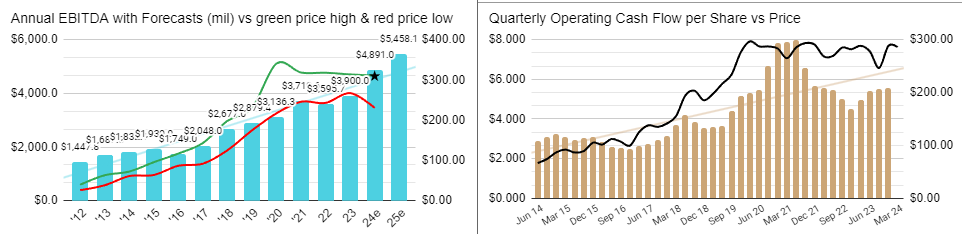
Zooming out, we can see that the company has been an incredible earnings grower for over 20 years. Analysts don’t see any reason why this won’t continue from here.
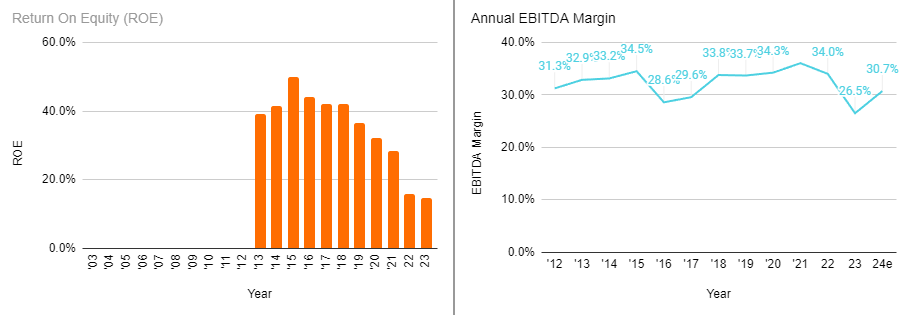
Return on Equity (ROE) has been falling since 2014. This could partially be explained by the declining debt in the company over that time. However, ROE failed to bounce back in 2023 despite the addition of some debt once again. EBITDA margins have hovered roughly between 30 and 35% although they were 26.5% in the last results. The market is forecasting them to bounce back when they next report.

The company reports an increase in earnings 87% of the time. Earnings before tax and excluding abnormal items is less at 67%. Margins of 27% are below historical highs as is the ROE of 15%. Debt is manageable at 65%. As it stands today, CSL (ASX:CSL) can only be considered a medium quality company. In the past it would have been amongst the highest quality companies on the ASX but some key metrics have deteriorated in recent years.
Valuation
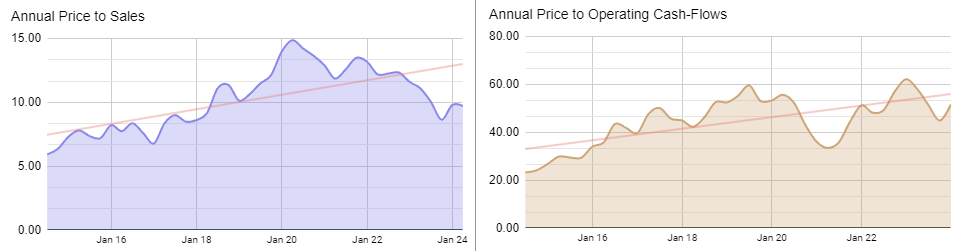
The long-term trend for Price to Sales and OCF to sales has been rising. Currently, the company sits comfortably below trend and certainly below previous highs for these metrics.
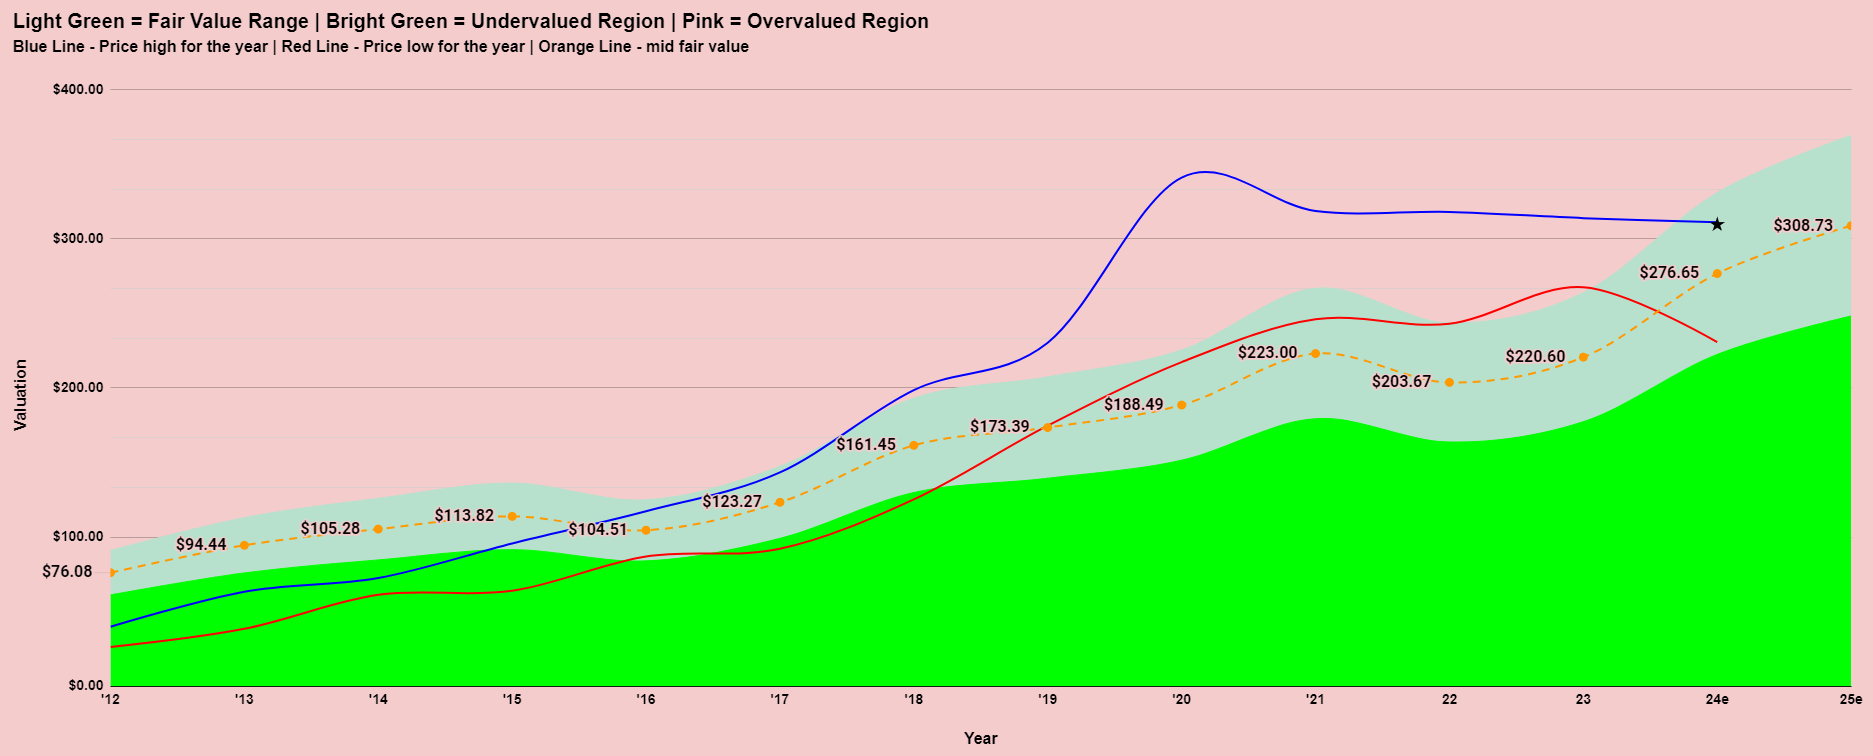
I think the valuation model tells the true story of this company and that is one of a valuation that got WAY ahead of itself. What followed from 2020 until today was an extended period of sideways price action as the market waited for the fundamentals to catch up. This year has seen the share price hovering in the fair value range once again.
Technical Analysis
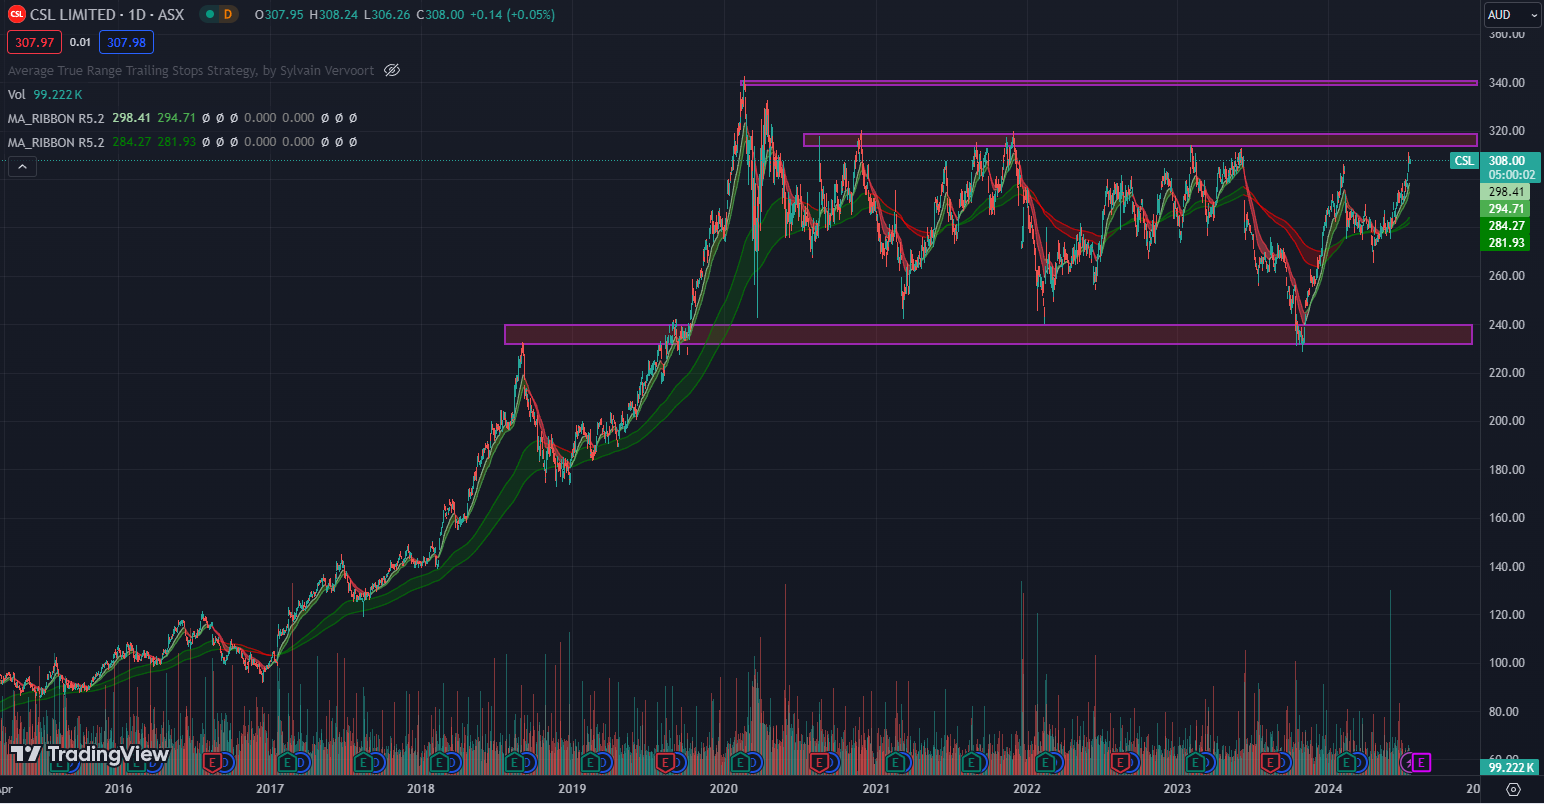
As explained above, the share price has essentially been moving sideways after the uptrend ended in 2020. The share price is once again making a move towards the top of the range. The difference this time is that shares are no longer significantly overvalued. Should it be able to show a good result when it next reports it may just be ready to create a new high and start a new uptrend.
News From The Company
There has not been a lot of news coming out of the company. The most recent is a presentation from April.
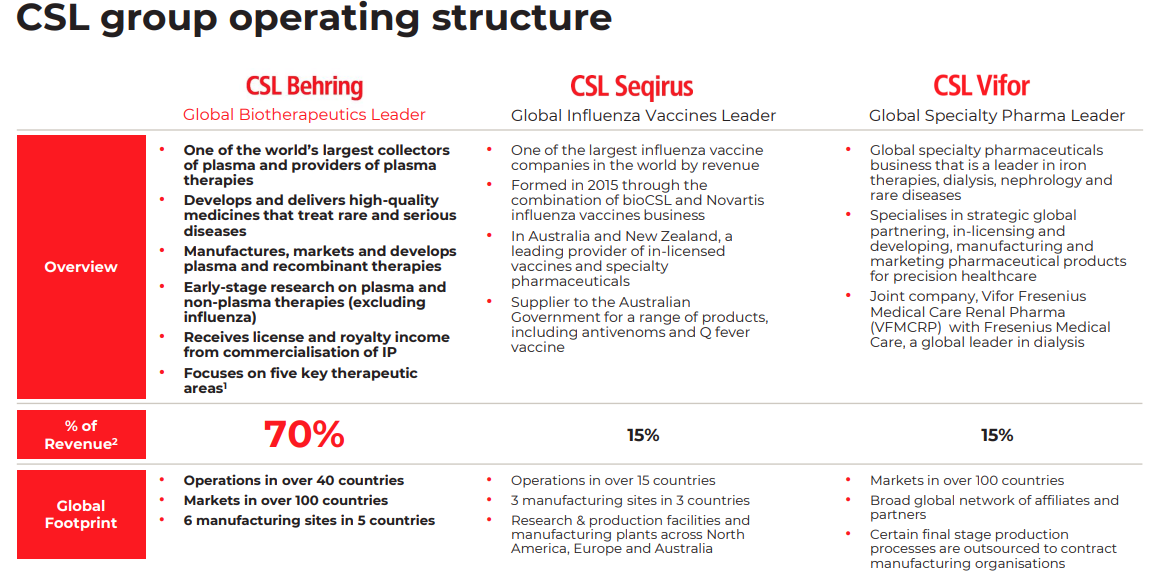
A lot of focus has been on the acquisition of Vifor. While this is clearly an important step for the company, it would not “break” them if it wasn’t as good as first thought. The CSL Behring division will always be the main driver with it comprising 70% of revenues.

Going back to their half year results presentation in February, we have this Outlook statement which would be assuring for investors if it is achieved.
Final thoughts on CSL (ASX:CSL)
CSL (ASX:CSL) experienced a period of overvaluation by the market, followed by years of consolidation, eventually bringing its valuation in line with fundamentals. Some quality metrics have declined due to COVID-19 disruptions and a less profitable-than-expected acquisition. However, the potential for the company to regain its former status remains.
Technically the shares have moved to the top of their 4 year range where once again they will attempt to break free and commence a new uptrend. This will need to be supported by fundamentals though. A strong outlook from the company in February could just be the catalyst for a meaningful move higher if achieved, when they report their full year results in August. A miss or a disappointing outlook could see them spend another year gyrating between ~$240 and ~$320.
Disclaimer: This information is provided purely for educational purposes. It takes no account of an individual’s personal financial circumstances and hence can in no way constitute financial advice. The above data may be subject to errors or inconsistencies for which the author takes no liability. It is imperative that all investors do their own research or if they need advice, seek it from a qualified financial adviser.
CSL (ASX:CSL) Analysis
Dalrymple Bay Infrastructure (ASX:DBI) Analysis
https://dbinfrastructure.com.au/
About the company
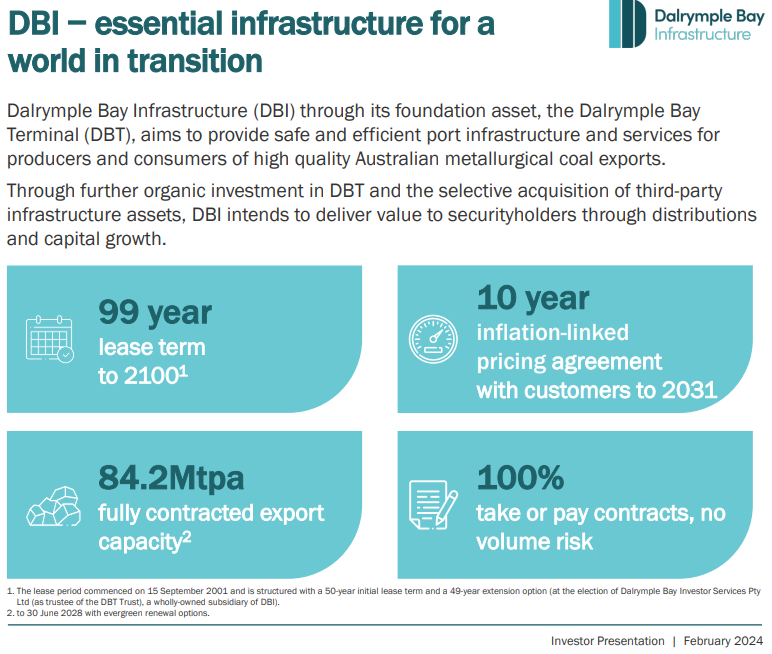
Dalrymple Bay Infrastructure Ltd. (DBI) is an Australian company that owns and operates the Dalrymple Bay Coal Terminal (DBCT) in Queensland, one of the world’s largest coal export facilities. Here are some key points about the company:
- Core Business: DBI’s primary asset is the Dalrymple Bay Coal Terminal, which handles, stores, and ships coal from the Bowen Basin coalfields to global markets. This terminal is critical for the export of metallurgical coal, which is used in steel production.
- Operations: The terminal has a significant capacity, capable of handling over 85 million tonnes of coal per annum. It operates under a long-term lease from the Queensland Government and provides services to multiple coal producers.
- Revenue Model: DBI generates revenue through user agreements with coal producers, who pay fees for the handling and shipping of coal. These agreements typically involve long-term contracts, providing DBI with stable and predictable cash flows.
- Financial Performance: DBI’s financial performance is closely tied to coal export volumes and global coal demand. The company benefits from the demand for high-quality metallurgical coal, particularly from Asian markets.
- Growth Potential: DBI focuses on optimizing and expanding terminal operations to increase capacity and efficiency. This includes investment in infrastructure and technology to support growing coal export volumes.
- Sustainability: DBI is committed to sustainable practices and adheres to environmental regulations. The company engages with stakeholders to ensure responsible and sustainable operations, considering the environmental impact of coal handling and shipping.
Initial Screening
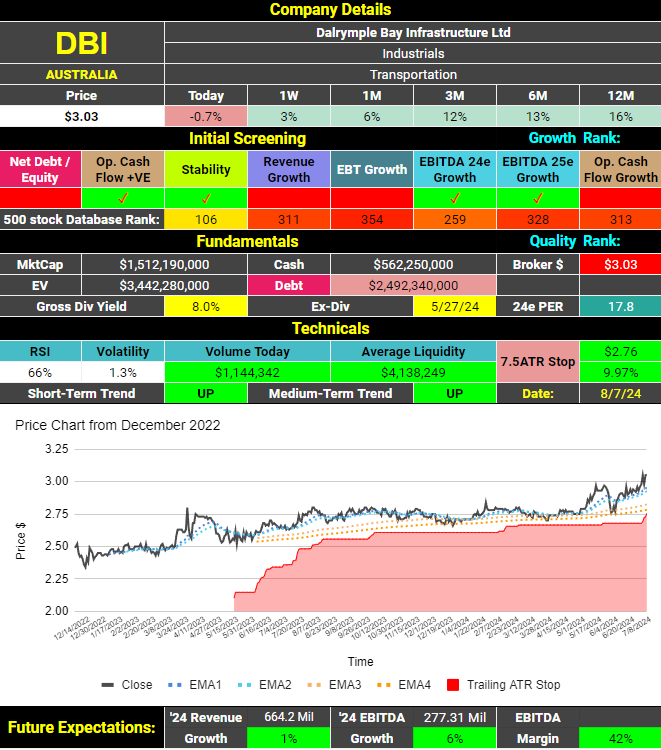
Dalrymple Bay Infrastructure (ASX:DBI) has a healthy grossed up dividend yield of 8% and an undemanding price earnings ratio (PER) of 17.8. Brokers see further growth in their revenues and earnings when they next report their results.
Fundamental analysis
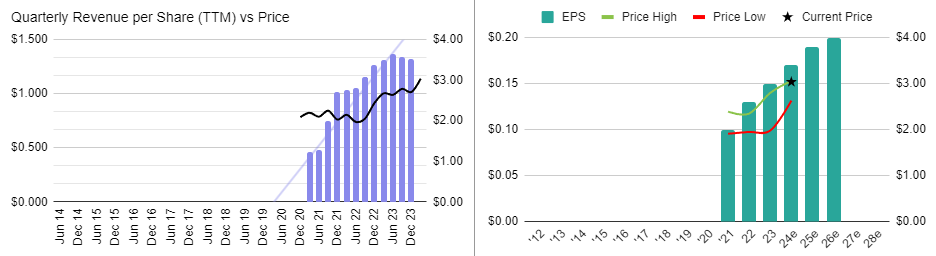
Dalrymple Bay Infrastructure (ASX:DBI) has been a strong performer in the short time it has been listed with brokers seeing no reason why that won’t continue.
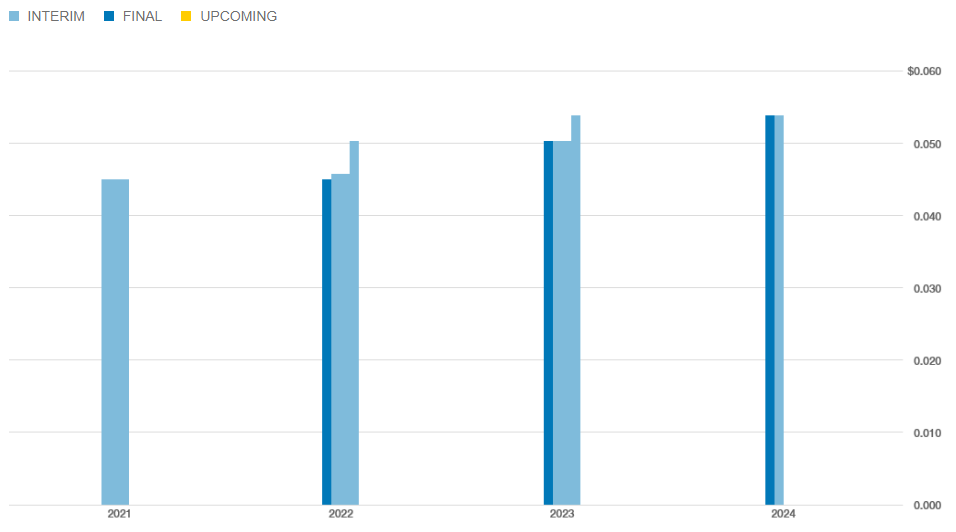
Dividends have been increasing steadily since listing.
Dalrymple Bay Infrastructure (ASX:DBI) is #619 on the ASX list of most shorted stocks. Short positions in this company are inconsequential.
Quality Analysis
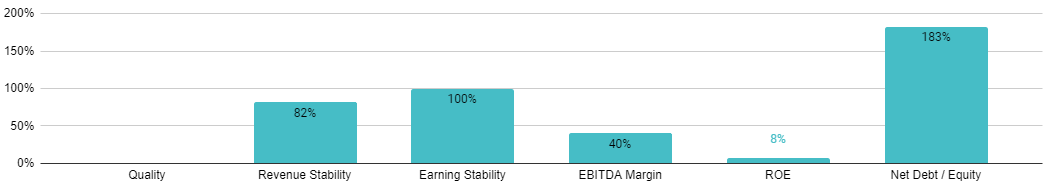
It’s still relatively early days as a listed company, but the signs are positive. Earnings and revenues have been steadily rising while margins are strong. Less positive is the fact the company does have a significant debt position and a modest return on equity. I would rate this a medium quality company.
Valuation
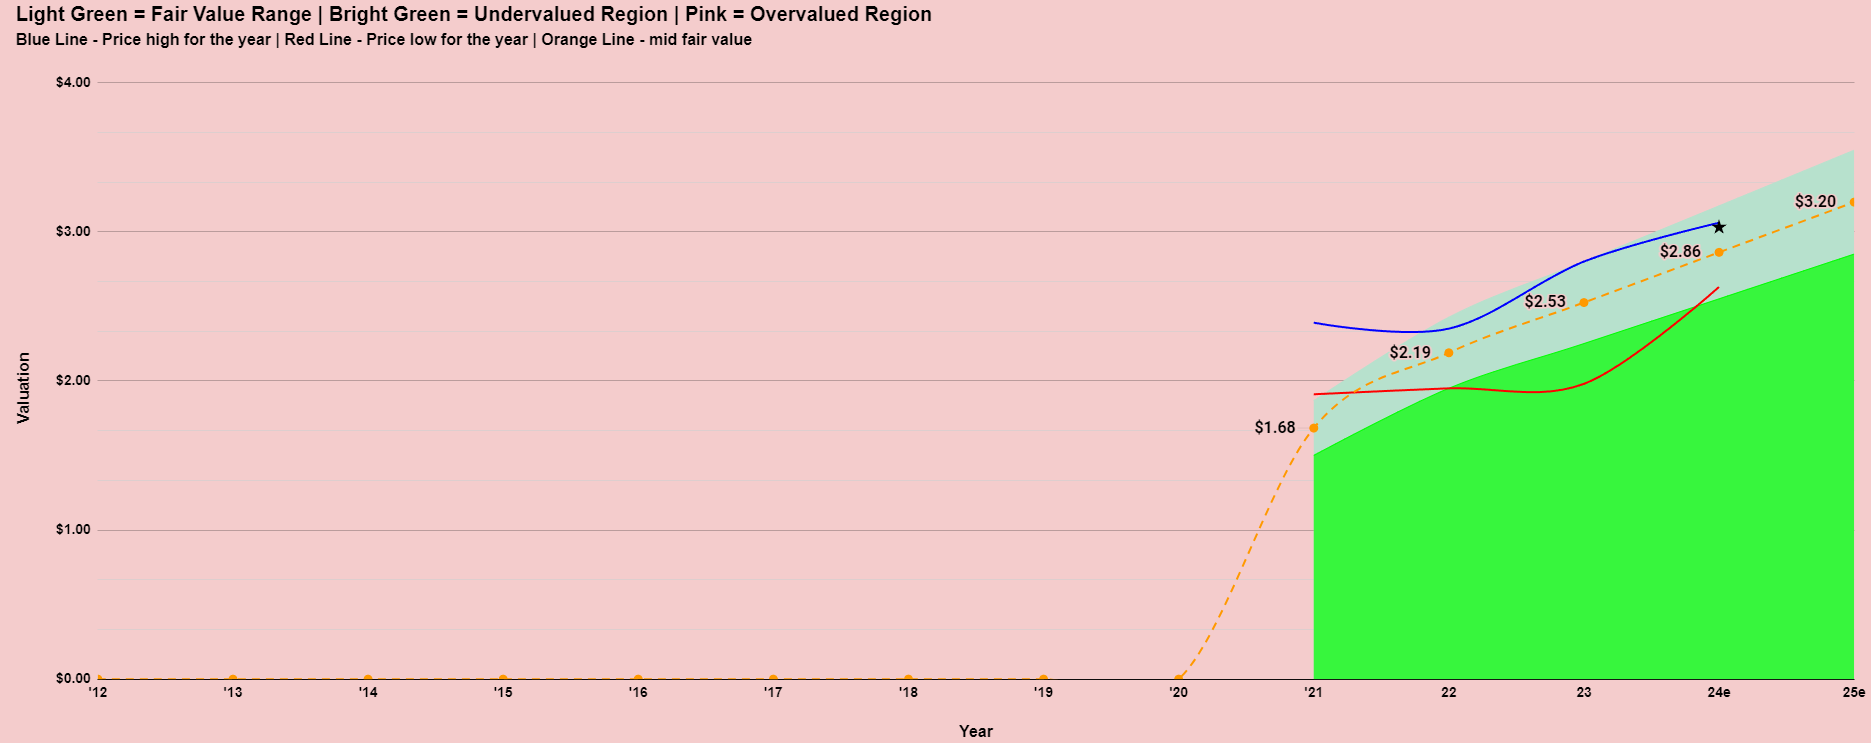
There isn’t a lot of history for the valuation model but the company doesn’t appear to be particularly cheap or expensive. A grossed up yield of around 8% is no doubt attractive to the dividend investor though.
News From The Company
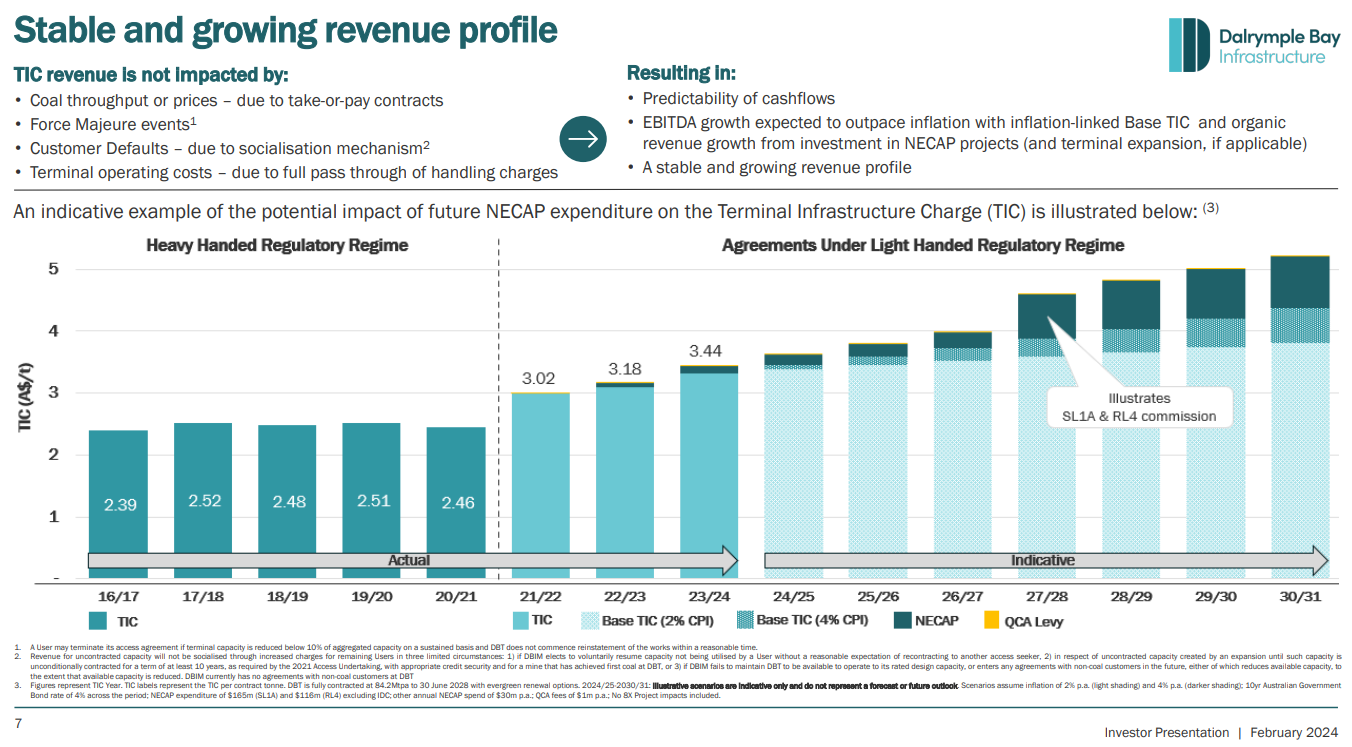
Incidentally, “TIC” stands for Terminal Infrastructure Charge. This charge is a core revenue component for DBI, representing the fees paid by customers for the use of the Dalrymple Bay Coal Terminal’s infrastructure. The Terminal Infrastructure Charge is a significant element of DBI’s income, supporting the maintenance and operation of the terminal and contributing to the company’s overall financial performance.
Technical Analysis
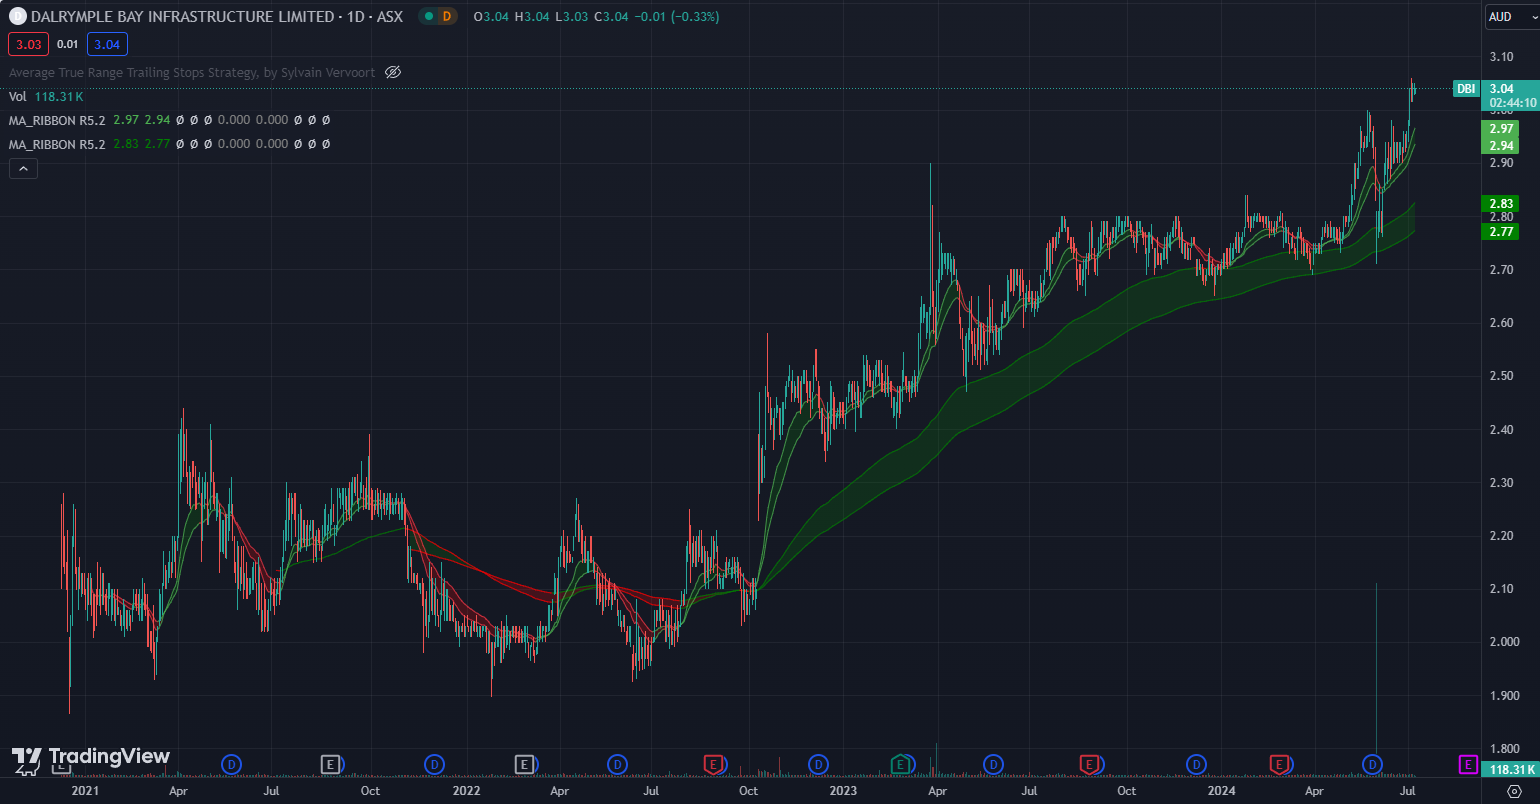
The chart is in a short and medium term uptrend and has been since the price broke out from a sideways patter in October 2022.
Final thoughts on Dalrymple Bay Infrastructure (ASX:DBI)
Dalrymple Bay Infrastructure (ASX: DBI) is highlighted as a compelling dividend stock due to its stable revenue from long-term user agreements at its coal terminal. Despite high debt, the company’s consistent cash flow supports a robust dividend yield, making it attractive for income-focused investors. Analysts appreciate DBI’s potential for reliable dividend returns, backed by steady demand for coal exports and strategic infrastructure investments.
ABOUT STOCKS UNDER THE HOOD
If you’re an active investor or would like to become one, Stocks Under The Hood is your ideal companion. I provide a wealth of educational resources, including detailed company dashboards, in-depth reports, and model portfolios. My goal is to help you cut through market noise with clear, actionable insights and educational content, empowering you to make informed investment decisions. With a strategic, growth-focused approach, I guide you toward the best opportunities in the market.
A FREE 14 Day TRIAL is available enabling you full access to the site (just provide your name and email address – no credit card is required). You will then be able to view all of the Stock Reports, Company Dashboards, and two Model Portfolios. ALSO, request ONE STOCK OF YOUR CHOICE from the Australian or US market and I will do a full stock report for you.
Disclaimer: This information is provided purely for educational purposes. It takes no account of an individual’s personal financial circumstances and hence can in no way constitute financial advice. The above data may be subject to errors or inconsistencies for which the author takes no liability. It is imperative that all investors do their own research or if they need advice, seek it from a qualified financial adviser.
Aristocrat Leisure (ASX:ALL) Analysis
This is a restricted members post.
Austin Engineering (ASX:ANG) Analysis
About
Austin Engineering Limited (ANG.AX) is an Australian-based global engineering company specializing in the design, manufacture, and supply of custom mining equipment and related services. Established in 1982, Austin Engineering focuses on creating innovative solutions for the mining industry, particularly in the areas of loading and hauling. Its product range includes off-highway dump truck bodies, excavator buckets, water tanks, and tyre handlers, all tailored to enhance productivity and safety in mining operations. The company operates through segments in the Asia-Pacific, North America, and South America, providing both proprietary products and repair and maintenance services. Austin Engineering has built a reputation for leveraging its engineering intellectual property and expertise to deliver customized solutions that meet the specific needs of mining companies, contractors, and original equipment manufacturers around the world.
Update September 15, 2024
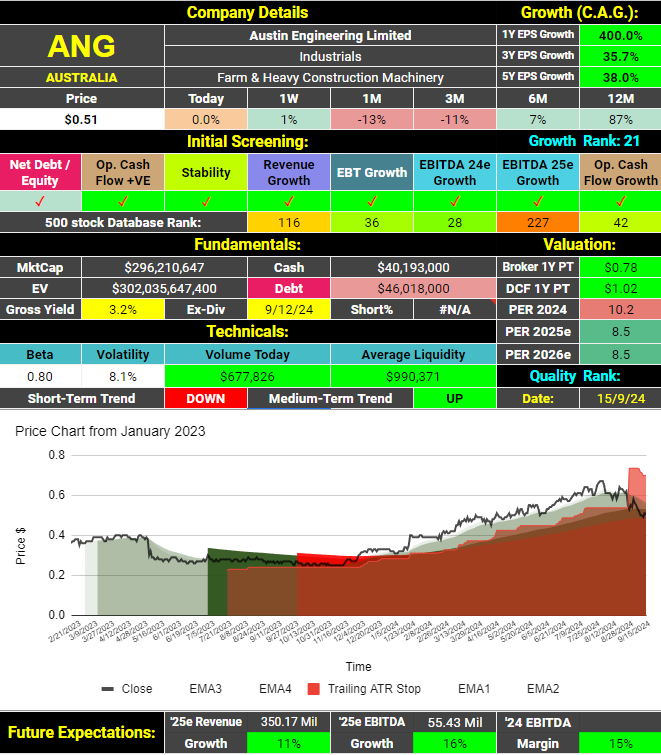
The full-year result announced in August has not been received well by the market. The share price has now moved in to a short-term down-trend. It does appear to have found some support at the medium-term duration moving averages. Growth from here is predicted to be slower than it was last year.
On a PER basis, the company appears cheap and the growth model agrees. The 2 analysts that cover Austin Engineering feel the shares are cheap with a consensus price target over 50% above the current price. Growth may be slowing but you would have to think the value investors out there would be getting interested in this company.
*** end update
Initial Screening
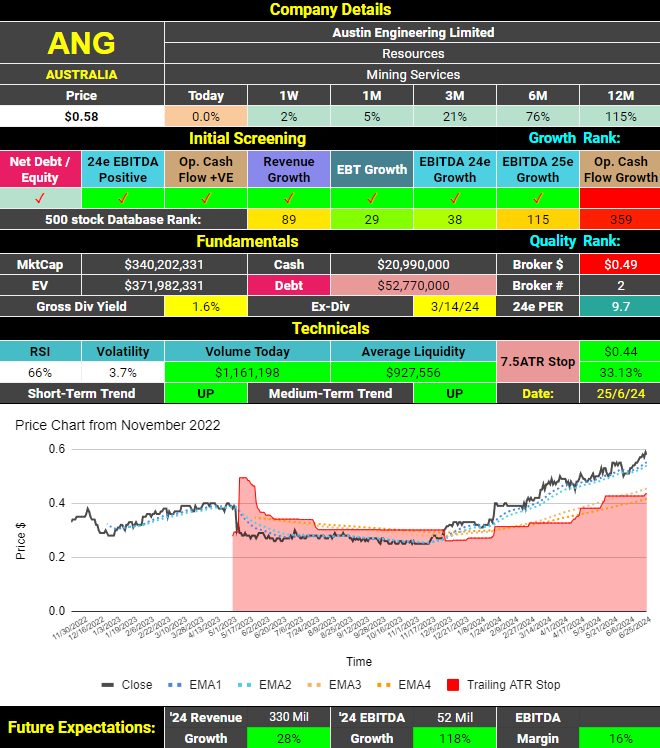
Austin Engineering (ASX:ANG) receives 7 out of 8 possible ticks in the initial screening. Debt is low and revenue and earnings are growing and expected to continue growing. The only blot on the report is that Operating cash flows have been falling. The company pays a small, fully-franked dividend. The share price has been in an impressive uptrend of over 12 months now seeing the shares 115% above what they were this time last year.
Fundamental analysis
This company seems to be very different post ~2016 so we will look at it’s number from then:
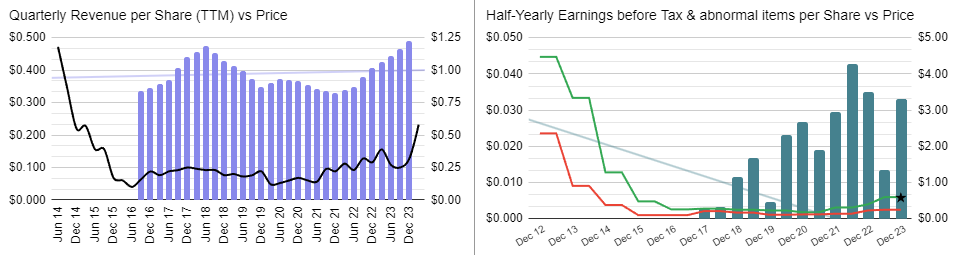
Like many mining services companies, historical performance appears cyclical. Presently the cycle seems to be in their favour.
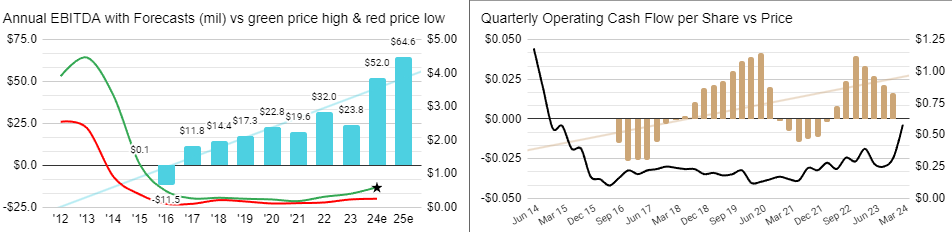
Operating cash flows are most choppy of all for this company for some reason while EBTIDA has been more consistent. It could be that Operating cash flows fluctuate more due to changes in inventories since the company does manufacture and supply capital goods.
Austin Engineering (ASX:ANG) Analysis is #533 on the ASX list of most shorted stocks. This is less than 0.1% of the stock on issue. Short selling is not a factor for this company.
Quality Analysis
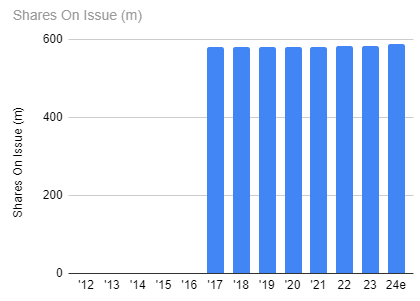
This company does not have a history of diluting its shareholders.
Revenues only increase slightly better than 1 in 2 times when this company reports. Earnings are more stable although nowhere near the levels of the best companies in this regard. Margins and ROE are both on the low side. Debt is low but regardless, this can only be considered a low quality company at this point in time.
Margins have been gradually trending higher which is clearly a positive. As we have seen above, earnings have been too. The company talks of being debt free this year. A lot of factors are moving in the right direction which will only see the quality of this company improve if they continue.
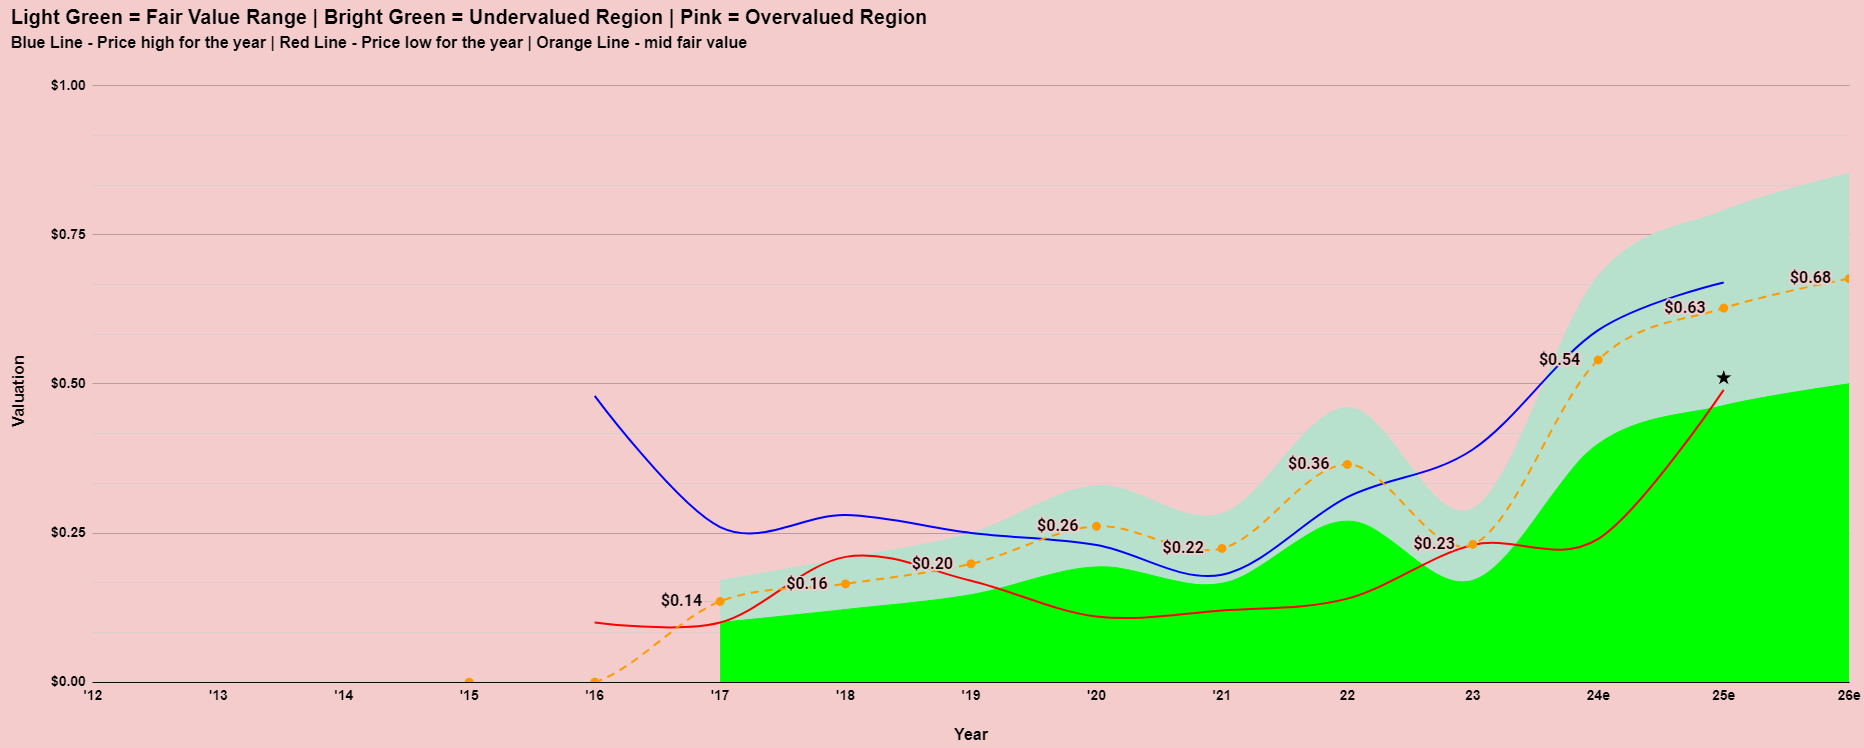
Valuation
The market is viewing Austin Engineering (ASX:ANG) quite favourably at present with the shares being rewarded with its highest price to sales ratio ever over the period of time which I am looking. Despite this, the Price Earnings Ratio based on expected earnings this year (2024) is only 9.7. It is possible this will continue to rise as the company continues deliver improved results.
Having such a choppy past makes it hard to get a grip on the appropriate valuation of this company. The valuation model is suggesting its now trading somewhere around fair value. As we can see though, it has rarely traded around that level of extended periods of time.
News From The Company
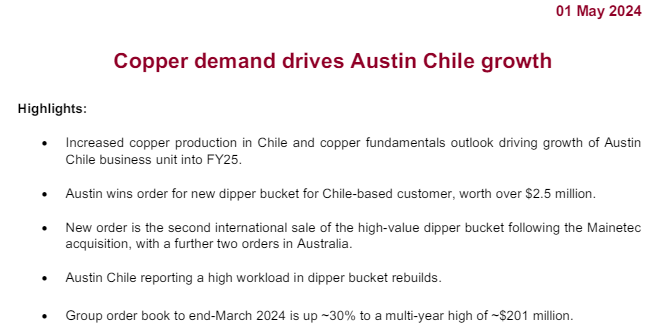
It would appear that the surge in copper price from February to May this year has been beneficial for this company. It must be noted that the copper price has fallen back quite a lot through June from a peak of over $5.10 a pound in May to a current price of $4.44 (25/6/24).
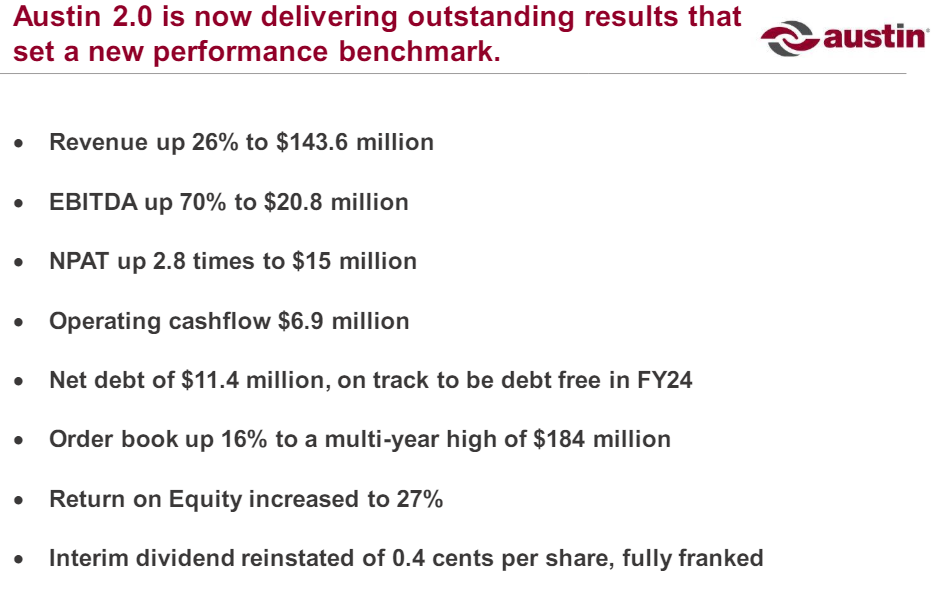
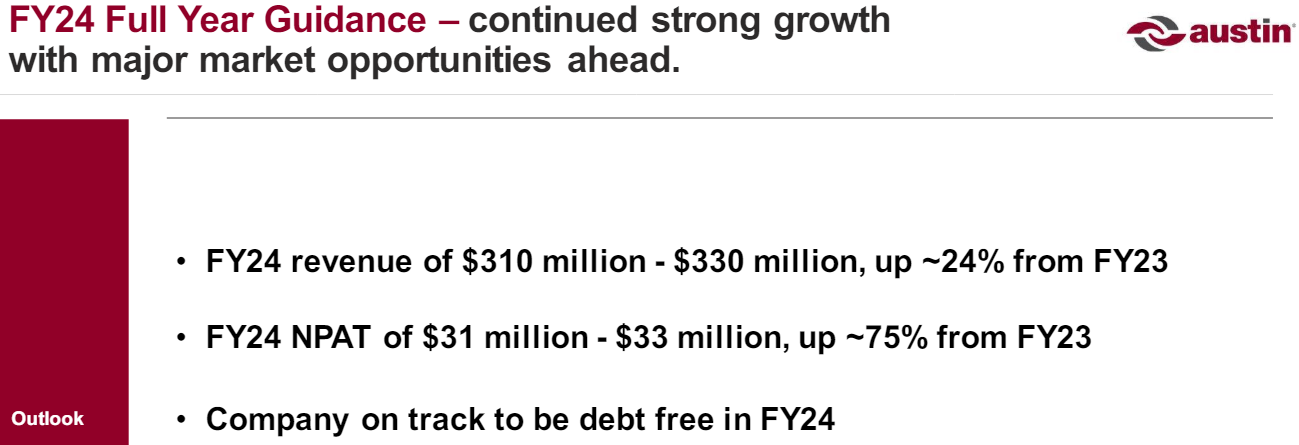
Source: Rottnest Conference Presentation March 2024
The company is very positive in their outlook .
Technical Analysis
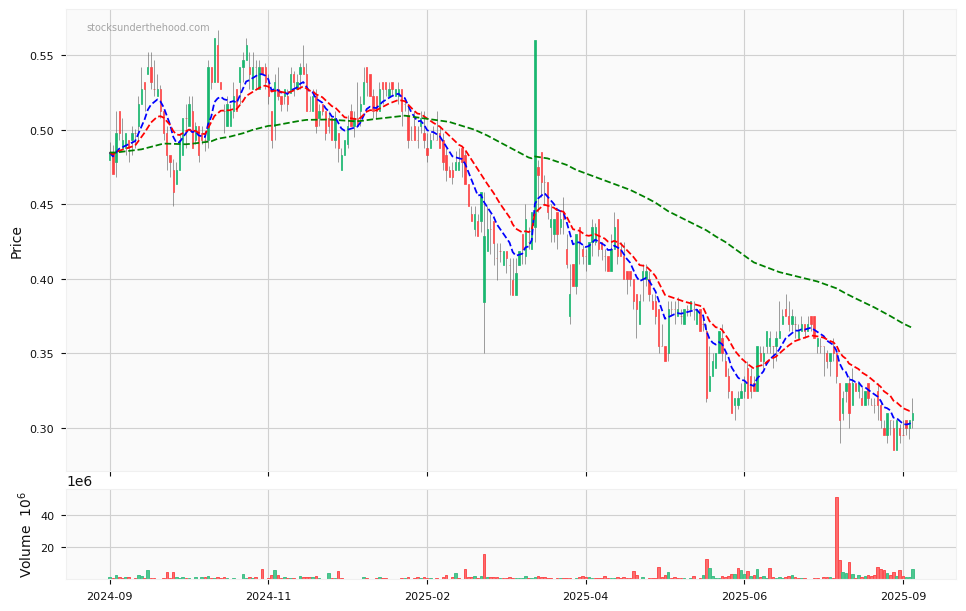
Note: This is a live chart. The technical analysis in this report should be considered up to the date of this report.
The share price of this company is in a short and medium term uptrend.
Final thoughts on Austin Engineering (ASX:ANG)
Austin Engineering (ASX:ANG) is a turnaround story. Like many turnaround stories, it can look a bit ugly at first glance. If we allow ourselves to zoom in on what the company has been doing in more recent times then the picture improves a lot. This is a cyclical stock though, but nevertheless, the cycle seems to be favourable for them at the moment. The share price has been rising along with the valuation the market is prepared to give it. By many measures that valuation still appears low with a PER of just 9.7 based on expected earnings this year. The outlook from the company is positive with a strong forward order book. Momentum is to the upside and nothing from the latest communications from the company suggests that is about to change.
Disclaimer: This information is provided purely for educational purposes. It takes no account of an individual’s personal financial circumstances and hence can in no way constitute financial advice. The above data may be subject to errors or inconsistencies for which the author takes no liability. It is imperative that all investors do their own research or if they need advice, seek it from a qualified financial adviser.
Austin Engineering (ASX:ANG) Analysis
Integrated Research (ASX:IRI) Analysis
This is a restricted members post.
Intelligent Monitoring Group (ASX:IMB) Analysis
This is a restricted members post.
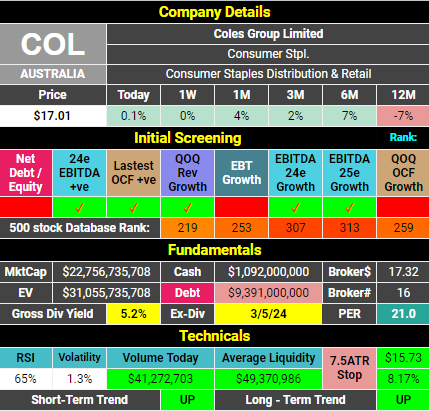
Coles vs Woolworths June 2024
Coles Group ASX:COL |
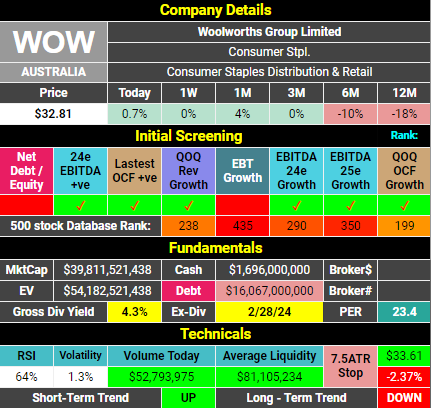
Woolworths Group ASX:WOW |
|---|---|
 |
 |
 |
 |
 |
 |
Margins for both companies are very similar. |
 |
 |
Woolworths has found recent times to be much more difficult. |
EPS has grown from 74cps to 78cps since 2019 to 2023. 5.4% |
EPS has fallen from 133cps to 126cps since 2019 to 2023. -5.3% |
Both companies appear to be offering some value at today’s prices. |
Woolworths has had the harder year but analysts believe it’s just a blip and hence their forward numbers suggest some upside from these levels. |

Observations
Since October 2019, Woolworths Group ASX:WOW shares have outperformed Coles Group ASX:COL shares by amazingly less than 1%. However, during that time it is Coles that has grown profits more. Coles also pays the higher dividend of the two. Coles also has the lower Price to earnings ratio. Based on all of that you would think Coles is the better buy. However, the market has always given a slight premium to Woolworths for some reason and so today it is Woolworths that is looking most undervalued compared to historical valuations. All in all, it is remarkable how similar both of these companies are. I guess when you’re part of a duopoly it’s best to maintain the status quo though, right?
Disclaimer: This information is provided purely for educational purposes. It takes no account of an individual’s personal financial circumstances and hence can in no way constitute financial advice. The above data may be subject to errors or inconsistencies for which the author takes no liability. It is imperative that all investors do their own research or if they need advice, seek it from a qualified financial adviser.
Coles vs Woolworths June 2024
Big River Industries (ASX:BRI) Analysis
This is a restricted members post.