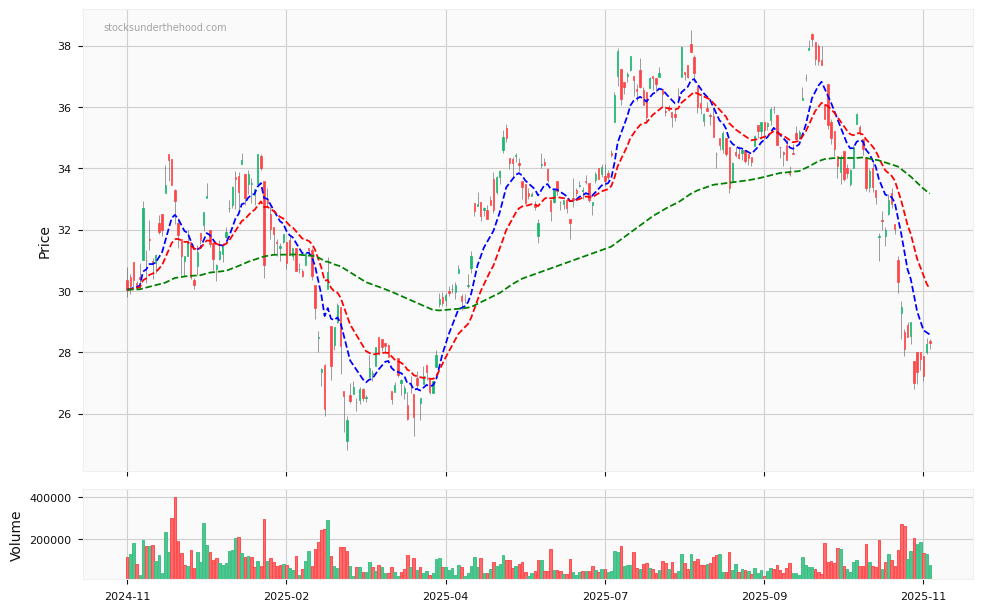
The Plato Global Alpha Fund Complex ETF (ASX:PGA1) is a listed exchange-traded fund that provides investors with exposure to a global equity long-short strategy, aiming to generate absolute returns through a combination of long positions in undervalued stocks and short positions in overvalued ones.
Ticker code: PGA1
Market Information
| Market Capitalisation |
Enterprise Value |
Shares Outstanding |
Free Float [%] |
Free Float Value |
| None |
None |
None |
0.0 |
None |
Balance Sheet & Quality
| Equity |
Cash |
Debt |
Return On Equity (ROE) |
EBITDA 25 Margin [%] |
Net Debt / Equity [%] |
Rule of 40 |
| None |
None |
None |
None |
None |
0.0 |
None |
Technicals & Short Data
| 3EMA Status |
Volatility [%] |
Value Traded Today |
Average Daily Liquidity |
Short [%] |
Days To Cover |
| None |
None |
$8,300,032 |
$6,194,248 |
None |
0.0 |
Dividends
| Previous Dividend |
Last Dividend |
Franking [%] |
Ex-Div Date |
Gross Yield [%] |
| None |
None |
None |
None |
None |
Price Performance Snapshot
| Last Traded Price |
Change [%] |
1 Week [%] |
1 Month [%] |
3 Months [%] |
6 Months [%] |
12 Months [%] |
| $13.730 |
-0.1 |
2.2 |
1.7 |
9.1 |
18.0 |
30.6 |
PGA1 Price Chart with Volume and 3EMA
PGA1 Short Positions
No chart available for this company.
Click HERE to understand why the above moving averages have been chosen.
The VanEck Bitcoin ETF (ASX:VBTC) provides direct exposure to the price of Bitcoin (in AUD) by physically holding Bitcoin. It tracks the MVIS CryptoCompare Bitcoin VG Index (before fees), offering a fully backed, secure way to invest in Bitcoin without needing to manage wallets or private keys.
Ticker code: VBTC
Market Information
| Market Capitalisation |
Enterprise Value |
Shares Outstanding |
Free Float [%] |
Free Float Value |
| None |
None |
None |
0.0 |
None |
Balance Sheet & Quality
| Equity |
Cash |
Debt |
Return On Equity (ROE) |
EBITDA 25 Margin [%] |
Net Debt / Equity [%] |
Rule of 40 |
| None |
None |
None |
None |
None |
0.0 |
None |
Technicals & Short Data
| 3EMA Status |
Volatility [%] |
Value Traded Today |
Average Daily Liquidity |
Short [%] |
Days To Cover |
| Negative |
None |
$2,122,613 |
$2,533,416 |
None |
0.0 |
Dividends
| Previous Dividend |
Last Dividend |
Franking [%] |
Ex-Div Date |
Gross Yield [%] |
| None |
None |
None |
None |
None |
Price Performance Snapshot
| Last Traded Price |
Change [%] |
1 Week [%] |
1 Month [%] |
3 Months [%] |
6 Months [%] |
12 Months [%] |
| $28.300 |
0.1 |
3.5 |
-16.5 |
-15.1 |
-14.5 |
-13.4 |
VBTC Price Chart with Volume and 3EMA
VBTC Short Positions
Click HERE to understand why the above moving averages have been chosen.
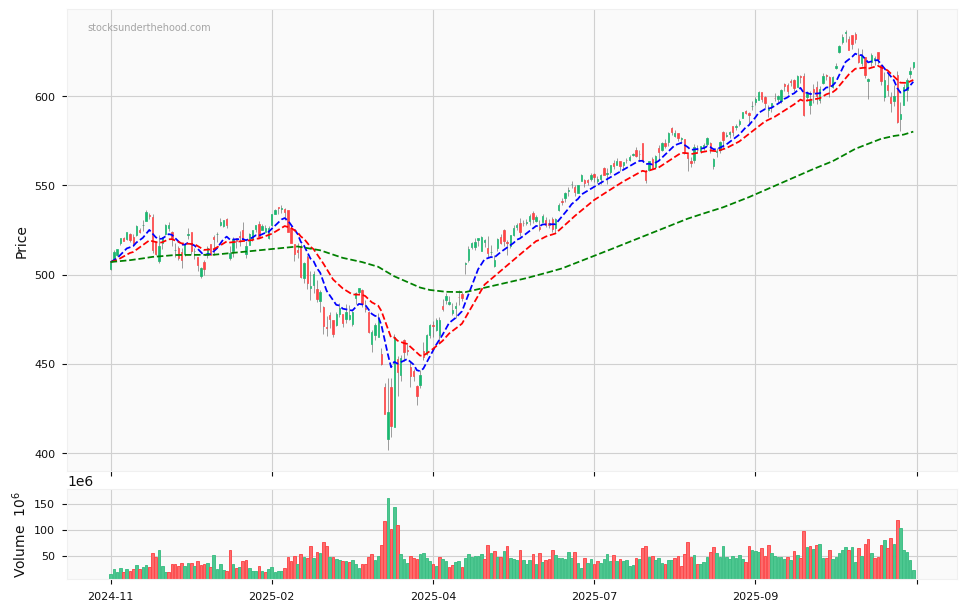
The Invesco QQQ Trust (NASDAQ:QQQ) tracks the Nasdaq-100 Index (before fees). It provides exposure to 100 of the largest non-financial companies listed on Nasdaq, heavily weighted toward innovative technology and growth stocks like Apple, Microsoft, Nvidia, Amazon and Meta.
Ticker code: QQQ
Market Information
| Market Capitalisation |
Enterprise Value |
Shares Outstanding |
Free Float [%] |
Free Float Value |
| $243,427,180,544 |
None |
393100000.0 |
0.0 |
$0 |
Balance Sheet & Quality
| Equity |
Cash |
Debt |
Return On Equity (ROE) |
EBITDA 25 Margin [%] |
Net Debt / Equity [%] |
Rule of 40 |
| $140,640,955,933 |
None |
None |
None |
None |
0.0 |
None |
Technicals & Short Data
| 3EMA Status |
Volatility [%] |
Value Traded Today |
Average Daily Liquidity |
Short [%] |
Days To Cover |
| Positive |
None |
$13,071,603,965 |
$36,227,034,059 |
None |
0.0 |
Dividends
| Previous Dividend |
Last Dividend |
Franking [%] |
Ex-Div Date |
Gross Yield [%] |
| $0.591 |
$0.694 |
None |
2025-09-22 |
None |
Price Performance Snapshot
| Last Traded Price |
Change [%] |
1 Week [%] |
1 Month [%] |
3 Months [%] |
6 Months [%] |
12 Months [%] |
| $619.250 |
0.8 |
2.3 |
-1.6 |
9.6 |
17.7 |
19.3 |
QQQ Price Chart with Volume and 3EMA
QQQ Short Positions
No chart available for this company.
Click HERE to understand why the above moving averages have been chosen.
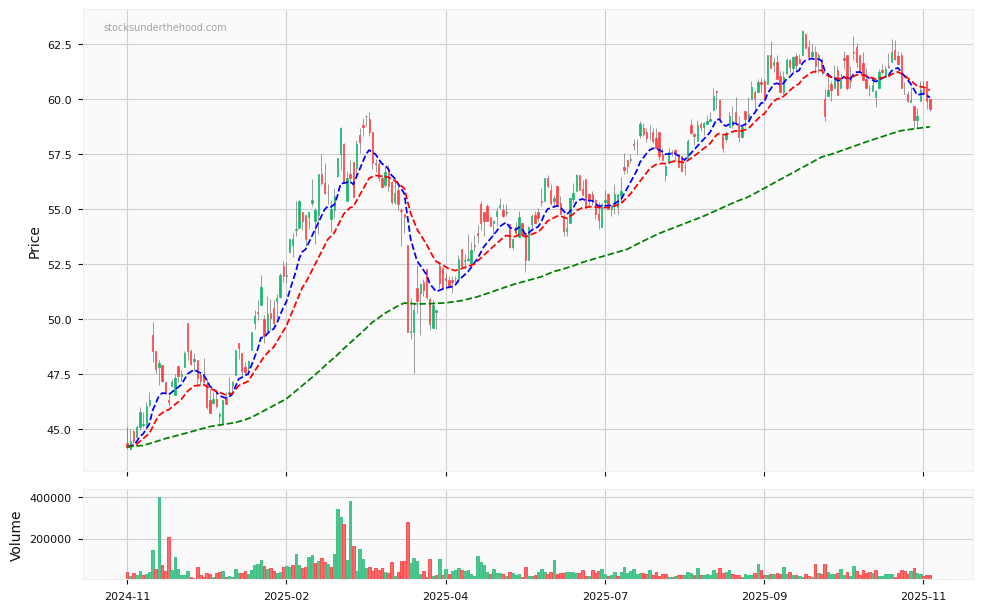
The iShares China Large-Cap ETF (ASX:IZZ) tracks the FTSE China 50 Index (before fees). It provides exposure to the 50 largest and most liquid Chinese companies listed on the Hong Kong Stock Exchange, including Tencent, Alibaba and China Construction Bank.
Ticker code: IZZ
Market Information
| Market Capitalisation |
Enterprise Value |
Shares Outstanding |
Free Float [%] |
Free Float Value |
| $7,457,865,216 |
None |
94950000.0 |
0.0 |
$0 |
Balance Sheet & Quality
| Equity |
Cash |
Debt |
Return On Equity (ROE) |
EBITDA 25 Margin [%] |
Net Debt / Equity [%] |
Rule of 40 |
| $3,808,634,337 |
None |
None |
None |
None |
0.0 |
None |
Technicals & Short Data
| 3EMA Status |
Volatility [%] |
Value Traded Today |
Average Daily Liquidity |
Short [%] |
Days To Cover |
| Partial |
None |
$1,421,935 |
$1,914,080 |
None |
0.0 |
Dividends
| Previous Dividend |
Last Dividend |
Franking [%] |
Ex-Div Date |
Gross Yield [%] |
| $1.456 |
$0.634 |
None |
2025-07-01 |
None |
Price Performance Snapshot
| Last Traded Price |
Change [%] |
1 Week [%] |
1 Month [%] |
3 Months [%] |
6 Months [%] |
12 Months [%] |
| $59.560 |
-0.6 |
0.5 |
-1.6 |
0.5 |
9.9 |
31.7 |
IZZ Price Chart with Volume and 3EMA
IZZ Short Positions
Click HERE to understand why the above moving averages have been chosen.
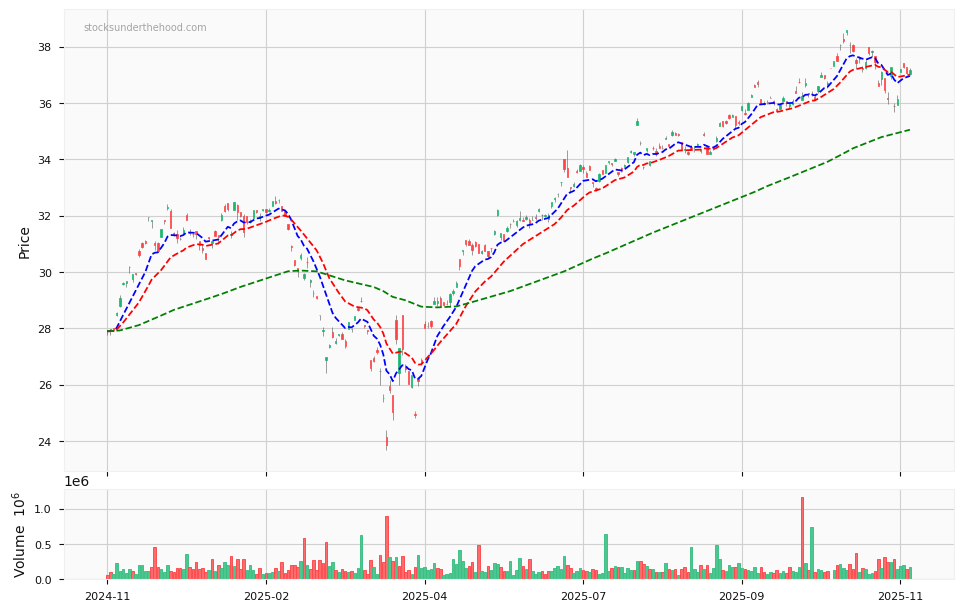
The BetaShares FANG+ ETF (ASX:FANG) tracks the NYSE FANG+ Index (before fees). It provides equally weighted exposure to 10 leading U.S. technology and tech-enabled growth stocks, including Meta, Apple, Amazon, Netflix, Alphabet, Nvidia and Tesla.
Ticker code: FANG
Market Information
| Market Capitalisation |
Enterprise Value |
Shares Outstanding |
Free Float [%] |
Free Float Value |
| None |
None |
None |
0.0 |
None |
Balance Sheet & Quality
| Equity |
Cash |
Debt |
Return On Equity (ROE) |
EBITDA 25 Margin [%] |
Net Debt / Equity [%] |
Rule of 40 |
| None |
None |
None |
None |
None |
0.0 |
None |
Technicals & Short Data
| 3EMA Status |
Volatility [%] |
Value Traded Today |
Average Daily Liquidity |
Short [%] |
Days To Cover |
| Partial |
None |
$6,284,871 |
$6,963,524 |
None |
0.0 |
Dividends
| Previous Dividend |
Last Dividend |
Franking [%] |
Ex-Div Date |
Gross Yield [%] |
| $1.419 |
$1.796 |
None |
2025-06-30 |
None |
Price Performance Snapshot
| Last Traded Price |
Change [%] |
1 Week [%] |
1 Month [%] |
3 Months [%] |
6 Months [%] |
12 Months [%] |
| $37.160 |
0.3 |
2.9 |
-3.7 |
8.7 |
17.7 |
25.5 |
FANG Price Chart with Volume and 3EMA
FANG Short Positions
Click HERE to understand why the above moving averages have been chosen.
Barton Gold Holdings (ASX:BGD) is an ASX-listed gold explorer and developer in South Australia. It controls ~1.6Moz JORC gold resources, brownfield mines and the region’s only operating gold mill, targeting 150,000oz annual production.
Ticker code: BGD
Market Information
| Market Capitalisation |
Enterprise Value |
Shares Outstanding |
Free Float [%] |
Free Float Value |
| $279,033,056 |
$255,535,312 |
238489810.0 |
66.93 |
$186,749,422 |
Balance Sheet & Quality
| Equity |
Cash |
Debt |
Return On Equity (ROE) |
EBITDA 25 Margin [%] |
Net Debt / Equity [%] |
Rule of 40 |
| $9,539,592 |
$8,991,000 |
$151,000 |
None |
None |
-92.7 |
None |
Technicals & Short Data
| 3EMA Status |
Volatility [%] |
Value Traded Today |
Average Daily Liquidity |
Short [%] |
Days To Cover |
| Partial |
None |
$650,053 |
$868,720 |
None |
0.0 |
Dividends
| Previous Dividend |
Last Dividend |
Franking [%] |
Ex-Div Date |
Gross Yield [%] |
| None |
None |
None |
None |
None |
Price Performance Snapshot
| Last Traded Price |
Change [%] |
1 Week [%] |
1 Month [%] |
3 Months [%] |
6 Months [%] |
12 Months [%] |
| $1.170 |
7.3 |
15.3 |
-2.9 |
23.2 |
46.2 |
350.0 |
BGD Price Chart with Volume and 3EMA
BGD Short Positions
No chart available for this company.
Click HERE to understand why the above moving averages have been chosen.
The BetaShares Asia Technology Tigers ETF (ASX:ASIA) tracks the Solactive Asia ex-Japan Technology & Internet Tigers Index (before fees). It provides exposure to the 50 largest Asian (ex-Japan) technology and online retail companies, including Tencent, Alibaba and JD.com.
Ticker code: ASIA
Market Information
| Market Capitalisation |
Enterprise Value |
Shares Outstanding |
Free Float [%] |
Free Float Value |
| None |
None |
None |
0.0 |
None |
Balance Sheet & Quality
| Equity |
Cash |
Debt |
Return On Equity (ROE) |
EBITDA 25 Margin [%] |
Net Debt / Equity [%] |
Rule of 40 |
| None |
None |
None |
None |
None |
0.0 |
None |
Technicals & Short Data
| 3EMA Status |
Volatility [%] |
Value Traded Today |
Average Daily Liquidity |
Short [%] |
Days To Cover |
| Partial |
None |
$1,198,991 |
$3,193,041 |
None |
0.0 |
Dividends
| Previous Dividend |
Last Dividend |
Franking [%] |
Ex-Div Date |
Gross Yield [%] |
| $0.060 |
$0.028 |
None |
2025-07-01 |
None |
Price Performance Snapshot
| Last Traded Price |
Change [%] |
1 Week [%] |
1 Month [%] |
3 Months [%] |
6 Months [%] |
12 Months [%] |
| $14.230 |
None |
2.4 |
-6.1 |
13.4 |
30.1 |
45.5 |
ASIA Price Chart with Volume and 3EMA
ASIA Short Positions
Click HERE to understand why the above moving averages have been chosen.
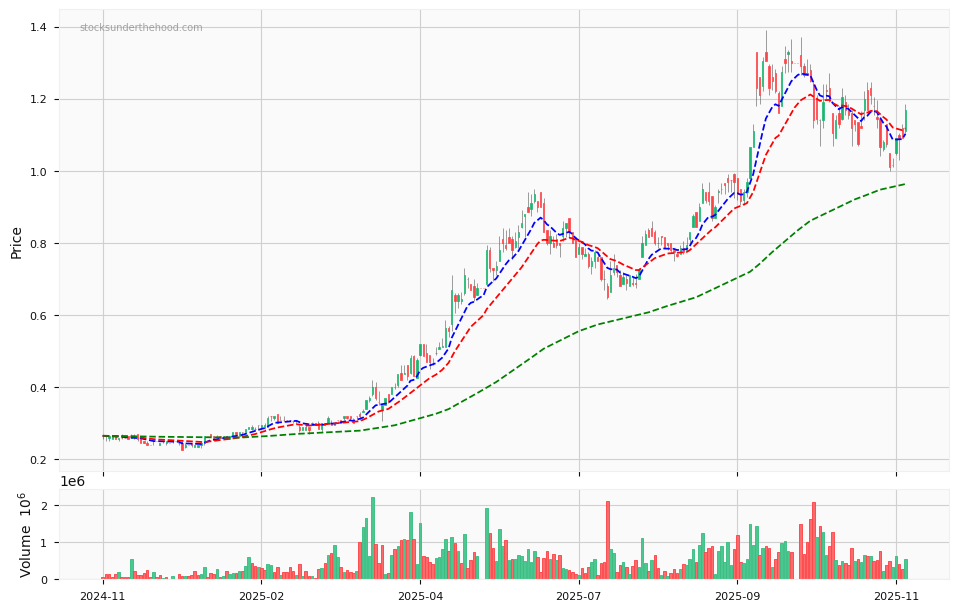
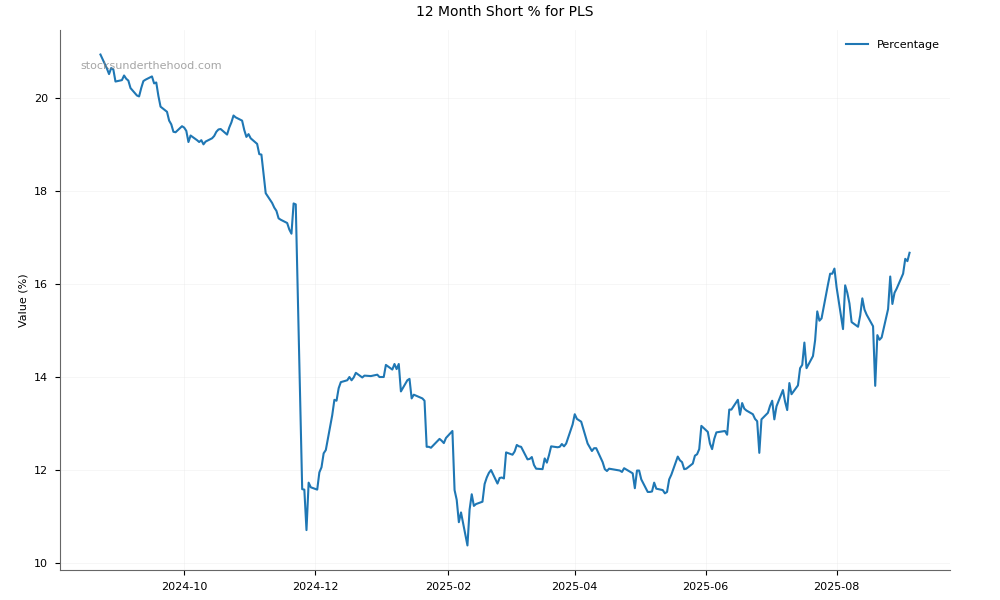
Pilbara Minerals Limited is a leading ASX-listed lithium company, owning 100% of the world’s largest, independent hard-rock lithium operation, the Pilgangoora Project, located in Western Australia.
Ticker code: PLS
Sector:
Basic Materials | Industry:
Other Industrial Metals & Mining | Website:
https://www.pls.com
Market Information
| Market Capitalisation |
Enterprise Value |
Shares Outstanding |
Free Float [%] |
Free Float Value |
| $13,039,621,330 |
$12,747,415,314 |
3219659436 |
95.7 |
$12,479,278,090 |
Balance Sheet & Quality
| Equity |
Cash |
Debt |
Return On Equity (ROE) |
EBITDA 25 Margin [%] |
Net Debt / Equity [%] |
Rule of 40 |
| $3,531,966,438 |
$974,417,024 |
$682,211,008 |
0.0 |
15.1 |
-8.3 |
6.5 |
Technicals & Short Data
| 3EMA Status |
Volatility [%] |
Value Traded Today |
Average Daily Liquidity |
Short [%] |
Days To Cover |
| Positive |
16.1 |
$58,840,561 |
$131,347,419 |
10.89 |
10.8 |
Dividends
| Previous Dividend |
Last Dividend |
Franking [%] |
Ex-Div Date |
Gross Yield [%] |
| None |
None |
100.0 |
2023-09-05 |
0.0 |
Price Performance Snapshot
| Last Traded Price |
Change [%] |
1 Week [%] |
1 Month [%] |
3 Months [%] |
6 Months [%] |
12 Months [%] |
| $4.050 |
2.5 |
7.7 |
22.7 |
66.7 |
256.8 |
75.3 |
PLS Price Chart with Volume and 3EMA
PLS Short Positions
Click HERE to understand why the above moving averages have been chosen.
MedAdvisor Limited offers a digital medication management platform that connects patients with pharmacies and healthcare providers to improve medication adherence.
Ticker code: MDR
Market Information
| Market Capitalisation |
Enterprise Value |
Shares Outstanding |
Free Float [%] |
Free Float Value |
| $14,003,474 |
$21,095,549 |
636521550 |
61.82 |
$8,657,234 |
Balance Sheet & Quality
| Equity |
Cash |
Debt |
Return On Equity (ROE) |
EBITDA 25 Margin [%] |
Net Debt / Equity [%] |
Rule of 40 |
| $1,273,043 |
$10,303,813 |
$17,395,888 |
0.0 |
5.7 |
557.1 |
6.2 |
Technicals & Short Data
| 3EMA Status |
Volatility [%] |
Value Traded Today |
Average Daily Liquidity |
Short [%] |
Days To Cover |
| Negative |
42.9 |
$1,305 |
$30,562 |
0.0 |
0.0 |
Dividends
| Previous Dividend |
Last Dividend |
Franking [%] |
Ex-Div Date |
Gross Yield [%] |
| None |
None |
None |
None |
0.0 |
Price Performance Snapshot
| Last Traded Price |
Change [%] |
1 Week [%] |
1 Month [%] |
3 Months [%] |
6 Months [%] |
12 Months [%] |
| $0.022 |
10.0 |
10.0 |
-21.4 |
-55.1 |
-74.4 |
-93.2 |
MDR Price Chart with Volume and 3EMA
MDR Short Positions
Click HERE to understand why the above moving averages have been chosen.
Bisalloy Steel Group Limited (ASX:BIS) is an Australian manufacturer of quenched and tempered high-strength and abrasion-resistant steel plates. Headquartered in Unanderra, it supplies customers in Australia, Asia and globally.
Ticker code: BIS
Market Information
| Market Capitalisation |
Enterprise Value |
Shares Outstanding |
Free Float [%] |
Free Float Value |
| $264,225,584 |
$264,774,800 |
48041013 |
64.9 |
$171,476,698 |
Balance Sheet & Quality
| Equity |
Cash |
Debt |
Return On Equity (ROE) |
EBITDA 25 Margin [%] |
Net Debt / Equity [%] |
Rule of 40 |
| $81,189,316 |
$6,331,000 |
$2,523,000 |
None |
None |
-4.7 |
None |
Technicals & Short Data
| 3EMA Status |
Volatility [%] |
Value Traded Today |
Average Daily Liquidity |
Short [%] |
Days To Cover |
| Positive |
None |
$735,537 |
$613,212 |
None |
0.0 |
Dividends
| Previous Dividend |
Last Dividend |
Franking [%] |
Ex-Div Date |
Gross Yield [%] |
| $0.080 |
$0.165 |
None |
2025-09-22 |
None |
Price Performance Snapshot
| Last Traded Price |
Change [%] |
1 Week [%] |
1 Month [%] |
3 Months [%] |
6 Months [%] |
12 Months [%] |
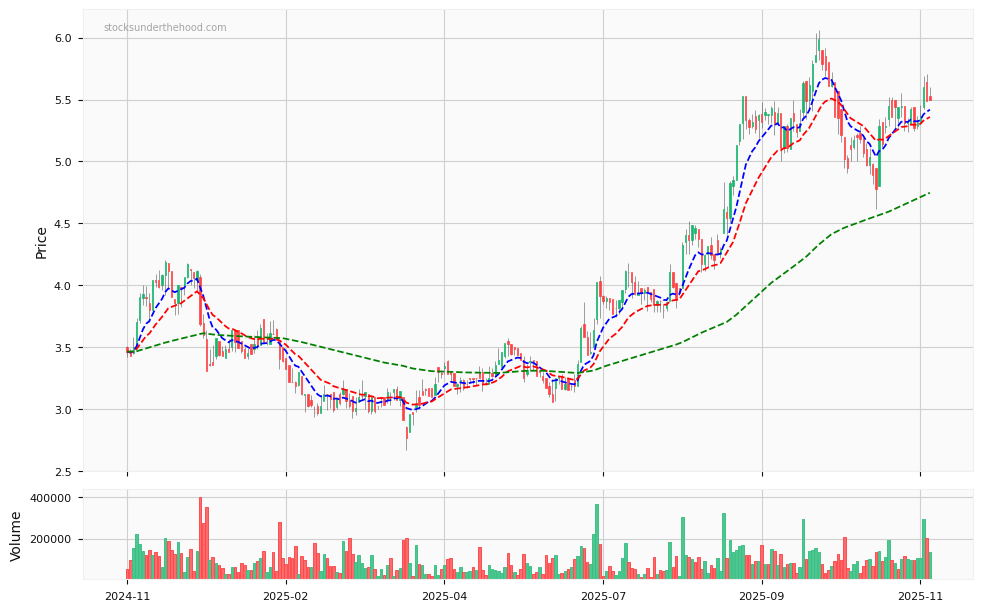
| $5.500 |
0.2 |
3.4 |
10.7 |
21.1 |
65.7 |
39.9 |
BIS Price Chart with Volume and 3EMA
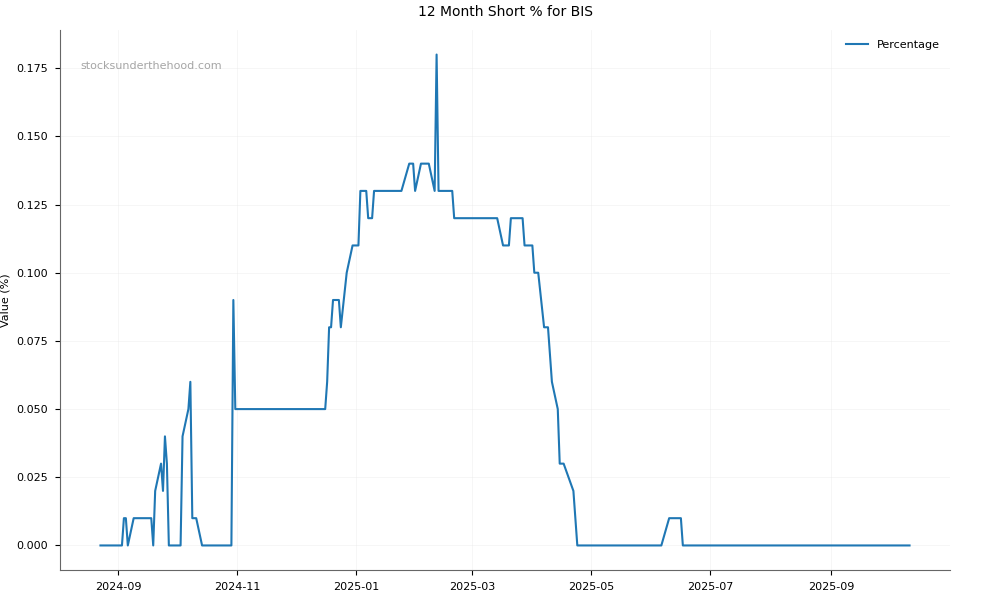
BIS Short Positions
Click HERE to understand why the above moving averages have been chosen.
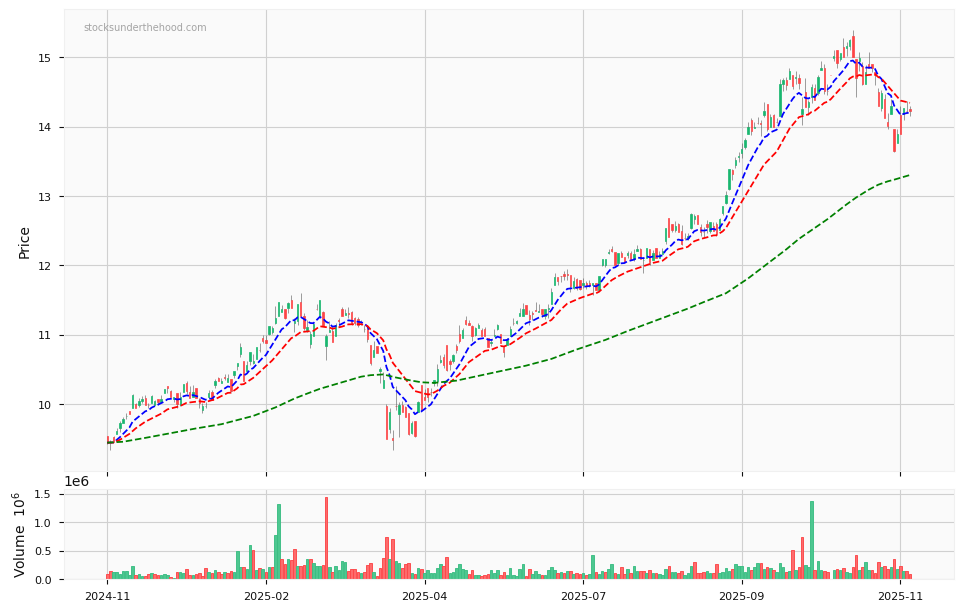
VanEck S&P/ASX MidCap ETF (ASX:MVE) is an exchange-traded fund managed by VanEck Investments Limited. It tracks the performance of the S&P/ASX MidCap 50 Index, comprising 50 mid-sized ASX-listed companies ranked 51 to 100 by market capitalization.
Ticker code: MVE
Market Information
| Market Capitalisation |
Enterprise Value |
Shares Outstanding |
Free Float [%] |
Free Float Value |
| None |
None |
None |
0.0 |
None |
Balance Sheet & Quality
| Equity |
Cash |
Debt |
Return On Equity (ROE) |
EBITDA 25 Margin [%] |
Net Debt / Equity [%] |
Rule of 40 |
| None |
None |
None |
None |
None |
0.0 |
None |
Technicals & Short Data
| 3EMA Status |
Volatility [%] |
Value Traded Today |
Average Daily Liquidity |
Short [%] |
Days To Cover |
| Positive |
43.5 |
$509,806 |
$1,224,593 |
None |
0.0 |
Dividends
| Previous Dividend |
Last Dividend |
Franking [%] |
Ex-Div Date |
Gross Yield [%] |
| $0.710 |
$0.630 |
None |
2025-07-01 |
None |
Price Performance Snapshot
| Last Traded Price |
Change [%] |
1 Week [%] |
1 Month [%] |
3 Months [%] |
6 Months [%] |
12 Months [%] |
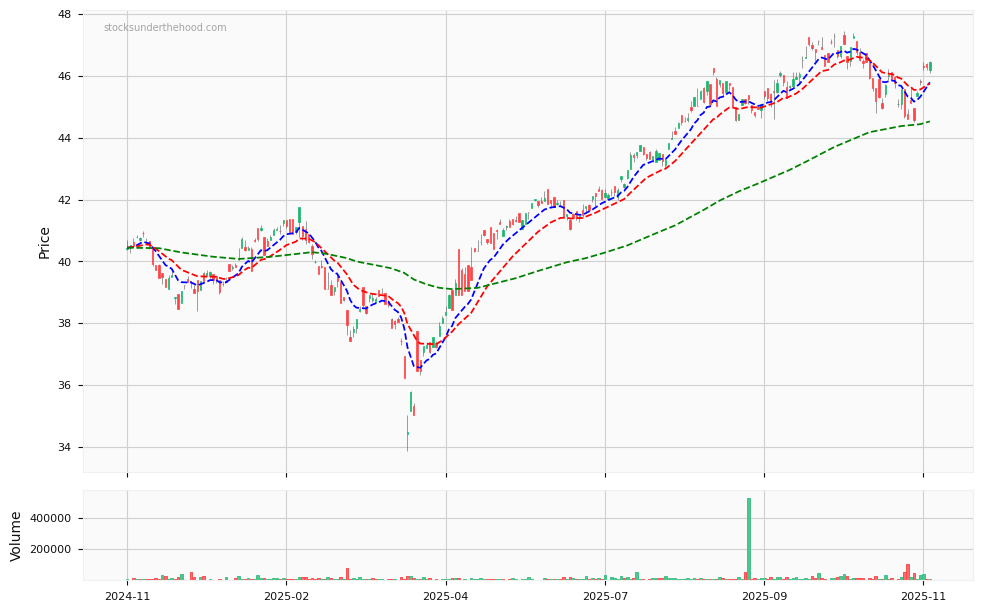
| $46.460 |
0.4 |
2.2 |
0.1 |
1.6 |
11.7 |
13.5 |
MVE Price Chart with Volume and 3EMA
MVE Short Positions
No chart available for this company.
Click HERE to understand why the above moving averages have been chosen.
Ticker code: DXN
DXN Red Flags & Risk Indicators
✅
⚠️ RED FLAGS: 0 identified
No red flags detected.
Income Statement
| Revenue 2024 Per Share |
Revenue 2025e Per Share |
Revenue 2026e Per Share |
Revenue 24 to 25e [%] |
Revenue 25e to 26e [%] |
EBITDA 2024 Per Share |
EBITDA 2025e Per Share |
EBITDA 2026e Per Share |
EBITDA 24 to 25e [%] |
EBITDA 25e to 26e [%] |
| None |
None |
None |
None |
None |
None |
None |
None |
None |
None |
DXN Revenue Per Share (2012–2027)
DXN Earnings before Interest, Tax, Depreciation and Amortisation (EBITDA) Per Share (2012–2027)
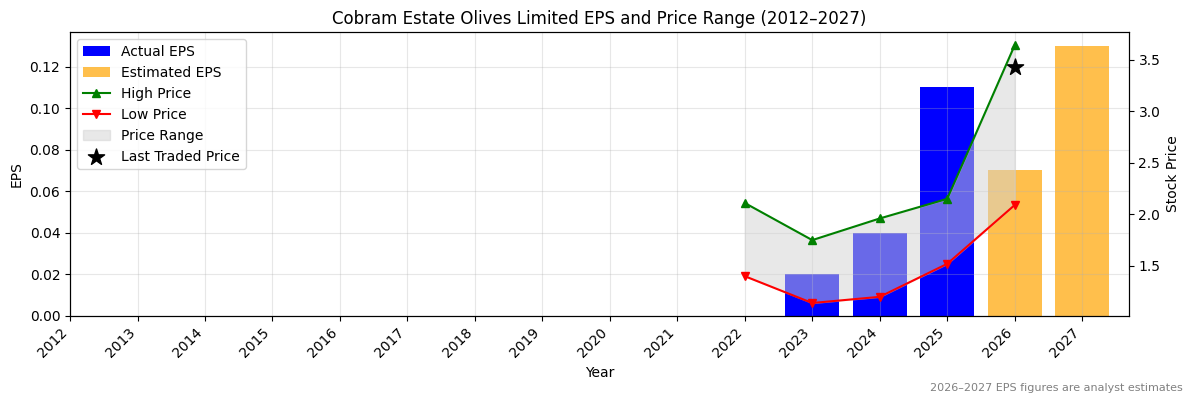
DXN Normalised Earnings Per Share (EPS) (2012–2027)
Valuation
| Price To Sales |
Price To Book |
PER 2023 |
PER 2024 |
13Y Median PER Low |
PER 2025e |
13Y Median PER High |
PER 2026e |
Last Updated |
| 1.1 |
3.4 |
None |
None |
None |
None |
None |
None |
None |
DXN Yearly Price Earnings Ratio (PER) Highs and Lows
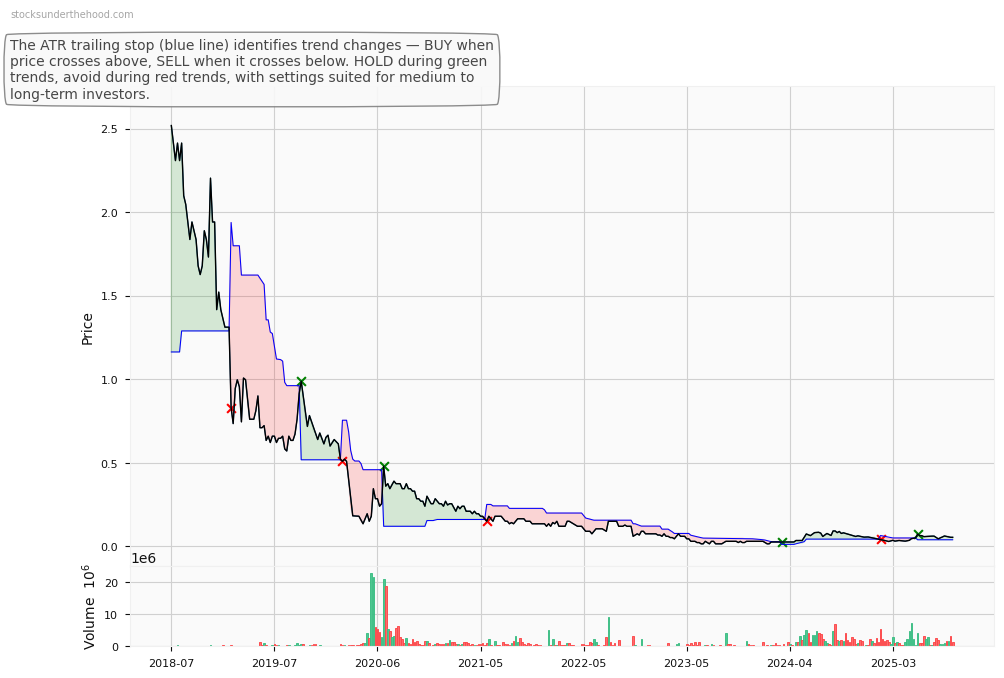
DXN Weekly Price Chart with Average True Range (ATR) Trailing Stop (10-Year View)
Ticker code: SRL
SRL Red Flags & Risk Indicators
✅
⚠️ RED FLAGS: 0 identified
No red flags detected.
Income Statement
| Revenue 2024 Per Share |
Revenue 2025e Per Share |
Revenue 2026e Per Share |
Revenue 24 to 25e [%] |
Revenue 25e to 26e [%] |
EBITDA 2024 Per Share |
EBITDA 2025e Per Share |
EBITDA 2026e Per Share |
EBITDA 24 to 25e [%] |
EBITDA 25e to 26e [%] |
| None |
None |
None |
None |
None |
None |
None |
None |
None |
None |
SRL Revenue Per Share (2012–2027)
SRL Earnings before Interest, Tax, Depreciation and Amortisation (EBITDA) Per Share (2012–2027)
SRL Normalised Earnings Per Share (EPS) (2012–2027)
Valuation
| Price To Sales |
Price To Book |
PER 2023 |
PER 2024 |
13Y Median PER Low |
PER 2025e |
13Y Median PER High |
PER 2026e |
Last Updated |
| 3018.7 |
51.1 |
None |
None |
None |
None |
None |
None |
None |
SRL Yearly Price Earnings Ratio (PER) Highs and Lows
SRL Weekly Price Chart with Average True Range (ATR) Trailing Stop (10-Year View)
Ticker code: SGLLV
SGLLV Red Flags & Risk Indicators
✅
⚠️ RED FLAGS: 0 identified
No red flags detected.
Income Statement
| Revenue 2024 Per Share |
Revenue 2025e Per Share |
Revenue 2026e Per Share |
Revenue 24 to 25e [%] |
Revenue 25e to 26e [%] |
EBITDA 2024 Per Share |
EBITDA 2025e Per Share |
EBITDA 2026e Per Share |
EBITDA 24 to 25e [%] |
EBITDA 25e to 26e [%] |
| None |
None |
None |
None |
None |
None |
None |
None |
None |
None |
SGLLV Revenue Per Share (2012–2027)
SGLLV Earnings before Interest, Tax, Depreciation and Amortisation (EBITDA) Per Share (2012–2027)
SGLLV Normalised Earnings Per Share (EPS) (2012–2027)
Valuation
| Price To Sales |
Price To Book |
PER 2023 |
PER 2024 |
13Y Median PER Low |
PER 2025e |
13Y Median PER High |
PER 2026e |
Last Updated |
| 0.6 |
1.8 |
None |
None |
None |
None |
None |
None |
None |
SGLLV Yearly Price Earnings Ratio (PER) Highs and Lows
SGLLV Weekly Price Chart with Average True Range (ATR) Trailing Stop (10-Year View)
Ticker code: CBO
CBO Red Flags & Risk Indicators
⚠️
⚠️ RED FLAGS: 1 identified
Income Statement
| Revenue 2024 Per Share |
Revenue 2025e Per Share |
Revenue 2026e Per Share |
Revenue 24 to 25e [%] |
Revenue 25e to 26e [%] |
EBITDA 2024 Per Share |
EBITDA 2025e Per Share |
EBITDA 2026e Per Share |
EBITDA 24 to 25e [%] |
EBITDA 25e to 26e [%] |
| 0.65836 |
0.80234 |
0.72493 |
21.9 |
-9.6 |
0.1598 |
0.27835 |
0.19416 |
74.2 |
-30.2 |
CBO Revenue Per Share (2012–2027)
✅✅
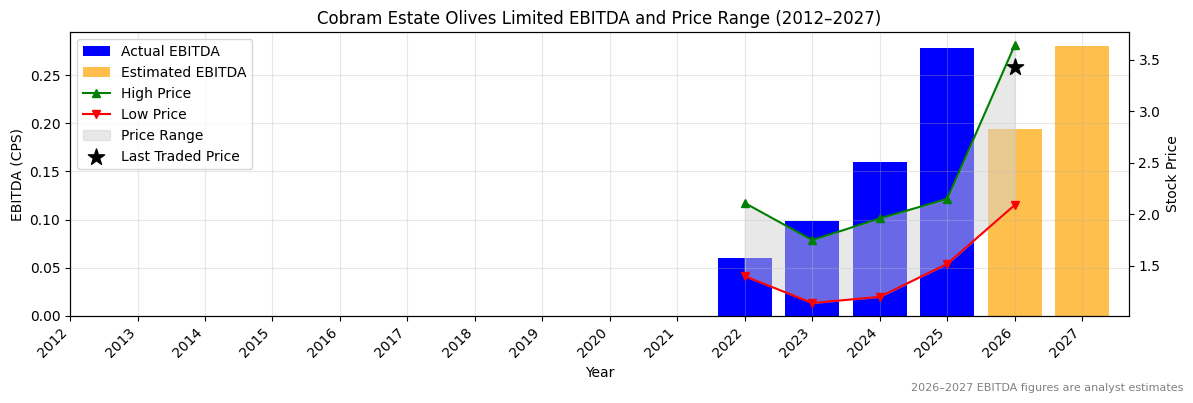
CBO Earnings before Interest, Tax, Depreciation and Amortisation (EBITDA) Per Share (2012–2027)
✅✅
CBO Normalised Earnings Per Share (EPS) (2012–2027)
✅✅
Valuation
| Price To Sales |
Price To Book |
PER 2023 |
PER 2024 |
13Y Median PER Low |
PER 2025e |
13Y Median PER High |
PER 2026e |
Last Updated |
| 6.7 |
3.9 |
170.0 |
85.0 |
29.9 |
30.9 |
50.5 |
48.6 |
24/10/25 |
CBO Yearly Price Earnings Ratio (PER) Highs and Lows
✅
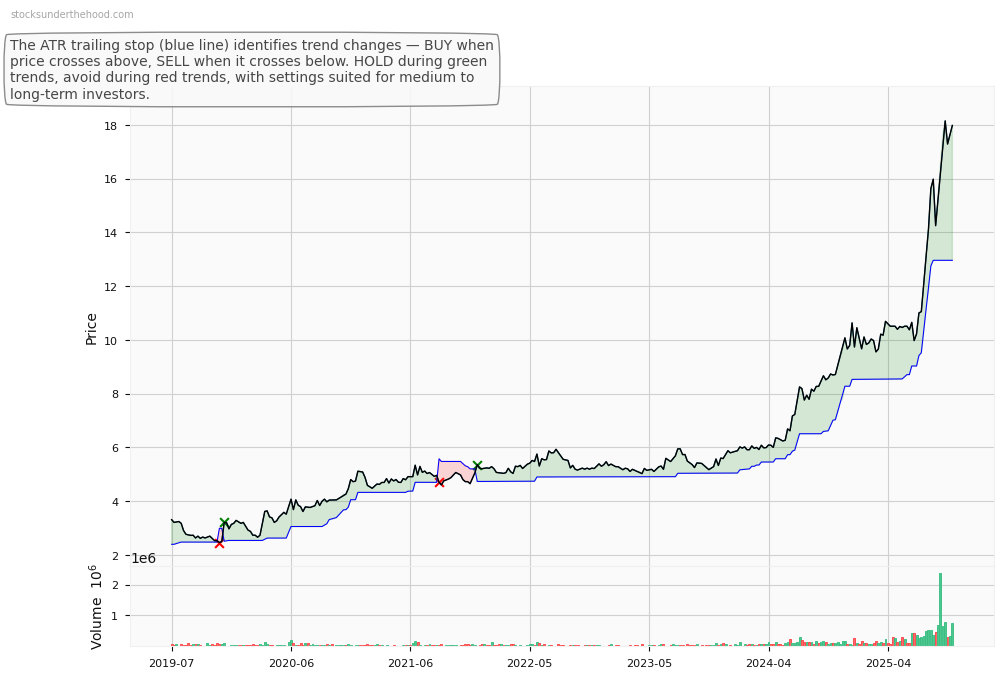
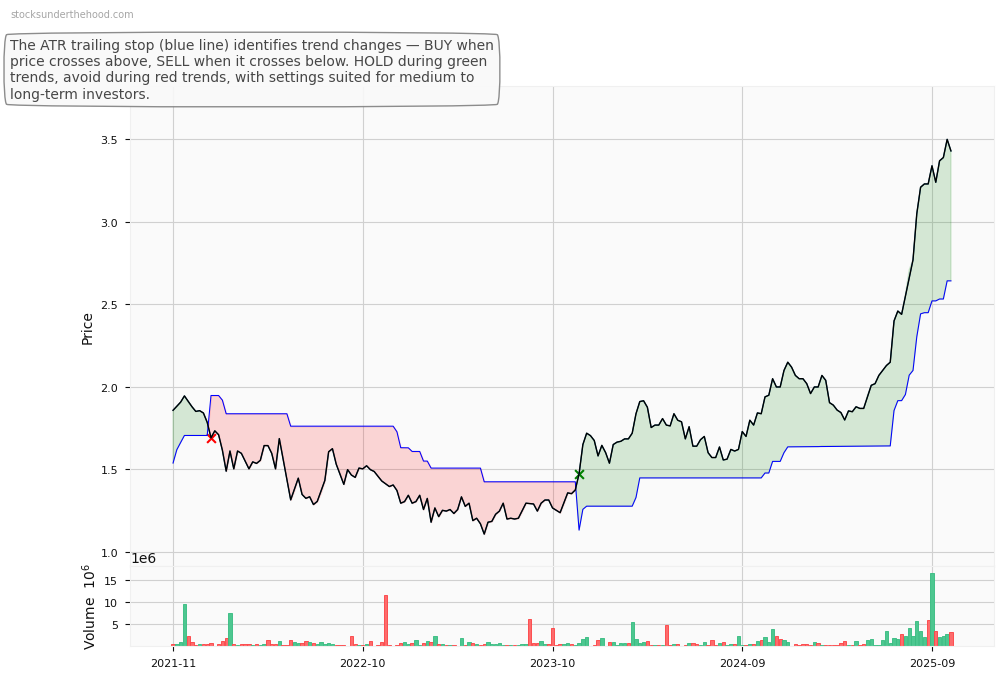
CBO Weekly Price Chart with Average True Range (ATR) Trailing Stop (10-Year View)
DXN Limited (ASX:DXN) is an Australian data centre company designing, manufacturing, and operating modular facilities globally. It provides prefabricated solutions, colocation services, and edge computing through segments in manufacturing, operations, and data centre as a service.
Ticker code: DXN
Market Information
| Market Capitalisation |
Enterprise Value |
Shares Outstanding |
Free Float [%] |
Free Float Value |
| $14,353,700 |
$17,071,218 |
312036972.0 |
64.84 |
$9,307,037 |
Balance Sheet & Quality
| Equity |
Cash |
Debt |
Return On Equity (ROE) |
EBITDA 25 Margin [%] |
Net Debt / Equity [%] |
Rule of 40 |
| $4,992,592 |
$3,119,895 |
$6,450,746 |
None |
None |
66.7 |
None |
Technicals & Short Data
| 3EMA Status |
Volatility [%] |
Value Traded Today |
Average Daily Liquidity |
Short [%] |
Days To Cover |
| Negative |
None |
$767 |
$11,966 |
None |
0.0 |
Dividends
| Previous Dividend |
Last Dividend |
Franking [%] |
Ex-Div Date |
Gross Yield [%] |
| None |
None |
None |
None |
None |
Price Performance Snapshot
| Last Traded Price |
Change [%] |
1 Week [%] |
1 Month [%] |
3 Months [%] |
6 Months [%] |
12 Months [%] |
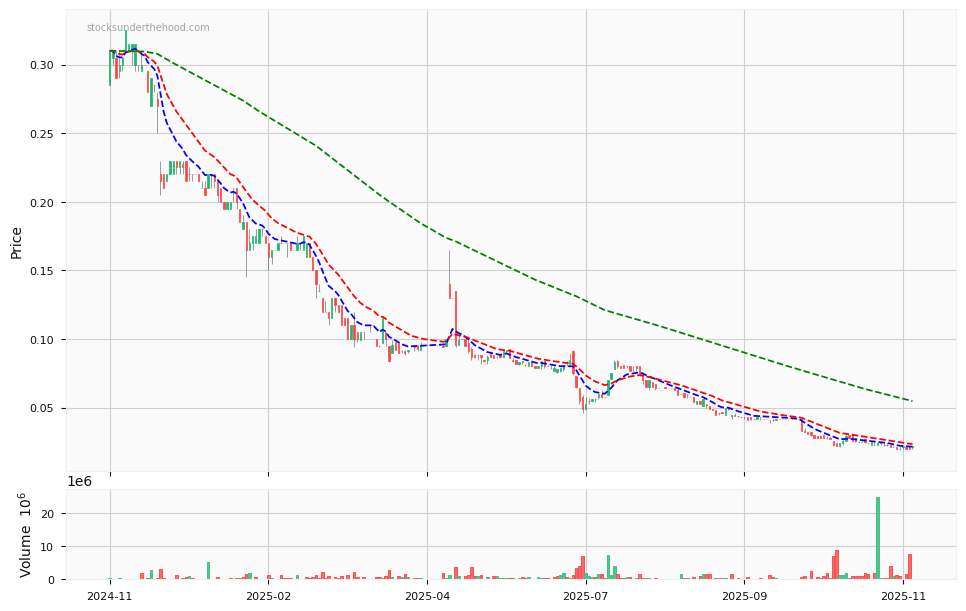
| $0.046 |
None |
-2.1 |
-14.8 |
-11.5 |
None |
-25.8 |
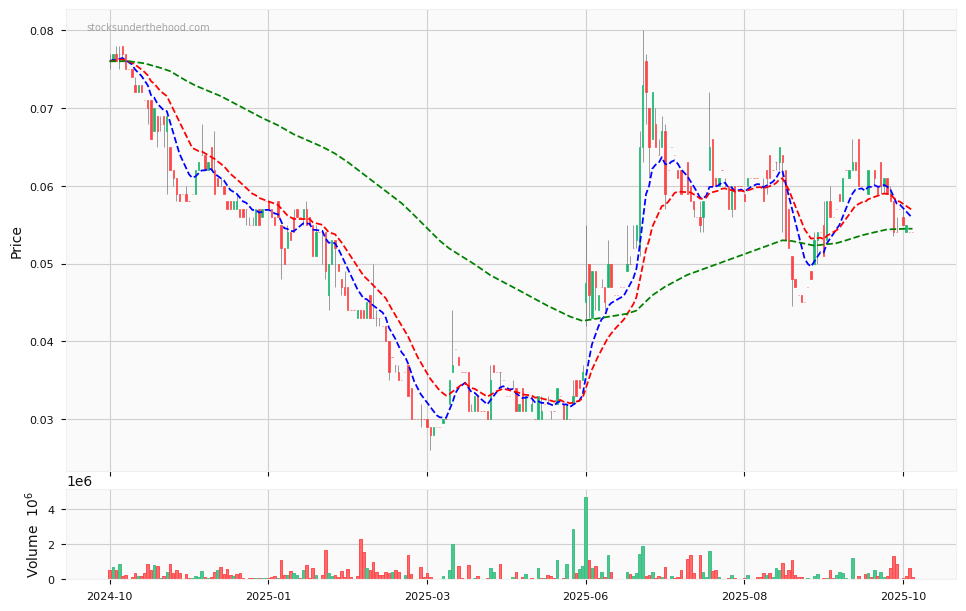
DXN Price Chart with Volume and 3EMA
DXN Short Positions
Click HERE to understand why the above moving averages have been chosen.
Sunrise Energy Metals Limited (ASX:SRL) is an Australian company developing the Sunrise Battery Materials Complex in New South Wales for nickel, cobalt, and scandium. It utilizes Clean-iX resin technology for metal extraction and purification, advancing exploration at other tenements.
Ticker code: SRL
Market Information
| Market Capitalisation |
Enterprise Value |
Shares Outstanding |
Free Float [%] |
Free Float Value |
| $876,880,064 |
$765,705,024 |
132459223.0 |
52.55 |
$460,819,243 |
Balance Sheet & Quality
| Equity |
Cash |
Debt |
Return On Equity (ROE) |
EBITDA 25 Margin [%] |
Net Debt / Equity [%] |
Rule of 40 |
| $11,656,412 |
$10,714,000 |
$224,000 |
None |
None |
-90.0 |
None |
Technicals & Short Data
| 3EMA Status |
Volatility [%] |
Value Traded Today |
Average Daily Liquidity |
Short [%] |
Days To Cover |
| Positive |
15.1 |
$11,349,745 |
$4,365,466 |
None |
0.0 |
Dividends
| Previous Dividend |
Last Dividend |
Franking [%] |
Ex-Div Date |
Gross Yield [%] |
| None |
None |
None |
None |
None |
Price Performance Snapshot
| Last Traded Price |
Change [%] |
1 Week [%] |
1 Month [%] |
3 Months [%] |
6 Months [%] |
12 Months [%] |
| $6.620 |
7.3 |
56.5 |
47.1 |
302.4 |
1439.5 |
2778.3 |
SRL Price Chart with Volume and 3EMA
SRL Short Positions
Click HERE to understand why the above moving averages have been chosen.
Ricegrowers Limited (ASX:SGLLV) is a rice food company handling paddy storage, milling, processing, and marketing of rice products globally. Operating in Australia, New Zealand, and international markets, it also provides animal feed, gourmet foods, and serves retail, wholesale, and food service sectors.
Ticker code: SGLLV
Market Information
| Market Capitalisation |
Enterprise Value |
Shares Outstanding |
Free Float [%] |
Free Float Value |
| $1,124,523,989 |
$1,342,750,989 |
68152969.0 |
79.59 |
$895,060,733 |
Balance Sheet & Quality
| Equity |
Cash |
Debt |
Return On Equity (ROE) |
EBITDA 25 Margin [%] |
Net Debt / Equity [%] |
Rule of 40 |
| $637,911,758 |
$66,993,000 |
$285,220,000 |
10.5 |
8.1 |
34.2 |
5.6 |
Technicals & Short Data
| 3EMA Status |
Volatility [%] |
Value Traded Today |
Average Daily Liquidity |
Short [%] |
Days To Cover |
| Partial |
None |
$619,905 |
$2,072,780 |
None |
0.0 |
Dividends
| Previous Dividend |
Last Dividend |
Franking [%] |
Ex-Div Date |
Gross Yield [%] |
| $0.150 |
$0.500 |
100.0 |
2025-07-01 |
0.0 |
Price Performance Snapshot
| Last Traded Price |
Change [%] |
1 Week [%] |
1 Month [%] |
3 Months [%] |
6 Months [%] |
12 Months [%] |
| $16.500 |
-0.7 |
0.9 |
-3.7 |
4.4 |
56.8 |
69.5 |
SGLLV Price Chart with Volume and 3EMA
SGLLV Short Positions
Click HERE to understand why the above moving averages have been chosen.
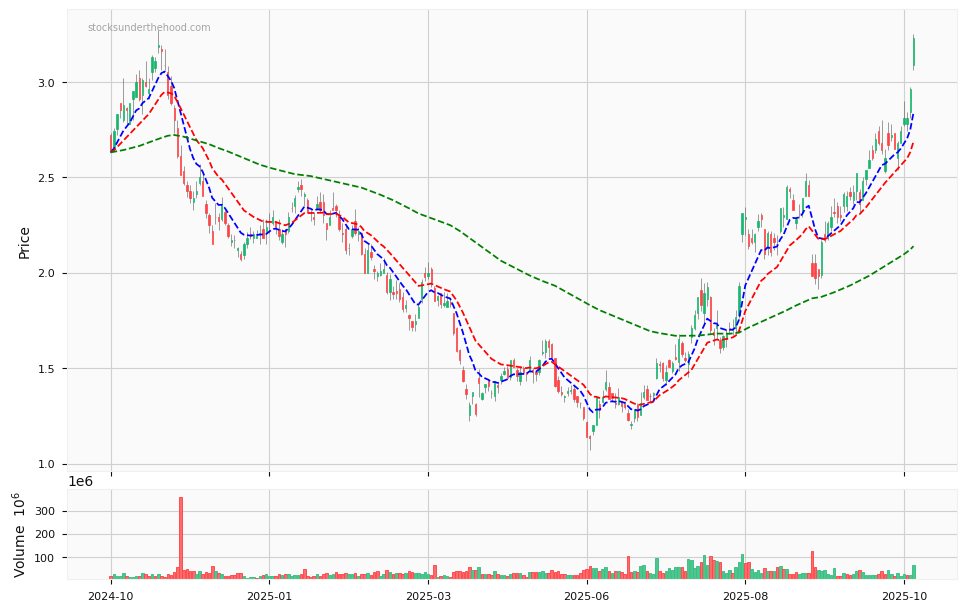
Cobram Estate Olives Limited (ASX:CBO) is an olive farming and production company specializing in premium extra virgin olive oil in Australia and the USA. It markets brands like Cobram Estate and Red Island, with segments in innovation and value-added products.
Ticker code: CBO
Market Information
| Market Capitalisation |
Enterprise Value |
Shares Outstanding |
Free Float [%] |
Free Float Value |
| $1,479,974,647 |
$1,752,317,631 |
477411191.0 |
62.88 |
$930,679,432 |
Balance Sheet & Quality
| Equity |
Cash |
Debt |
Return On Equity (ROE) |
EBITDA 25 Margin [%] |
Net Debt / Equity [%] |
Rule of 40 |
| $416,302,554 |
$4,803,000 |
$277,145,984 |
11.0 |
34.7 |
65.4 |
46.1 |
Technicals & Short Data
| 3EMA Status |
Volatility [%] |
Value Traded Today |
Average Daily Liquidity |
Short [%] |
Days To Cover |
| Partial |
3.5 |
$623,525 |
$2,424,885 |
1.19 |
7.3 |
Dividends
| Previous Dividend |
Last Dividend |
Franking [%] |
Ex-Div Date |
Gross Yield [%] |
| $0.033 |
$0.045 |
100.0 |
2025-11-06 |
1.5 |
Price Performance Snapshot
| Last Traded Price |
Change [%] |
1 Week [%] |
1 Month [%] |
3 Months [%] |
6 Months [%] |
12 Months [%] |
| $3.100 |
1.0 |
0.3 |
-7.5 |
-0.8 |
57.3 |
57.3 |
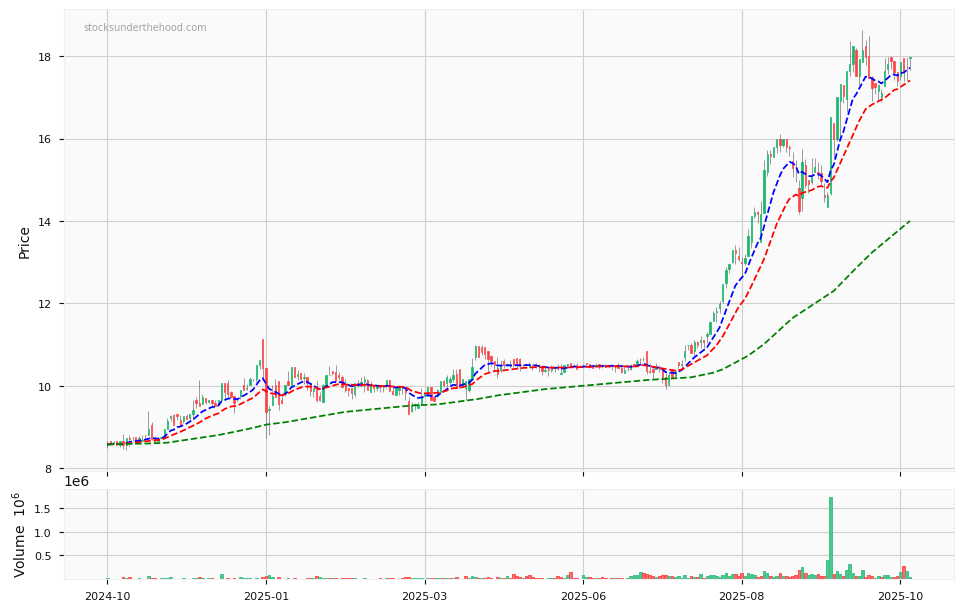
CBO Price Chart with Volume and 3EMA
CBO Short Positions
Click HERE to understand why the above moving averages have been chosen.
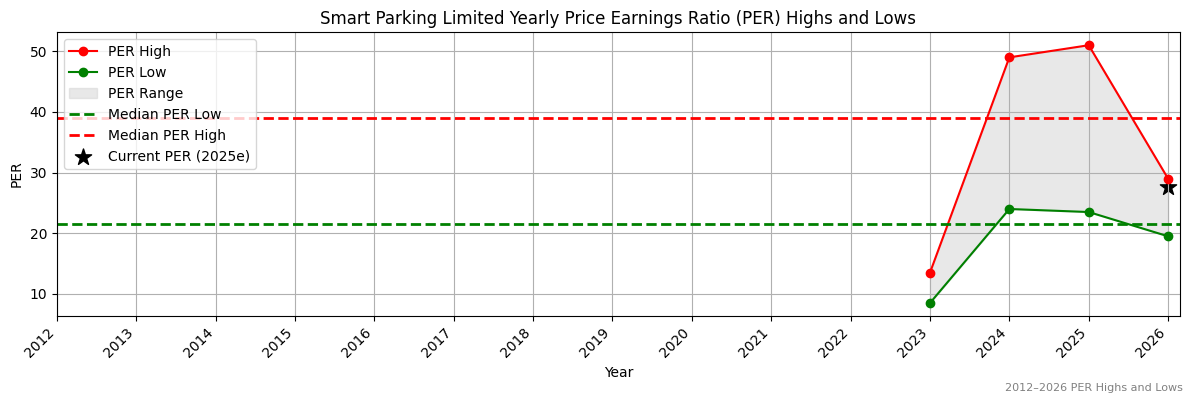
Ticker code: SPZ
SPZ Red Flags & Risk Indicators
⚠️
⚠️ RED FLAGS: 1 identified
Income Statement
| Revenue 2024 Per Share |
Revenue 2025e Per Share |
Revenue 2026e Per Share |
Revenue 24 to 25e [%] |
Revenue 25e to 26e [%] |
EBITDA 2024 Per Share |
EBITDA 2025e Per Share |
EBITDA 2026e Per Share |
EBITDA 24 to 25e [%] |
EBITDA 25e to 26e [%] |
| 0.15602 |
0.2214 |
0.25923 |
41.9 |
17.1 |
0.03973 |
0.04935 |
0.0766 |
24.2 |
55.2 |
SPZ Revenue Per Share (2012–2027)
✅✅
SPZ Earnings before Interest, Tax, Depreciation and Amortisation (EBITDA) Per Share (2012–2027)
✅✅
SPZ Normalised Earnings Per Share (EPS) (2012–2027)
✅✅
Valuation
| Price To Sales |
Price To Book |
PER 2023 |
PER 2024 |
13Y Median PER Low |
PER 2025e |
13Y Median PER High |
PER 2026e |
Last Updated |
| 6.8 |
5.9 |
63.0 |
126.0 |
21.5 |
63.0 |
39.0 |
31.5 |
23/10/25 |
SPZ Yearly Price Earnings Ratio (PER) Highs and Lows
❌
SPZ Weekly Price Chart with Average True Range (ATR) Trailing Stop (10-Year View)