CBOE Volatility Index measures the stock market’s expectation of volatility based on S&P 500 index options.
Ticker code: ^VIX
Sector: Volatility | Industry: Index | Website: N/A
Market Information
| Market Capitalisation | Enterprise Value | Shares Outstanding | Free Float [%] | Free Float Value |
|---|---|---|---|---|
| None | None | None | 0.0 | None |
Balance Sheet & Quality
| Equity | Cash | Debt | Return On Equity (ROE) | EBITDA 25 Margin [%] | Net Debt / Equity [%] | Rule of 40 |
|---|---|---|---|---|---|---|
| None | None | None | None | None | 0.0 | None |
Technicals & Short Data
| 3EMA Status | Volatility [%] | Value Traded Today | Average Daily Liquidity | Short [%] | Days To Cover |
|---|---|---|---|---|---|
| None | None | $0 | $0 | None | 0.0 |
Dividends
| Previous Dividend | Last Dividend | Franking [%] | Ex-Div Date | Gross Yield [%] |
|---|---|---|---|---|
| None | None | None | None | None |
Price Performance Snapshot
| Last Traded Price | Change [%] | 1 Week [%] | 1 Month [%] | 3 Months [%] | 6 Months [%] | 12 Months [%] |
|---|---|---|---|---|---|---|
| $26.420 | 11.7 | 33.2 | 42.0 | 77.0 | 5.0 | 29.8 |
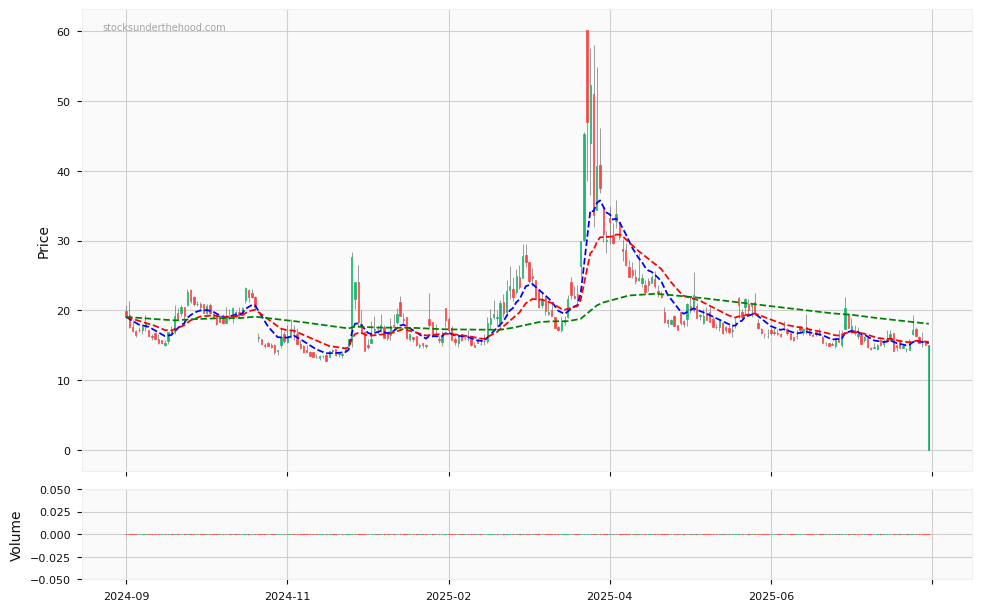
^VIX Price Chart with Volume and 3EMA
^VIX Short Positions
No chart available for this company.
Click HERE to understand why the above moving averages have been chosen.