Abacus Group is a diversified property group specializing in investment and development of commercial, retail, and industrial properties across Australia and New Zealand.
Ticker code: ABG
Sector: Real Estate | Industry: REIT – Diversified | Website: https://www.abacusgroup.com.au
Market Information
| Market Capitalisation | Enterprise Value | Shares Outstanding | Free Float [%] | Free Float Value |
|---|---|---|---|---|
| $1,076,857,472 | $1,995,010,944 | 893657633.0 | 45.8 | $493,243,999 |
Balance Sheet & Quality
| Equity | Cash | Debt | Return On Equity (ROE) | EBITDA 25 Margin [%] | Net Debt / Equity [%] | Rule of 40 |
|---|---|---|---|---|---|---|
| $1,563,007,217 | $23,946,000 | $942,099,008 | None | None | 58.7 | None |
Technicals & Short Data
| 3EMA Status | Volatility [%] | Value Traded Today | Average Daily Liquidity | Short [%] | Days To Cover |
|---|---|---|---|---|---|
| Positive | 3.0 | $883,594 | $1,050,900 | None | 0.0 |
Dividends
| Previous Dividend | Last Dividend | Franking [%] | Ex-Div Date | Gross Yield [%] |
|---|---|---|---|---|
| $0.043 | $0.043 | None | 2025-06-30 | None |
Price Performance Snapshot
| Last Traded Price | Change [%] | 1 Week [%] | 1 Month [%] | 3 Months [%] | 6 Months [%] | 12 Months [%] |
|---|---|---|---|---|---|---|
| $1.205 | None | -2.4 | 2.6 | -0.8 | 5.5 | 13.2 |
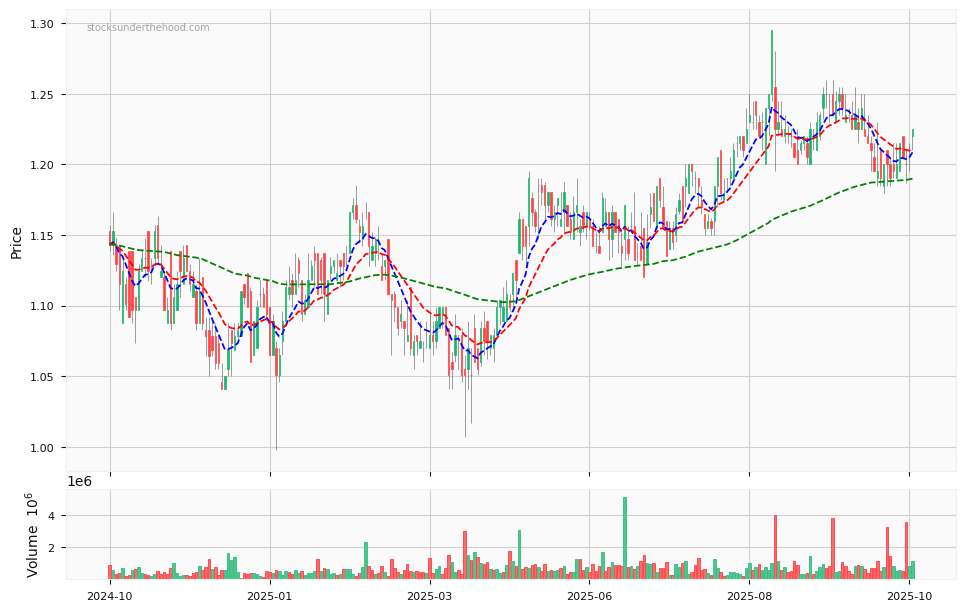
ABG Price Chart with Volume and 3EMA
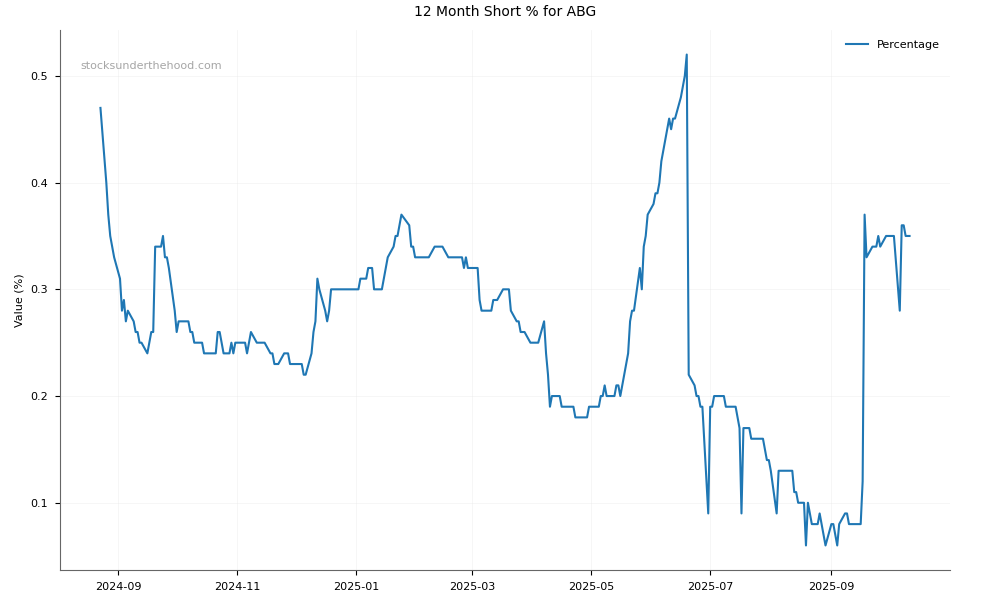
ABG Short Positions
Click HERE to understand why the above moving averages have been chosen.