AGL Energy Limited supplies energy and essential services to residential, business, and wholesale customers. It operates in retail, electricity generation, and storage using wind, hydro, solar, coal, and gas.
Ticker code: AGL
Sector: Utilities | Industry: Utilities – Independent Power Producers | Website: https://www.agl.com.au
Market Information
| Market Capitalisation | Enterprise Value | Shares Outstanding | Free Float [%] | Free Float Value |
|---|---|---|---|---|
| $6,263,277,022 | $9,246,277,150 | 672747233 | 88.89 | $5,567,677,473 |
Balance Sheet & Quality
| Equity | Cash | Debt | Return On Equity (ROE) | EBITDA 25 Margin [%] | Net Debt / Equity [%] | Rule of 40 |
|---|---|---|---|---|---|---|
| $4,857,908,032 | $335,000,000 | $3,318,000,128 | 13.2 | 14.0 | 61.4 | 22.3 |
Technicals & Short Data
| 3EMA Status | Volatility [%] | Value Traded Today | Average Daily Liquidity | Short [%] | Days To Cover |
|---|---|---|---|---|---|
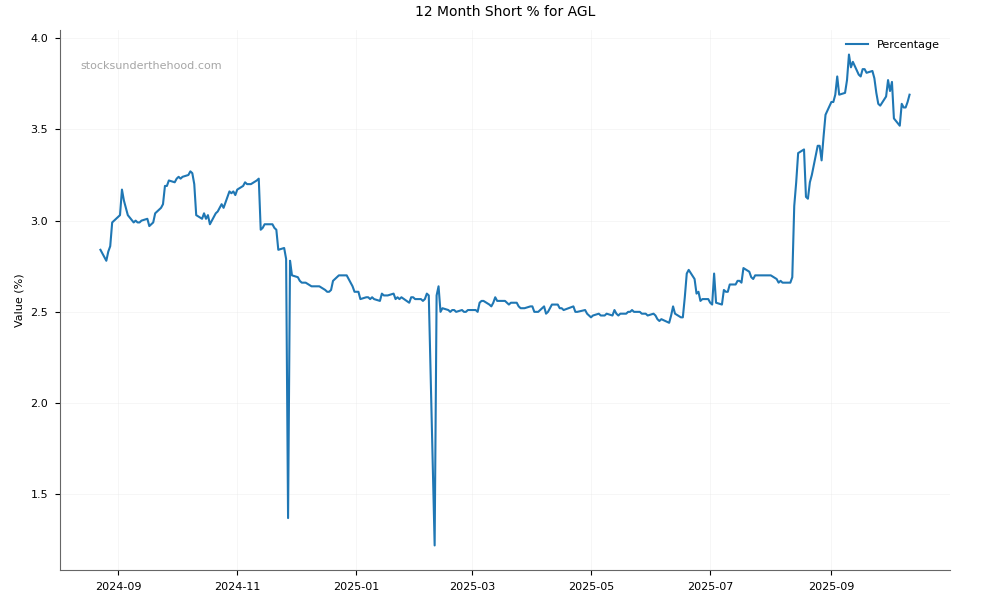
| Positive | 3.9 | $17,646,603 | $26,124,168 | 3.34 | 8.0 |
Dividends
| Previous Dividend | Last Dividend | Franking [%] | Ex-Div Date | Gross Yield [%] |
|---|---|---|---|---|
| $0.230 | $0.250 | None | 2025-08-26 | 2.7 |
Price Performance Snapshot
| Last Traded Price | Change [%] | 1 Week [%] | 1 Month [%] | 3 Months [%] | 6 Months [%] | 12 Months [%] |
|---|---|---|---|---|---|---|
| $9.310 | -0.3 | -0.1 | 2.8 | 13.1 | -7.5 | -10.2 |
AGL Price Chart with Volume and 3EMA

AGL Short Positions
Click HERE to understand why the above moving averages have been chosen.