AMP Limited is a wealth management company based in Australia, providing financial advice, superannuation, retirement income, banking, and investment products. With a history spanning over 170 years, AMP serves customers across Australia and New Zealand, helping them achieve their financial goals.
Ticker code: AMP
Sector: Financial Services | Industry: Financial Conglomerates | Website: https://www.amp.com.au
Market Information
| Market Capitalisation | Enterprise Value | Shares Outstanding | Free Float [%] | Free Float Value |
|---|---|---|---|---|
| $4,481,179,467 | $31,601,178,827 | 2531739839 | 99.14 | $4,442,715,790 |
Balance Sheet & Quality
| Equity | Cash | Debt | Return On Equity (ROE) | EBITDA 25 Margin [%] | Net Debt / Equity [%] | Rule of 40 |
|---|---|---|---|---|---|---|
| $3,739,379,654 | $1,706,000,000 | $28,825,999,360 | 7.4 | 30.2 | 725.3 | 35.6 |
Technicals & Short Data
| 3EMA Status | Volatility [%] | Value Traded Today | Average Daily Liquidity | Short [%] | Days To Cover |
|---|---|---|---|---|---|
| Positive | 4.4 | $4,466,230 | $10,851,289 | 0.91 | 3.8 |
Dividends
| Previous Dividend | Last Dividend | Franking [%] | Ex-Div Date | Gross Yield [%] |
|---|---|---|---|---|
| $0.010 | $0.020 | 100.0 | 2025-08-21 | 1.6 |
Price Performance Snapshot
| Last Traded Price | Change [%] | 1 Week [%] | 1 Month [%] | 3 Months [%] | 6 Months [%] | 12 Months [%] |
|---|---|---|---|---|---|---|
| $1.770 | -0.6 | 3.2 | 3.2 | 5.0 | 44.4 | 12.7 |
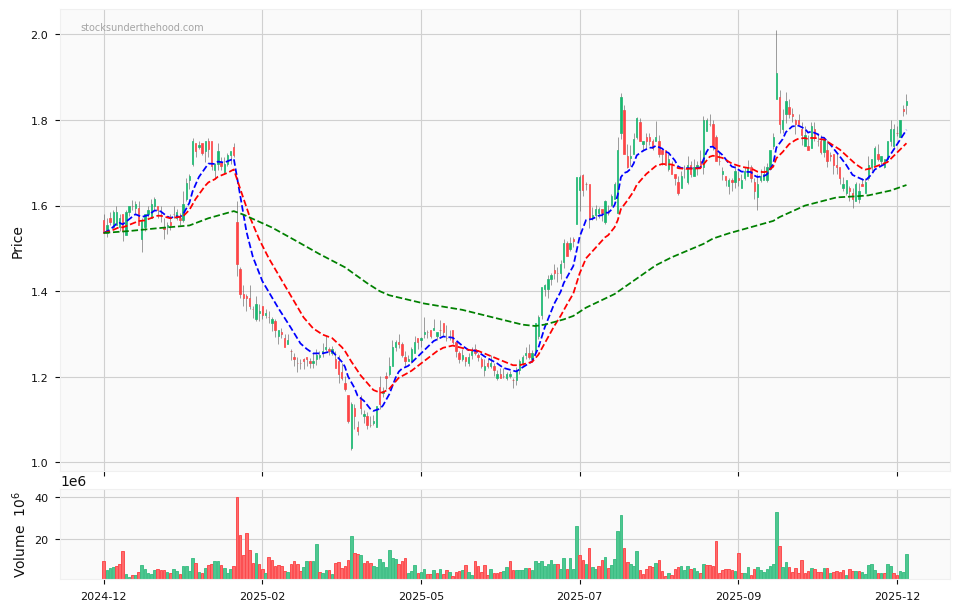
AMP Price Chart with Volume and 3EMA
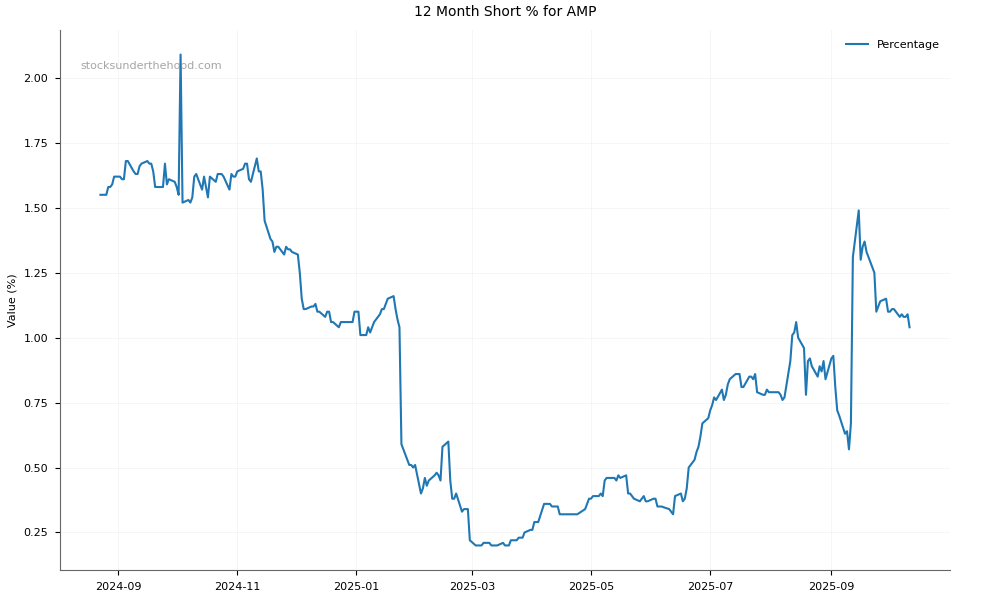
AMP Short Positions
Click HERE to understand why the above moving averages have been chosen.