Appen Limited is a global leader in the development of high-quality, human-annotated datasets for machine learning and artificial intelligence applications. The company provides data collection, annotation, and evaluation services to technology companies and organizations worldwide.
Ticker code: APX
Sector: Technology | Industry: Information Technology Services | Website: https://www.appen.com
Market Information
| Market Capitalisation | Enterprise Value | Shares Outstanding | Free Float [%] | Free Float Value |
|---|---|---|---|---|
| $187,255,496 | $136,283,496 | 265610639 | 86.42 | $161,833,758 |
Balance Sheet & Quality
| Equity | Cash | Debt | Return On Equity (ROE) | EBITDA 25 Margin [%] | Net Debt / Equity [%] | Rule of 40 |
|---|---|---|---|---|---|---|
| $97,213,492 | $60,865,000 | $9,893,000 | -19.1 | 2.4 | -52.4 | -7.6 |
Technicals & Short Data
| 3EMA Status | Volatility [%] | Value Traded Today | Average Daily Liquidity | Short [%] | Days To Cover |
|---|---|---|---|---|---|
| Negative | 5.7 | $423,102 | $1,735,692 | 2.67 | 2.9 |
Dividends
| Previous Dividend | Last Dividend | Franking [%] | Ex-Div Date | Gross Yield [%] |
|---|---|---|---|---|
| None | None | 50.0 | 2022-03-01 | 0.0 |
Price Performance Snapshot
| Last Traded Price | Change [%] | 1 Week [%] | 1 Month [%] | 3 Months [%] | 6 Months [%] | 12 Months [%] |
|---|---|---|---|---|---|---|
| $0.705 | -0.7 | 2.9 | 0.7 | -19.4 | -38.4 | -67.5 |
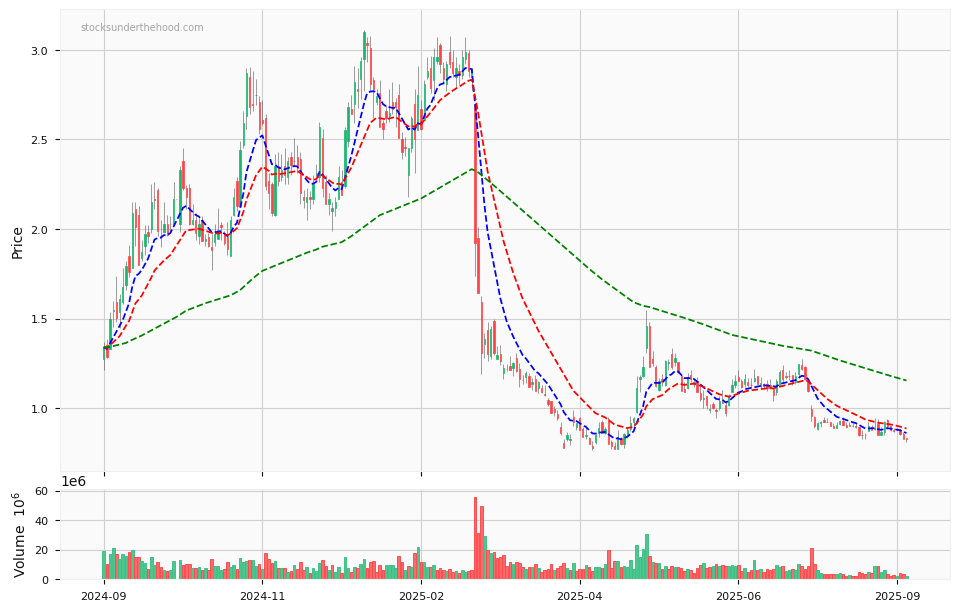
APX Price Chart with Volume and 3EMA
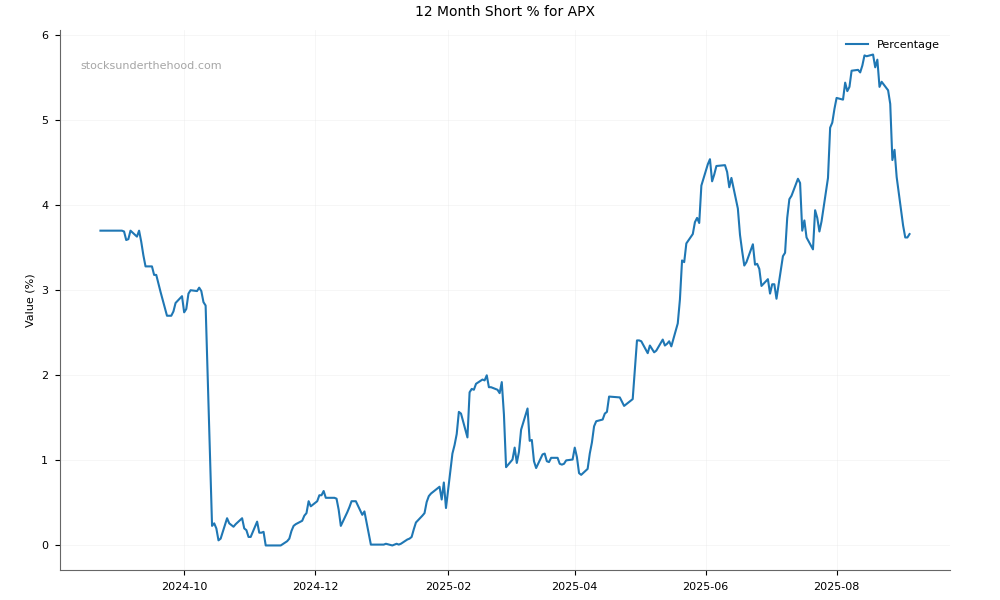
APX Short Positions
Click HERE to understand why the above moving averages have been chosen.