Apple designs, manufactures, and sells consumer electronics, including iPhones, Mac computers, iPads, and wearables, along with services like the App Store and iCloud. It is known for its strong ecosystem, premium branding, and innovation in hardware and software.
Ticker code: AAPL
Sector: Technology | Industry: Consumer Electronics | Website: https://www.apple.com
Market Information
| Market Capitalisation | Enterprise Value | Shares Outstanding | Free Float [%] | Free Float Value |
|---|---|---|---|---|
| $3,900,351,408,494 | $3,946,677,410,158 | 14840390000 | 99.79 | $3,892,277,681,158 |
Balance Sheet & Quality
| Equity | Cash | Debt | Return On Equity (ROE) | EBITDA 25 Margin [%] | Net Debt / Equity [%] | Rule of 40 |
|---|---|---|---|---|---|---|
| $65,757,771,721 | $55,372,001,280 | $101,698,002,944 | 166.8 | 33.8 | 70.4 | 42.0 |
Technicals & Short Data
| 3EMA Status | Volatility [%] | Value Traded Today | Average Daily Liquidity | Short [%] | Days To Cover |
|---|---|---|---|---|---|
| Positive | 2.3 | $9,656,900,394 | $14,383,822,566 | None | 0.0 |
Dividends
| Previous Dividend | Last Dividend | Franking [%] | Ex-Div Date | Gross Yield [%] |
|---|---|---|---|---|
| $0.260 | $0.260 | None | 2025-08-11 | 0.2 |
Price Performance Snapshot
| Last Traded Price | Change [%] | 1 Week [%] | 1 Month [%] | 3 Months [%] | 6 Months [%] | 12 Months [%] |
|---|---|---|---|---|---|---|
| $262.820 | 1.2 | 0.2 | 2.9 | 23.0 | 25.4 | 14.8 |
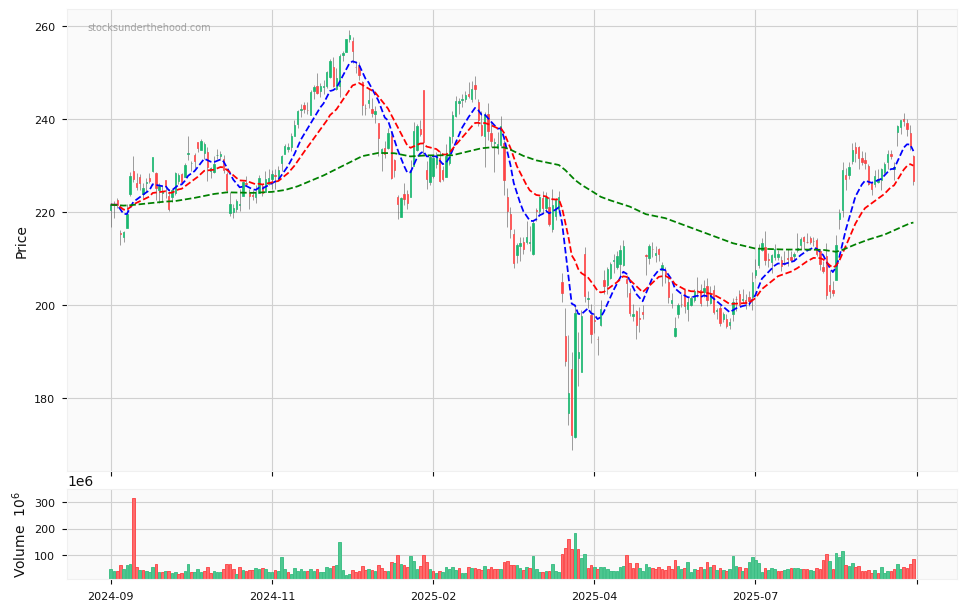
AAPL Price Chart with Volume and 3EMA
AAPL Short Positions
No chart available for this company.
Click HERE to understand why the above moving averages have been chosen.