Arafura Resources Limited is engaged in the exploration and development of rare earth mineral resources in Australia.
Ticker code: ARU
Sector: Basic Materials | Industry: Other Industrial Metals & Mining | Website: https://www.arultd.com
Market Information
| Market Capitalisation | Enterprise Value | Shares Outstanding | Free Float [%] | Free Float Value |
|---|---|---|---|---|
| $861,311,936 | $626,106,432 | 3377693994.0 | 65.08 | $560,536,183 |
Balance Sheet & Quality
| Equity | Cash | Debt | Return On Equity (ROE) | EBITDA 25 Margin [%] | Net Debt / Equity [%] | Rule of 40 |
|---|---|---|---|---|---|---|
| $206,039,323 | $27,178,292 | $237,623 | None | None | -13.1 | None |
Technicals & Short Data
| 3EMA Status | Volatility [%] | Value Traded Today | Average Daily Liquidity | Short [%] | Days To Cover |
|---|---|---|---|---|---|
| Partial | 7.1 | $7,237,394 | $9,907,076 | None | 0.0 |
Dividends
| Previous Dividend | Last Dividend | Franking [%] | Ex-Div Date | Gross Yield [%] |
|---|---|---|---|---|
| None | None | None | None | None |
Price Performance Snapshot
| Last Traded Price | Change [%] | 1 Week [%] | 1 Month [%] | 3 Months [%] | 6 Months [%] | 12 Months [%] |
|---|---|---|---|---|---|---|
| $0.255 | -1.9 | -5.6 | -7.3 | 34.2 | 45.7 | 112.5 |
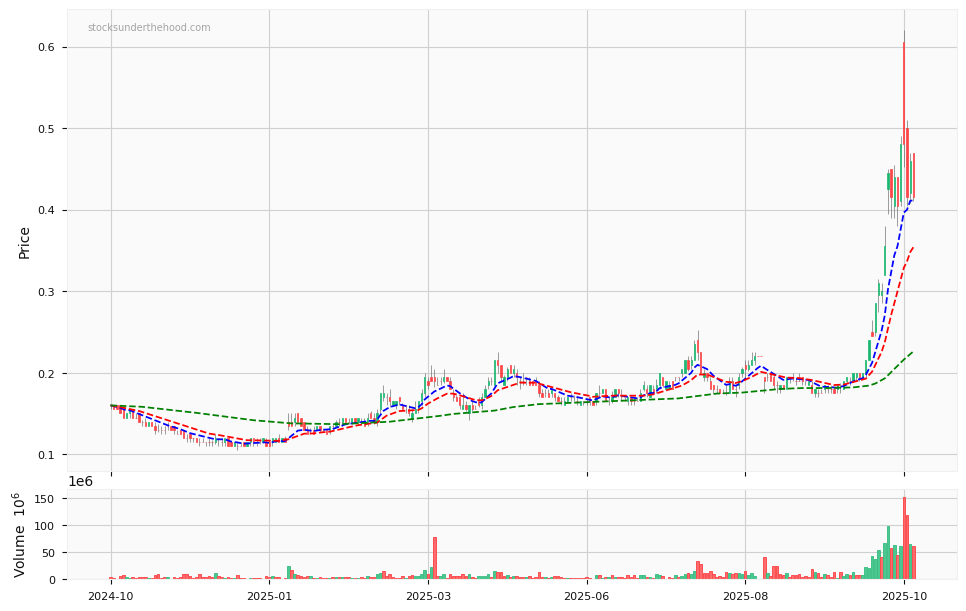
ARU Price Chart with Volume and 3EMA
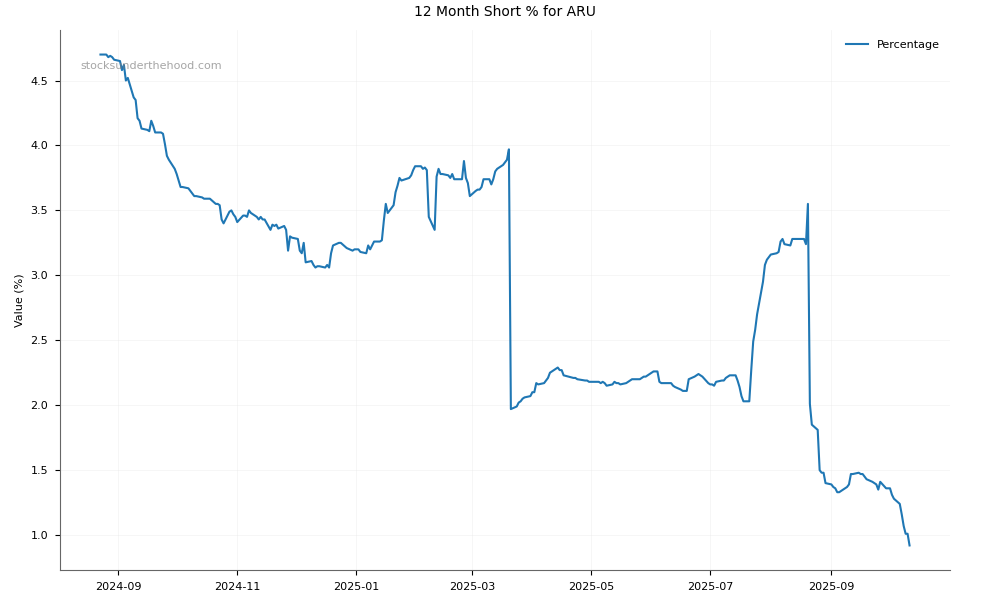
ARU Short Positions
Click HERE to understand why the above moving averages have been chosen.